www.atmos-chem-phys.net/13/1115/2013/ doi:10.5194/acp-13-1115-2013
© Author(s) 2013. CC Attribution 3.0 License.
Atmospheric
Chemistry
and Physics
Geoscientiic
Geoscientiic
Geoscientiic
Geoscientiic
Impact of relative humidity and particles number size distribution
on aerosol light extinction in the urban area of Guangzhou
Z. J. Lin1,2, J. Tao2, F. H. Chai3, S. J. Fan1, J. H. Yue2, L. H. Zhu1,2, K. F. Ho4, and R. J. Zhang5
1Department of Atmospheric Science, Sun Yat-Sen University, Guangzhou, China 2South China Institute of Environmental Sciences, Guangzhou, China
3Chinese Research Academy of Environmental Sciences, Beijing, China
4School of Public Health and Primary Care, The Chinese University of Hong Kong, Hongkong, China 5RCE-TEA, Institute of Atmospheric Physics, Chinese Academy of Sciences, Beijing, China
Correspondence to:S. J. Fan ([email protected])
Received: 6 June 2012 – Published in Atmos. Chem. Phys. Discuss.: 22 June 2012 Revised: 4 December 2012 – Accepted: 17 December 2012 – Published: 1 February 2013
Abstract.In the urban area of Guangzhou, observations on aerosol light extinction effect were conducted at a monitor-ing site of the South China Institute of Environmental Sci-ences (SCIES) during April 2009, July 2009, October 2009 and January 2010. The main goal of these observations is to recognise the impact of relative humidity (RH) and par-ticles number distribution on aerosol light extinction. PM2.5 was sampled by Model PQ200 air sampler; ions and OC/EC in PM2.5were identified by the Dionex ion chromatography and the DRI model 2001 carbon analyser, respectively; par-ticles number size distribution was measured by TSI 3321 APS, while total light scattering coefficient was measured by TSI 3563 Nephelometer. Chemical composition of PM2.5 was reconstructed by the model ISORROPIA II. As a re-sult, possible major components in PM2.5were (NH4)2SO4, Na2SO4, K2SO4, NH4NO3, HNO3, water, POM and EC. Re-garding ambient RH, mass concentration of PM2.5 ranged from 26.1 to 279.1 µg m−3and had an average of 94.8, 44.6, 95.4 and 130.8 µg m−3 in April, July, October and January, respectively. With regard to the total mass of PM2.5,
inor-ganic species, water, POM, EC and the Residual accounted for 34–47 %, 19–31 %, 14–20 %, 6–8 % and 8–17 %, respec-tively. Under the assumption of “internal mixture”, optical properties of PM0.5−20 were estimated following the Mie Model. Optical refractive index, hygroscopic growth factor and the dry aerosol density required by the Mie Model were determined with an understanding of chemical composition of PM2.5. With these three parameters and the validated
parti-cles number size distribution of PM0.5−20, the temporal
vari-ation trend of optical property of PM0.5−20 was estimated with good accuracy. The highest average ofbep,pm0.5−20was 300 Mm−1in April while the lowest one was 78.6 Mm−1in July. Regarding size distribution ofbep,pm0.5−20, peak value was almost located in the diameter range between 0.5 and 1.0 µm. Furthermore, hygroscopic growth of optical proper-ties of PM0.5−20largely depended on RH. As RH increased, bep,pm0.5−20 grew and favoured a more rapid growth when aerosol had a high content of inorganic water-soluble salts. Averagely,fbep,pm0.5−20 enlarged 1.76 times when RH in-creased from 20 % to 90 %. With regard to the temporal vari-ation of ambient RH,fbep,pm0.5−20was 1.29, 1.23, 1.14 and 1.26 on average in April, July, October and January, respec-tively.
1 Introduction
Aerosol pollution affects radiation budget of the Earth-Atmosphere system by its light extinction. As a result, the global climate changes dramatically (Seinfeld and Pandis, 2006). On the basis of the Mie Model (Bohren and Huffman, 1998), this effect of light extinction can be quantified with the knowledge of single particle light extinction efficiency and particles number size distribution.
organic carbon (OC), element carbon (EC) and crustal el-ements. Moreover, soluble inorganic salts and water-soluble fraction of organic matters absorb water when rela-tive humidity (RH) increases. Subsequently, numerical mod-els like ISORROPIA II (Fountoukis and Nenes, 2007), E-AIM (Wexler and Clegg, 2002) and “Sea Salt” (Eichler et al., 2008) have been developed to recognise the chemical and physical forms of species in aerosol particle at the equilib-rium state. However, few details about determining the opti-cal refractive index (ORI) of aerosol particle based on these models were reported.
In Pearl River Delta (PRD) region of China, air visibility degradation in recent years due to an enhancing effect of light extinction made the public and scientists focus attentions on aerosol pollution. And the phenomenon of this pollution was reported in lots of studies (Wang et al., 2003; Bergin et al., 2004; Louie et al., 2005; Wu et al., 2005; Deng et al., 2008a, b; Tie and Cao, 2009). Furthermore, a series of regional inte-grated field experiments for investigating this pollution were carried out during 2004 and 2008, which mainly concerned:
– chemical transformations among air pollutants and the influence of regional meteorological conditions on pol-lution episode (Fan et al., 2008; Su et al., 2008; Zhang et al., 2008a, b; Fan et al., 2011);
– aerosol size-resolved chemical composition and the po-tential pollutant sources (Gnauk et al., 2008; Liu et al., 2008a, b; Jung et al., 2009; Xiao et al., 2011; Yu et al., 2010; Yue et al., 2010);
– mixture state between EC and the other non-light-absorption species in particles (Cheng et al., 2006, 2008b);
– aerosol optical properties, their hygroscopicity and ra-diative direct forcing (Andreae et al., 2008; Cheng et al., 2008a, b; Eichler et al., 2008; Liu et al., 2010). Besides the measurement by optical instruments, the Mie Model served as quite an important tool in these experiments because it provided information on the influence of chem-ical composition and particles number size distribution on aerosol optical properties.
Guangzhou is one of the mega cities in PRD region, while it is also one of the monitoring sites in the field experiment mentioned above. For the purpose of an updated and comple-mentary study on aerosol light extinction in the urban area of this city, four months’ observation on chemical composi-tion and particles number size distribucomposi-tion were carried out at the monitoring site of SCIES (South China Institute of En-vironmental Sciences) during April 2009, July 2009, Octo-ber 2009 and January 2010 which represented spring, sum-mer, autumn and winter, respectively. In the light of mea-surement techniques and numerical models adopted in the previous field experiments, current study tries to reconstruct aerosol chemical composition following the ISORROPIA II
model at first, then to estimate the extent of light extinction effect with a practical method that was based on the result derived from APS (Aerodynamic Particle Sizer) and PM2.5 sampling. RH dependence of aerosol optical properties will also be discussed.
2 Experiment
2.1 Monitoring site
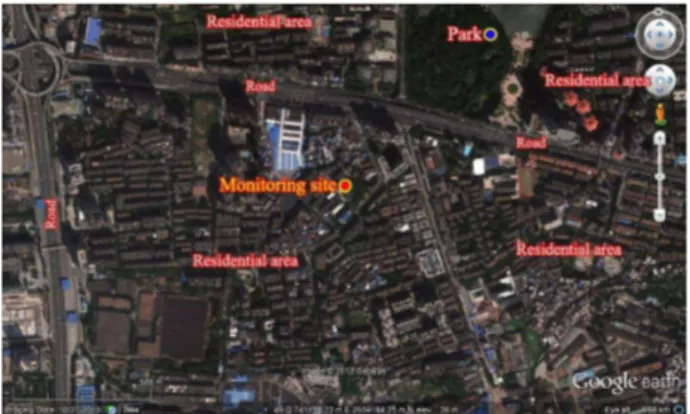
The monitoring site of SCIES is located in the urban area of Guangzhou, whose geographical coordinates are 23◦07′N and 113◦21′E. For monitoring air quality influenced by pol-lutants’ regional transport and local sources’ emission, in-struments were all installed on the roof of the building 53 m above the ground. This site was built with a clear vision of over 300 degrees, around which there is a residential area and a park about 500 m northeast of it. There is no big air pollution source within a circumference of 3 km except mo-bile emissions. A satellite photo depicting the site’s location and its surroundings is illustrated in Fig. 1. So far, data on aerosol samples, gaseous pollutants and meteorological pa-rameters have been recorded over a long period of time, some of which were once reported in a previous study (Tao et al., 2009).
2.2 Sampling and analysis
2.2.1 Aerosol sampling
PM2.5samples were measured by an air sampler (BGI Cor-poration, Model PQ200) equipped with a cyclone that sepa-rates PM2.5particles from the aerosol population and with a vacuum pump that draws air at a flow rate of 16.7 L min−1. The drawn airstream was connected to a 47 mm quartz filter (Whatman, QM-A). Before sampling, the quartz filters were baked at 800◦C for more than 3 h to remove adsorbed or-ganic vapours, and then equilibrated in desiccators for 24 h. Prior to the measurement in ambient, the flow rate of PM2.5 sampler was calibrated. Blank filters were collected and used to subtract the positive artifact caused by gas absorption. To-tally, 123 daily quartz-filter samples with some blank ones were collected for every 23.5 h (starting at 10:00 LST each day and ending at 09:30 LST the following day) in the four months. The analysis-ready samples were stored in a freezer at about−20◦C in case of particle volatilisation.
Fig. 1.Satellite photo of the monitoring site and surroundings (from Google Earth).
its original intensity after oxygen [O2] added to that analy-sis atmosphere; and three EC fractions (EC1, EC2 and EC3) were determined at 580◦C, 740◦C and 840◦C, respectively, in a (2 %)O2/(98 %)[He] atmosphere. IMPROVE TOR OC is practically defined as OC1+OC2+OC3+OC4+OP, while EC is defined as EC1+EC2+EC3−OP (Chow et al., 2007). Inter-laboratory sample comparisons between ap-plying the IMPROVE TOR protocol and the TMO (thermal manganese dioxide oxidation) approach have shown the dif-ferences being lower than 5 % for TC and 10 % for OC and EC (Chow et al., 2007). Average field blanks were 1.8 and 0.1 µg m−3for OC and EC, respectively.
In analysis of water-soluble ions, one quarter of the col-lected quartz filter sample was used to determine the ions’ mass concentrations. Four anions (SO24−, NO−3, Cl−and F−) and five cations (Na+, NH+
4, K+, Mg
2+and Ca2+)in aque-ous extracts from the filter were determined by ion chro-matography (Dionex Corp, Sunnyvale, CA, Model Dionex 600). For these extractions, each sample was put into a sep-arate 20 mL vial containing 10 mL distilled-deionised wa-ter (18 Mresistivity), and shaken first by an ultrasonic in-strument for 60 min, then by a mechanical shaker for 1 h for a complete extraction. The extracts were stored at 4◦C in a pre-cleaned tube before further analysis. Cation (Na+, NH+4, K+, Mg2+and Ca2+)concentrations were determined with a CS12A column (Dionex Corp, Sunnyvale, CA.) and 20 mmol L−1 MSA eluent. Anions (SO24−, NO−3, Cl− and F−)were separated by an AS11-HC column (Dionex Corp, Sunnyvale, CA) and 20 mmol L−1KOH eluent. The limits of detection were less than 0.05 mg L−1for both cations and an-ions. Standard reference materials produced by the National Research Centre for Certified Reference Materials in China were analysed for the purposes of quality assurance. Blank values were subtracted from sample concentrations (Shen et al., 2008).
It is said that there may be artifacts when using quartz fil-ter for PM2.5sampling. However, the high loading of PM2.5 together with the damp climate in Guangzhou can block the
Teflon filter easily, which affects the flow rate of the sampler and increases the sampling error. For this reason, there were studies (Shen et al., 2009; Wang et al., 2011) on aerosol sam-pling in China using the quartz filter. Moreover, though the loss of quartz filter debris may lead to the underestimation of aerosol mass, careful operations in the process of sampling and mass weighing minimised this loss as much as possible in the current study.
The field blanks were determined and the average values of 12 blank filters of Na+, NH+4, K+, Mg2+, Ca2+, F−, Cl−, NO−
3, and SO 2−
4 were 0.671±0.091, 0.002±0.002, 0.005±0.006, 0.006±0.007, 0.052±0.064, 0.168±0.036, 0.425±0.094, 0.077±0.096 and 0.362±0.082 mg L−1, re-spectively. Although the blank value of Na+, F−, Cl− and Ca2+were slightly higher than other species, blank filter was collected every 10 samples and the blank values were quite stable. All results in the present study were blank subtracted. Moreover, the values of ambient samples were significantly higher than the blank value, which can reduce the errors.
2.2.2 Measurement of particles number size distribution
Particles number size distribution of PM0.5−20was measured by APS (TSI Aerodynamic Sizer, Model 3321) with 52 size bins in the diameter range from 0.5 to 20 µm by determin-ing the time-of-flight of an individual particle in an acceler-ating flow field. To capture dry particles, a drying tube was added in the process of drawing air. Flow rate of 5 L min−1 and 5 min data average were set in APS operation.
2.2.3 RH measurement
Ambient RH had been recorded every 30 min by an auto-matic weather station (VASALA Model QMH102).
2.2.4 Aerosol optical properties measurement
Total light scattering coefficient of aerosol was measured by an integrating Nephelometer (TSI Performance Mea-surement Tools, Model 3563) in wavelengths of 450 nm, 550 nm and 700 nm, respectively. Nephelometer calibration was performed by carbon dioxide (CO2)as high-span gas and filtered air as low-span gas. Nephelometer drew ambi-ent air through a temperature-controlled inlet at a flow rate of 20 L min−1. The inner heater controlled the RH of air in-take at a level lower than nearly 70 %. The output data were set to be 1 min average, and zero level data was measured continuously for 5 min after each hourly (60 min) sampling.
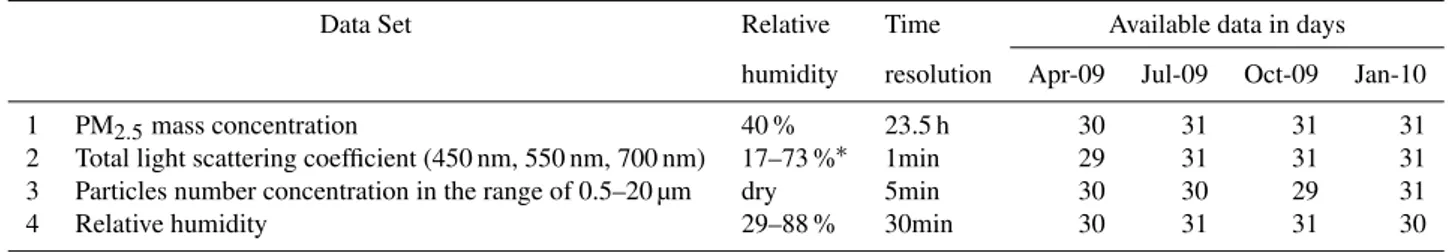
The aerosol properties and meteorological parameters measured during the four months’ observations are sum-marised in Table 1.
Table 1.Measured aerosol properties and meteorological parameters.
Data Set Relative Time Available data in days
humidity resolution Apr-09 Jul-09 Oct-09 Jan-10
1 PM2.5mass concentration 40 % 23.5 h 30 31 31 31 2 Total light scattering coefficient (450 nm, 550 nm, 700 nm) 17–73 %∗ 1min 29 31 31 31 3 Particles number concentration in the range of 0.5–20 µm dry 5min 30 30 29 31 4 Relative humidity 29–88 % 30min 30 31 31 30
∗Stands for the RH detected by a built-in RH sensor in Nephelometer.
correction factor. Furthermore, the results of particles num-ber concentration, total light scattering coefficient and RH were calculated into daily averages to be compatible with daily PM2.5samples. Blank records in these parameters were estimated by a linear interpolation based on those validated ones.
3 Methodology
3.1 Chemical composition reconstruction
On the basis of identified cations (Na+, NH+4, Ca2+, K+, Mg2+) and anions (SO24−, NO−3, Cl−), the model ISOR-ROPIA II was introduced to determine the chemical and physical forms of inorganic species and the content of water uptake. Currently, ISORROPIA II was set to solve a “For-ward” problem, the result of which was in “Metastable” state as aerosol particle was assumed to be composed of an aque-ous supersaturated solution. Accordingly, several aqueaque-ous species (Na+, HSO−4, SO24−, etc.) were determined, but to recognise their compound forms is still difficult.
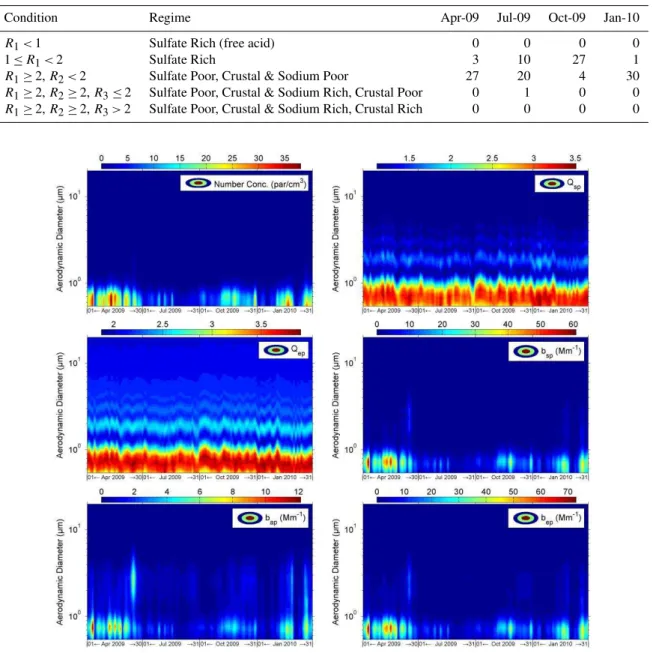
The present study intends to associate these aqueous species into possible compounds according to the five aerosol composition regimes defined in ISORROPIA II. These regimes are “Sulfate Rich (free acid)”; “Sulfate Rich”; “Sul-fate Poor, Crustal & Sodium Poor”; “Sul“Sul-fate Poor, Crustal & Sodium Rich, Crustal Poor” and “Sulfate Poor, Crustal & Sodium Rich, Crustal Rich”. Making use of the cations and anions identified in every PM2.5 sample, characteristic pa-rametersR1(Ratio of sum of Na+, NH+4, Ca2+, K+, Mg2+to SO24−),R2(Ratio of sum of Na+, Ca2+, K+, Mg2+to SO24−) andR3(Ratio of sum of Ca2+, K+, Mg2+to SO24−)defined by ISORROPIA II were calculated. With regard to their val-ues, chemical composition of each PM2.5sample was related to one of the five regimes. Furthermore, one is able to asso-ciate those aqueous species into compounds following sev-eral principles adopted by the model including:
– there is an electric charge balance in “Metastable” state;
– Na+and K+preferentially associate with SO2− 4 before combining with NO−3 and Cl− because SO24− is less volatile than NO−3 and Cl−;
– SO24− associates with Na+. If any remain, then it as-sociates with NH+4. The same assumption applies for HSO−4;
– gas species NH3, HCl and HNO3dissolve through the equilibria of the supersaturated aerosol system. Consequently, possible inorganic species were determined in the form of NH4HSO4, (NH4)2SO4, NaHSO4, Na2SO4, NH4NO3, NaNO3, NH4Cl, NaCl, K2SO4, MgSO4, CaSO4, KHSO4, H2SO4, NH3, HCl and HNO3. It should be noted that the volatilisation effect of NH4NO3 and other semi-volatile species was not investigated in the current study.
As the hygroscopicity of water-soluble inorganic salts is considered in ISORROPIA II, the content of water uptake in each PM2.5sample was also determined.
Particulate organic matter (POM) is an important chemical component, which was estimated by the content of OC being multiplied by a factor of 1.6 (Cao et al., 2007). On the other hand, the hygroscopicity of POM is not considered currently because:
– as a whole, the hygroscopic growth of Secondary Or-ganic Aerosol (SOA) was found to be around 1.2 at 90 % RH (Gysel et al., 2007; Stock et al., 2011);
– the hygroscopicity of some extracts from Water Soluble Organic Carbon (WSOC) has been recognised (Gysel et al., 2004). However, there is no WSOC speciation in the present study;
– water uptake by the aged organic aerosol accounted for only a few percent of total water uptake (Bougiatioti et al., 2009; Engelhart et al., 2011);
– unlike the water-soluble inorganic salts, a more accu-rate RH dependence curve of POM has not been well established;
– organic species have not been included in the ISOR-ROPIA II model.
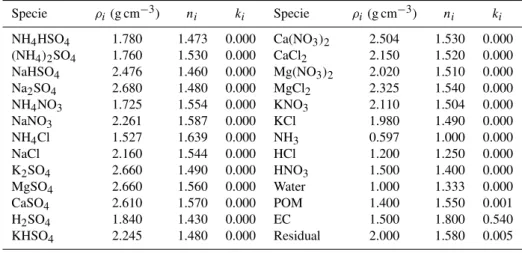
Table 2.Summary of the parameters for calculating the EORI and EGF.
Specie ρi(g cm−3) ni ki Specie ρi(g cm−3) ni ki
NH4HSO4 1.780 1.473 0.000 Ca(NO3)2 2.504 1.530 0.000 (NH4)2SO4 1.760 1.530 0.000 CaCl2 2.150 1.520 0.000 NaHSO4 2.476 1.460 0.000 Mg(NO3)2 2.020 1.510 0.000 Na2SO4 2.680 1.480 0.000 MgCl2 2.325 1.540 0.000 NH4NO3 1.725 1.554 0.000 KNO3 2.110 1.504 0.000 NaNO3 2.261 1.587 0.000 KCl 1.980 1.490 0.000 NH4Cl 1.527 1.639 0.000 NH3 0.597 1.000 0.000 NaCl 2.160 1.544 0.000 HCl 1.200 1.250 0.000 K2SO4 2.660 1.490 0.000 HNO3 1.500 1.400 0.000 MgSO4 2.660 1.560 0.000 Water 1.000 1.333 0.000 CaSO4 2.610 1.570 0.000 POM 1.400 1.550 0.001 H2SO4 1.840 1.430 0.000 EC 1.500 1.800 0.540 KHSO4 2.245 1.480 0.000 Residual 2.000 1.580 0.005
hygroscopic growth. In this regard, the content of the Resid-ual was the difference between PM2.5 and the sum of the identified species at 40 % RH. Furthermore, mass concentra-tion of PM2.5at any other RH condition can be calculated based on this determined content of the Residual.
3.2 Aerosol optical property estimation
In consideration of the APS measurement and PM2.5 sam-pling in the present study, an assumption of “internal mix-ture” was introduced into the Mie Model, which consid-ers every chemical component in a particle as homoge-neously mixing with each other (Jacobson, 2001; Bond and Bergstrom, 2006; Cheng et al., 2008c).
The EORI represents the “average” ORI of an “internal mixture” particle, which can be calculated with the ORI of each component following mixing rule of Volume-Average (Lesins et al., 2002). The formulas for the EORI are written as Eqs. (1) and (2).
neff=
X
i
ni·miρi !,
X
i
miρi !
(1)
keff=
X
i
ki·miρi !,
X
i
miρi !
(2)
In Eqs. (1) and (2),mi stands for mass concentration of the
i-th component in particles, whileρi is the density.
Respec-tively,ni is the real part of ORI of thei-th component,ki is
the imaginary part. Regarding the EORI,neffis the real part, andkeff is the imaginary part.
Furthermore, the EGF is the “average” hygroscopic growth factor, which can be calculated with Eq. (3) (Eich-ler et al., 2008).
feff=
X
i
εi·fg3,i !1/3
=
Vwater+Vdry
Vdry
1/3
=
mwet
mdry·
ρdry
ρwet
1/3 (3)
ρ= X
i
mi !,
X
i
miρi !
(4) In Eq. (3),feffis the EGF.εiis the volume fraction of thei-th
component in aerosol, whilefg,i is the hygroscopic growth
factor.VwaterandVdryis the volume of water uptake and dry particle, respectively. The dry aerosol density,ρdry, in Eq. (3) can be calculated with Eq. (4) whereρi is the density of the
i-th chemical component (excluding water) andmi is mass
concentration.
Parameters for calculating the EORI and the EGF are sum-marised in Table 2, which were learned from previous stud-ies (Tang, 1996; Chazette and Louisse, 2001; Sloane, 1986; Haynes, 2011; Seinfeld and Pandis, 2006; Eichler et al., 2008).ni andki in the table are referenced to light
wave-length of 550 nm.
According to the Mie Model,bsp(light scattering coeffi-cient) andbep(light extinction coefficient) can be quantified with Eqs. (5) and (6) (Bohren and Huffman, 1998; Seinfeld and Pandis, 2006), respectively.bap(light absorption coeffi-cient) is the difference betweenbepandbsp. Optical proper-ties includingbep,bsp andbap to be discussed later are all referenced to light wavelength of 550 nm.
bsp= X
j
bsp,j=
X
j
π D2j
4 ·Qsp,j Dj, λ,EORIj
·Nj (5)
bep= X
j
bep,j=
X
j
π Dj2
4 ·Qep,j Dj, λ,EORIj
·Nj (6)
In Eqs. (5) and (6),Dj stands for the midpoint Stokes
Diam-eter in thej-th particle size range, whileNj is the number
concentration of particles with diameterDj.Qsp,jrepresents
light scattering efficiency of a single particle with diameter Dj, whileQep,jrepresents light absorption efficiency.
Theo-retically,Qsp,jandQep,jare both the function ofDjand the
’
’
the prevailing regime was “Sulfate Poor, Crustal &
Sodium Poor” in April and January nd “Sulfate rich” in October.
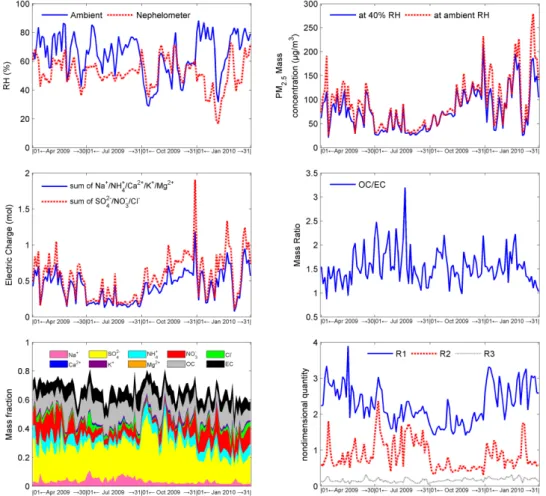
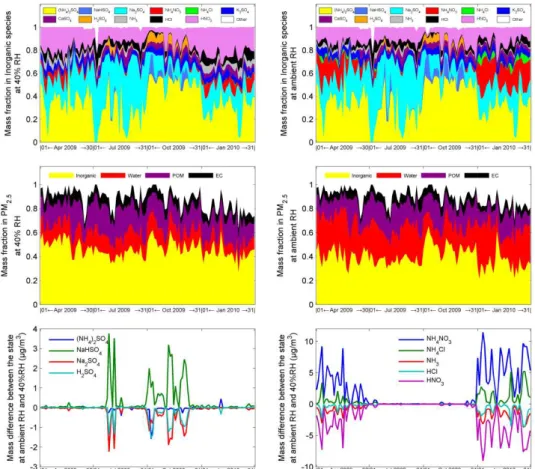
Fig. 2.Temporal variations of RH, PM2.5mass, molarity of electric charge, ratio of OC to EC, components’ mass fraction and characteristic values (R1,R2,R3).
light wavelengthλ(say 550 nm), for which the complicated calculations were referenced to a previous publication (Sein-feld and Pandis, 2006). Regarding the limitation of measure-ment techniques, the EORIj was assumed to be equal to the
EORIpm2.5 which was determined based on chemical com-position of PM2.5.
TheDj required by the Mie Model was converted from
Da,j of APS size bin with Eq. (7), while the corresponding
Nj was derived from APS. Moreover, feff,j in Eq. (7)
rep-resented the hygroscopicity ofDj under an assumption that
no change in particles number through the process of hygro-scopic growth (Eichler et al., 2008). Sharing the similarity of EORIj,feff,j was assumed to be equal to the feff,pm2.5.
Dj=
Da,j
√ρ dry ·
feff,j. (7)
4 Result and discussion
4.1 Chemical composition of PM2.5
As illustrated in Fig. 2, mass concentration of PM2.5 at 40 % RH ranged from 21.0 to 213.6 µg m−3 during the four months, and the average of 76.0, 38.6, 89.3 and 103.3 µg m−3 were recorded in April, July, October and January, respec-tively. Figure 2 also shows a coherent temporal variation be-tween the sum of the anions and that of the cations, with the former being sufficient to neutralise the latter. Regarding the content of components in PM2.5, inorganic ions accounted
for 33–57 % of total mass; OC was 12–14 %, while EC was about 8 %. The mass ratio of OC to EC ranged from 0.9 to 3.2 and had an average of 1.5 during the four months.
he EORI, EGF and ρ
and ρ
m
Fig. 3.Temporal variations of chemical composition of PM2.5at 40 % RH and ambient RH.
Table 3 notes that the prevailing regime was “Sulfate Poor, Crustal & Sodium Poor” in April and January, while “Sul-fate rich” in October. These two regimes accounted for about 32 % and 65 % of total samples in July, respectively. During October, a drier climate with strong solar radiation in South China probably accelerated the oxidation process of SO2to become SO24−, hence the content of sulfate in ambient atmo-sphere was getting richer.
According to the methodology mentioned earlier, chemi-cal composition of PM2.5was reconstructed, whose tempo-ral variations are illustrated in Fig. 3. It should be noted that an empirical OC/POM conversion probably leads to an over-estimation of POM besides the errors in measurements and water content calculation. As a result, mass of the Residual in 10 of the 123 samples were calculated to small negatives. To avoid this matter affecting further calculation in the Mie Model, these negative values were assigned to zero. As il-lustrated in Fig. 3, of the total mass, inorganic species, wa-ter, POM, EC and the Residual accounted for 42–51 %, 10– 15 %, 17–23 %, 8–9 % and 10–22 %, respectively. Moreover, (NH4)2SO4, Na2SO4, K2SO4and HNO3are the major inor-ganic species during the four months. In October, the content of NH4HSO4and H2SO4rose for a sulfate rich atmosphere.
NH4NO3usually appeared in April and January when there was not enough HSO−4 or SO24−to neutralise the NH+4.
As mentioned above, PM2.5mass at ambient RH was de-termined according to its mass at 40 % RH. With regard to the content at 40 % RH, water uptake varied significantly with ambient RH. Compound forms of inorganic species changed as well. As illustrated in Fig. 3, NaHSO4, Na2SO4 and H2SO4often had significant variations during July and October when sulfate was rich. In April and January, more NH+4, Cl− and NO−
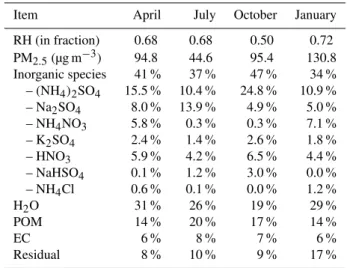
3 dissociated from dissolved NH3, HCl and HNO3, hence, NH4NO3 and NH4Cl increased their amounts. At ambient RH condition, mass concentration of PM2.5ranged from 26.1 to 279.1 µg m−3and had an average of 94.8, 44.6, 95.4 and 130.8 µg m−3in April, July, October and January, respectively. With regard to the composition, in-organic species, water, POM, EC and the Residual accounted for 34–47 %, 19–31 %, 14–20 %, 6–8 % and 8–17 % of total mass, respectively.
4.2 Optical properties of PM0.5−20
Table 3.Quantities of PM2.5samples which were categorised to the five chemical composition regimes.
Condition Regime Apr-09 Jul-09 Oct-09 Jan-10
R1<1 Sulfate Rich (free acid) 0 0 0 0
1≤R1<2 Sulfate Rich 3 10 27 1
R1≥2,R2<2 Sulfate Poor, Crustal & Sodium Poor 27 20 4 30
R1≥2,R2≥2,R3≤2 Sulfate Poor, Crustal & Sodium Rich, Crustal Poor 0 1 0 0
R1≥2,R2≥2,R3>2 Sulfate Poor, Crustal & Sodium Rich, Crustal Rich 0 0 0 0
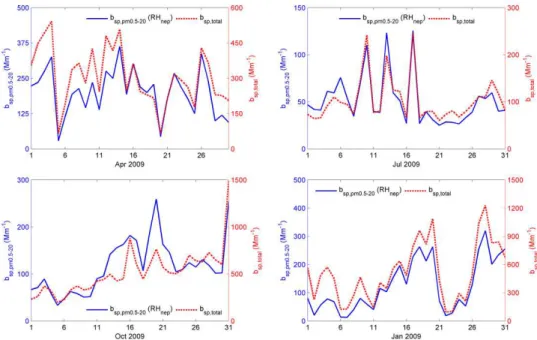
and ρ
Fig. 4.Temporal variations of particles number and optical properties.
three key parameters and particles number size distribu-tion of PM0.5−20 from APS,bep, bsp andbap of PM0.5−20 were calculated following the methodology mentioned ear-lier. At ambient RH condition, the EORIpm2.5 had an av-erage of 1.462–0.037i, while EGFpm2.5andρdry was 1.487 and 1.848 g cm−3, respectively. Subsequently, size distribu-tions of optical properties of PM0.5−20were plotted in Fig. 4 where peak values of particles number and optical properties were almost located in the diameter range between 0.5 and 1.0 µm. Since the volatilisation loss of semi-volatile species was not investigated in present study, the calculatedbep of PM0.5−20was probably underestimated when the volatilisa-tion effect was important. Moreover, as organic species have
not been considered by the ISORROPIA II, the content of water uptake was slightly underestimated and, therefore,bep of PM0.5−20was probably underestimated.
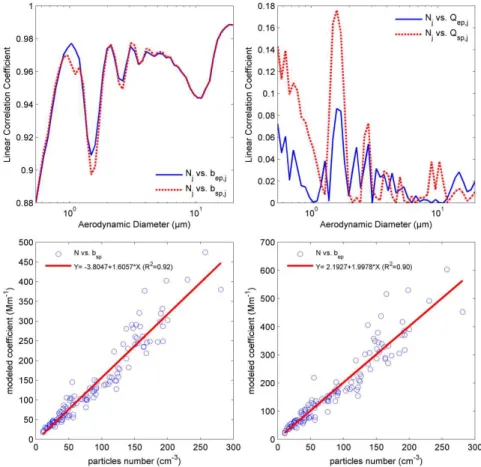
4.2.1 Impact of particles number size distribution
In Fig. 5, temporal variation comparison between bsp,pm0.5−20 and bsp,total (bsp,total was measured by Neph-elometer) was made in consideration of the former one being subset of the latter. It should be noted that the EORIpm2.5,
Fig. 5.Comparison between variations of estimation and measurement.
respectively. Figure 5 indicates a coherent temporal variation trend between the two data sets in April, July and January as correlation coefficient was 0.88, 0.92 and 0.94, respectively. A weaker correlation existed in October with a coefficient of 0.79. One will speculate that the practical method of calculating bsp,pm0.5−20 in this paper can conditionally predict the variation trend ofbsp,total.
In Fig. 6,Nj of PM0.5−20 showed its strong linear corre-lations withbsp,j andbep,j of PM0.5−20at ambient RH con-dition. On the contrary,Qsp,j andQep,jhad poor linear
cor-relation withbsp,jandbep,j, respectively, which were
deter-mined based on the assumptions of EORIj being equaled to
the EORIpm2.5and thefeff,j being equaled to thefeff,pm2.5.
Furthermore, Fig. 6 illustrates thatNpm0.5−20had strong lin-ear correlation withbsp,pm0.5−20andbep,pm0.5−20as correla-tion coefficient was 0.92 and 0.90, respectively. In this re-gard, it can be inferred that those assumptions influenced bsp,pm0.5−20 and bep,pm0.5−20 much less significantly than Npm0.5−20did, hence the practical method introduced in cur-rent study is capable of estimating variation trend of opti-cal property of PM0.5−20with good accuracy, as long as the data of particles number size distribution is available and val-idated. Accordingly, a possible reason for the weaker correla-tion betweenbsp,pm0.5−20andbsp,totalin October is that there were many even smaller particles in ambient atmosphere and APS could not distinguish them enough to produce a bet-ter particles number size distribution for the estimation. This speculation will be further investigated if a combination of SMPS-APS is introduced in future study.
4.2.2 Impact of relative humidity
In order to investigate the hygroscopicity of the optical prop-erties of PM0.5−20,fg=g(RH)/g(RH0)is used to represent the hygroscopic growth factor, where g(RH) stands for an optical property at a specific RH condition (denoted in frac-tion) and RH0is valued to 0.2 representing the dry state. In the light of a previous paper (Cheng et al., 2008b), a function as Eq. (8) best fitted the RH dependence curve offg.
fg(RH)=
1−RH 1−RH0
−a·RH
(8)
R2of the curve fittings of all samples were 0.99 on average. Temporal variations of coefficient “a” are plotted in Fig. 7, and judged by which, bsp,pm0.5−20 grew more rapidly than bap,pm0.5−20did as RH increased. Correlation coefficient be-tween “a” ofbep,pm0.5−20andγion(mass fraction of ions in PM2.5)being 0.86 indicates that different content of ions ac-counted for the variation of coefficient “a”. Along with an increasing RH,bep,pm0.5−20grew and favoured a more rapid growth when aerosol had a high content of inorganic water-soluble salts.
and the APS couldn’t distinguish them
Fig. 6.Linear regressions between particles number and optical properties of PM0.5−20.
Table 4.Potential uncertainties of the model estimation.
Property Uncertainty
RH recorded by auto weather stationa 3.87 %
Njmeasured by APSb 3.30 %
Da,jfrom APSb 3.00 %
ion & OC/EC analysisc 2.49 % PM2.5sample weighingc 1.08 % Real part of the ORI of the ECb 3.00 % Imaginary part of the ORI of the ECb 5.00 %
Total 8.73 %
aFrom instrument technical manual,
bnoted in a previous paper (Cheng et al., 2008c), cestimated based on instrument detection limit.
4.2.3 Uncertainties in model estimation
Uncertainties of the model estimation discussed above are listed in Table 4, the potential sources of which includes instrumental measurement (analysis) and parameters cho-sen for the model. The total uncertainty was determined by Eq. (9) which was recommended by IPCC (Intergovernmen-tal Panel on Climate Change). In Eq. (9) below,Utotal is the total uncertainty whileUiis thei-th subset of uncertainties.
Utotal= X
i
Ui2
!1/2
(9)
5 Summary and conclusion
In the urban area of Guangzhou, mass concentration of PM2.5 was at its lowest level being 44.6 µg m−3in July 2009, higher in April 2009 and October 2009, and reached the highest level being 130.8 µg m−3 in January 2010. The content of SO24− rose in October while was low in January. The con-tent of water uptake dropped in October for a drier climate. Moreover, NO−3 increased its content in April and January, while POM and EC had high content in July and October.
Z. J. Lin et al.: Aerosol light extinction in the urban area of Guangzhou 1125
“a” by coefficient “a”,
between “a” and γ
“a”
“a” and
Fig. 7.Temporal variations of coefficient “a” and the RH dependence curves of optical properties of PM0.5−20.
Table 5.Ambient RH condition and the corresponding chemical composition of PM2.5.
Item April July October January
RH (in fraction) 0.68 0.68 0.50 0.72 PM2.5(µg m−3) 94.8 44.6 95.4 130.8 Inorganic species 41 % 37 % 47 % 34 % – (NH4)2SO4 15.5 % 10.4 % 24.8 % 10.9 % – Na2SO4 8.0 % 13.9 % 4.9 % 5.0 % – NH4NO3 5.8 % 0.3 % 0.3 % 7.1 % – K2SO4 2.4 % 1.4 % 2.6 % 1.8 % – HNO3 5.9 % 4.2 % 6.5 % 4.4 % – NaHSO4 0.1 % 1.2 % 3.0 % 0.0 % – NH4Cl 0.6 % 0.1 % 0.0 % 1.2 % H2O 31 % 26 % 19 % 29 % POM 14 % 20 % 17 % 14 %
EC 6 % 8 % 7 % 6 %
Residual 8 % 10 % 9 % 17 %
Under the assumption of “internal mixture”, optical prop-erties of PM0.5−20were estimated with good accuracy by the Mie Model. The EORI, EGF andρdrywere determined with an understanding of chemical composition of PM2.5; and
par-ticles number size distribution of PM0.5−20was derived from APS. The monthly averages of them are summarised in Ta-ble 6.
Table 6.Ambient RH condition and the corresponding optical prop-erties of PM0.5−20.
Item April July October January
RH (in fraction) 0.68 0.68 0.50 0.72
neff 1.446 1.455 1.483 1.461
keff 0.034 0.041 0.040 0.032
feff 1.470 1.546 1.372 1.561
ρdry (g cm−3) 1.78 1.93 1.87 1.80
N(particles cm−3) 147.8 35.7 83.9 85.7
bep(Mm−1) 300.0 78.6 146.9 188.5
bsp(Mm−1) 236.4 57.4 113.2 144.8
bap(Mm−1) 63.7 21.3 33.7 43.7
fep 1.29 1.23 1.14 1.26
fsp 1.37 1.29 1.18 1.33
fap 1.07 1.10 1.04 1.05
ωa 0.78 0.72 0.76 0.78
ϕb 0.66 0.49 0.23 0.23
aωis ratio ofb
sp,pm0.5−20tobep,pm0.5−20. bϕis ratio ofb
sp,pm0.5−20tobsp,total.
properties of PM0.5−20largely depended on RH. As RH in-creased,bep,pm0.5−20grew and favoured a more rapid growth when aerosol had a high content of inorganic water-soluble salts. Averagely,fbep,pm0.5−20enlarged 1.76 times when RH increased from 20 % to 90 %. With regard to the temporal variation of ambient RH,fbep,pm0.5−20was 1.29, 1.23, 1.14 and 1.26 on average in April, July, October and January, re-spectively.. Together with the measurement techniques and numerical models adopted currently, the SMPS-APS combi-nation and the PM1.0/PM2.5/PM10sampling will be deployed
in near study for a further investigation on the impact of RH and particles number size distribution on estimating aerosol optical properties.
Acknowledgements. This work is supported by Commonwealth
and Environmental Protection Project of the Ministry of Environ-mental Protection of the People’s Republic of China (200809143); China National Basic Research and Development Program (2002CB410801 and 2011CB403403) and National Natural Science Foundation (41275017).
Edited by: S. C. Liu
References
Anderson, T. L. and Ogren, J. A.: Determining Aerosol Radia-tive Properties Using the TSI 3563 Integrating Nephelometer, Aerosol Sci. Tech., 29, 57–69, 1998.
Andreae, M. O., Schmid, O., Yang, H., Chand, D., Yu, J. Z., Zeng, L. M., and Zhang, Y. H.: Optical properties and chemical com-position of the atmospheric aerosol in urban Guangzhou, China, Atmos. Environ., 42, 6335–6350, 2008.
Bergin, M., Hagler, G., Salmon, L., Zheng, M., Chameides, W., Kiang, C. S., Schauer, J., and Yu, J.: Fine particulate Matter PM2.5 in the Pearl River Delta. Project 2 Scientific Report to the Hong Kong Civic Exchange, 2004.
Bohren, C. F. and Huffman, D. R.: Absorption and scattering of light by small particles, John Wiley & Sons, Inc., 1998. Bond, T. C. and Bergstrom, R. W.: Light absorption by
carbona-ceous particles: an investigative review. Aerosol Sci. Tech., 40, 27–67, 2006.
Bougiatioti, A., Fountoukis, C., Kalivitis, N., Pandis, S. N., Nenes, A., and Mihalopoulos, N.: Cloud condensation nuclei measure-ments in the marine boundary layer of the Eastern Mediter-ranean: CCN closure and droplet growth kinetics, Atmos. Chem. Phys., 9, 7053–7066, doi:10.5194/acp-9-7053-2009, 2009. Cao, J. J., Lee, S. C., Chow, J. C., Watson, J. G., Ho, K. F., Zhang, R.
J., Jin, Z. D., Shen, Z. X., Chen, G. C., Kang, Y. M., Zou, S. C., Zhang, L. Z., Qi, S. H., Dai, M. H., Cheng, Y., and Hu, K.: Spatial and seasonal distributions of carbonaceous aerosols over China, J. Geophys. Res., 112, D22S11, doi:10.1029/2006JD008205, 2007.
Chazette, P. and Liousse, C.: A case study of optical and chem-ical ground apportionment for urban aerosols in Thessaloniki, Atmos. Environ., 35, 2497–2506, 2001.
Cheng, Y. F., Eichler, H., Wiedensohler, A., Heintzenberg, J., Zhang, Y. H., Hu, M., Herrmann, H., Zeng, L. M., Liu, S.,
Gnauk, T., Bruggemann, E., and He, L. Y.: Mixing state of elemental carbon and non-light-absorbing aerosol components derived from in situ particle optical properties at Xinken in Pearl River Delta of China, J. Geophys. Res., 111, D20204, doi:10.1029/2005JD006929, 2006.
Cheng, Y. F., Wiedensohler, A., Eichler, H., Su, H., Gnauk, T., Br¨uggemann, E., Herrmann, H., Heintzenberg, J., Slanina, J., Tuch, T., Hu, M., and Zhang, Y. H.: Aerosol optical properties and related chemical apportionment at Xinken in Pearl River Delta of China, Atmos. Environ., 42, 6351–6372, 2008a. Cheng, Y. F., Wiedensohler, A., Eichler, H., Heintzenberg, J.,
Tesche, M., Ansmann, A., Wendisch, M., Su, H., Althausen, D., Herrmann, H., Gnauk, T., Bruggemann, E., Hu, M., and Zhang, Y. H.: Relative humidity dependence of aerosol optical proper-ties and direct radiative forcing in the surface boundary layer at Xinken in Pearl River Delta of China: An observation based nu-merical study, Atmos. Environ., 42, 6373–6397, 2008b. Cheng, Y. F., Zhang, Y. H., Hu, M., and Wiedensohler, A.:
An observation-based method for investigating the atmospheric aerosol radiative properties in pearl river delta of China, http: //www.sciencep.com, China, 2008c.
Chow, J. C., Watson, J. G., Chen, L. W., Chang, M. C., Robinson, N. F., Trimble, D., and Kohl, S.: The IMPROVE A temperature protocol for thermal/optical carbon analysis: maintaining con-sistency with a long-term database, J. Air Waste Manage., 57, 1014–1023, 2007.
Deng, X. J., Tie, X. X., Zhou, X. J., Wu, D., Zhong, L. J., Tan, H. B., Li, F., Huang, X. Y., Bi, X. Y., and Deng, T.: Effects of Southeast Asia biomass burning on aerosols and ozone concentrations over the Pearl River Delta (PRD) region, Atmos. Environ., 42, 8493– 8501, 2008a.
Deng, X. J., Tie, X. X., Wu, D., Zhou, X. J., Bi, X. Y., Tan, H. B., Li, F., and Jiang, C. L.: Long-term trend of visibility and its characterizations in the Pearl River Delta (PRD) region, China, Atmos. Environ., 42, 1424–1435, 2008b.
Eichler, H., Cheng, Y. F., Birmili, W., Nowak, A., Wiedensohler, A., Br¨uggemann, E., Guauk, T., Herrmann, H., Althausen, D., Ansmann, A., Engelmann, R., Tesche, M., Wendisch, M., Zhang, Y. H., Hu, M., Liu, S., and Zeng, L. M.: Hygroscopic properties and extinction of aerosol particles at ambient relative humidity in South-Eastern China, Atmos. Environ., 42, 6321–6334, 2008. Engelhart, G. J., Hildebrandt, L., Kostenidou, E., Mihalopoulos,
N., Donahue, N. M., and Pandis, S. N.: Water content of aged aerosol, Atmos. Chem. Phys., 11, 911–920, doi:10.5194/acp-11-911-2011, 2011.
Fan, S. J., Wang, B. M., Teshce, M., Engelmann, R., Althausen, A., Liu, J., Zhu, W., Fan, Q., Li, M. H., Ta, N., Song, L. L., and Leong, K. L.: Meteorological conditions and structures of atmo-spheric boundary layer in October 2004 over Pearl River Delta area, Atmos. Environ., 42, 6174–6186, 2008.
Fan, S. J., Fan, Q., Yu, W., Luo, X. Y., Wang, B. M., Song, L. L., and Leong, K. L.: Atmospheric boundary layer characteristics over the Pearl River Delta, China, during the summer of 2006: measurement and model results, Atmos. Chem. Phys., 11, 6297– 6310, doi:10.5194/acp-11-6297-2011, 2011.
2007.
Guauk, T., Muller, K., Pinxteren, D., He, L. Y., Niu, Y., Hu, M., and Herrmann, H.: Size-segregated particulate chemical compo-sition in XinKen, Pearl River Delta, China: OC/EC and organic compounds, Atmos. Environ., 42, 6296–6309, 2008.
Gysel, M., Weingartner, E., Nyeki, S., Paulsen, D., Baltensperger, U., Galambos, I., and Kiss, G.: Hygroscopic properties of water-soluble matter and humic-like organics in atmospheric fine aerosol, Atmos. Chem. Phys., 4, 35–50, doi:10.5194/acp-4-35-2004, 2004.
Gysel, M., Crosier, J., Topping, D. O., Whitehead, J. D., Bower, K. N., Cubison, M. J., Williams, P. I., Flynn, M. J., McFiggans, G. B., and Coe, H.: Closure study between chemical composition and hygroscopic growth of aerosol particles during TORCH2, Atmos. Chem. Phys., 7, 6131–6144, doi:10.5194/acp-7-6131-2007, 2007.
Haynes, W. M. (Ed.): CRC Handbook of Chemistry and Physics 92ndEdition, CRC Press, 2011.
Jacobson, M. Z.: Strong radiative heating due to the mixing state of black carbon in atmospheric aerosol, Nature, 409, 695–697, 2001.
Jung, J. S., Lee, H., Kim, Y. J., Liu, X. G., Zhang, Y. H., Gu, J. W., and Fan, S. J.: Aerosol chemistry and the effect of aerosol water content on visibility impairment and radiative forcing in Guangzhou during the 2006 Pearl River Delta campaign, J. Env-iron. Manage., 90, 3231–3244, 2009.
Lesins, G., Chylek, P., and Lohman, U.: A study of internal and external mixing scenarios and its effect on aerosol optical prop-erties and direct radiative forcing, J. Geophys. Res., 107, 4094, doi:10.1029/2001JD000973, 2002.
Liu, S., Hu, M., Slanina, S., He, L. Y., Niu, Y. W., Bruegemann, E., Gnauk, T., and Herrmann, H.: Size distribution and source analysis of ionic compositions of aerosols in polluted periods at Xinken in Pearl River Delta (PRD) of China, Atmos. Environ., 42, 6284–6295, 2008a.
Liu, X. G., Cheng, Y. F., Zhang, Y. H., Jung, J., Sugimoto, N., Chang, S. Y., Kim, Y. J., Fan, S. J., and Zeng, L. M.: Influences of relative humidity and particle chemical composition on aerosol scattering properties during the 2006 PRD campaign, Atmos. En-viron., 42, 1525–1536, 2008b.
Liu, X. G., Zhang, Y. H., Wen, M. T., Wang, J. L., Jung, J. S., Chang, S. Y., Hu, M., Zeng, L. M., and Kim, Y. J.: A Closure Study of Aerosol Hygroscopic Growth Factor during the PRD 2006 Cam-paign, Adv. Atmos. Sci., 27, 947–956, doi:10.1007/s00376-009-9150-z, 2010.
Louie, P. K. K., Waston, J. G., and Chow, J. C.: Seasonal charac-teristics and regional transport of PM2.5in Hong Kong, Atmos. Environ., 39, 1695–1710, 2005.
Seinfeld, J. H. and Pandis, S. N.: Atmospheric Chemistry and Physics: from air pollution to climate change (Second Edition), John Wiley & Sons Inc., New York, 2006.
Shen, Z. X., Arimoto, R., Cao, J. J., Zhang, R. J., Li, X. X., Du, N., Tomoaki, O., Shunsuke, N., and Shigeru, T.: Seasonal variations and evidence for the effectiveness of pollution controls on water-soluble inorganic species in total suspended particulates and fine particulate matter from Xi’an, China, J. Air Waste Manage., 58, 1560–1570, 2008.
Shen, Z. X., Cao, J. J., Arimoto, R., Han, Z. W., Zhang, R. J., Han, Y. M., Liu, S. X., Okuda, T., Nakao, S., and Tanaka, S.: Ionic
composition of TSP and PM2.5during dust storms and air pollu-tion episodes at Xi’an, China, Atmos. Environ., 43, 2911–2918, 2009.
Sloane, C. S.: Effect of composition on aerosol light scattering effi-ciencies, Atmos. Environ., 20, 1025–1037, 1986.
Stock, M., Cheng, Y. F., Birmili, W., Massling, A., Wehner, B., M¨uller, T., Leinert, S., Kalivitis, N., Mihalopoulos, N., and Wiedensohler, A.: Hygroscopic properties of atmospheric aerosol particles over the Eastern Mediterranean: implications for regional direct radiative forcing under clean and polluted con-ditions, Atmos. Chem. Phys., 11, 4251–4271, doi:10.5194/acp-11-4251-2011, 2011.
Su, H., Cheng, Y. F., Cheng, P., Zhang, Y. H., Dong, S. F., Zeng, L. M., Wang, X. S., Slanina, J., Shao, M., and Wiedensohler, A.: Observation of nighttime nitrous acid (HONO) formation at a non-urban site during PRIDE-PRD2004 in China, Atmos. Envi-ron., 42, 6219–6232, 2008.
Tang, I. N.: Chemical and size effects of hygroscopic aerosols on light scattering coefficients, J. Geophys. Res., 101, 19245– 19250, doi:10.1029/96JD03003, 1996.
Tao, J., Ho, K. F., Chen, L. G., Zhu, L. H., Han, J. L., and Xu, Z. C.: Effect of chemical composition of PM2.5on visibility in Guangzhou, China, 2007 spring, Particuology, 7, 68–75, 2009. Tie, X. X. and Cao, J. J.: Aerosol pollution in China: Present and
future impact on environment, Particuology, 7, 426–431, 2009. Wang, G., Li, J., Cheng, C., Hu, S., Xie, M., Gao, S., Zhou, B., Dai,
W., Cao, J., and An, Z.: Observation of atmospheric aerosols at Mt. Hua and Mt. Tai in central and east China during spring 2009 – Part 1: EC, OC and inorganic ions, Atmos. Chem. Phys., 11, 4221–4235, doi:10.5194/acp-11-4221-2011, 2011.
Wang, T., Poon, C. N., Kwok, Y. H., and Li, Y. S.: Characteriz-ing the temporal variability and emission patterns of pollution plumes in the Pearl River Delta of China, Atmos. Environ., 37, 3539–3550, 2003.
Wexler, A. S. and Clegg, S. L. Atmospheric aerosol mod-els for systems including the ions H+, NH+4, Na+, SO24−, NO3-, Cl−, Br− and H2O, J. Geophys. Res., 107, 4207, doi:10.1029/2001JD000451, 2002.
Wu, D., Tie, X. X., Li, C. C., Ying, Z. M., Lau, A., Huang, J., Deng, X. J., and Bi, X. Y.: An extremely low visibility event over the Guangzhou region: a case study, Atmos. Environ., 39, 6568–6577, 2005.
Xiao, R., Takegawa, N., Zheng, M., Kondo, Y., Miyazaki, Y., Miyakawa, T., Hu, M., Shao, M., Zeng, L., Gong, Y., Lu, K., Deng, Z., Zhao, Y., and Zhang, Y. H.: Characterization and source apportionment of submicron aerosol with aerosol mass spectrometer during the PRIDE-PRD 2006 campaign, Atmos. Chem. Phys., 11, 6911–6929, doi:10.5194/acp-11-6911-2011, 2011.
Yu, H., Wu, C., Wu, D., and Yu, J. Z.: Size distributions of elemental carbon and its contribution to light extinction in urban and rural locations in the pearl river delta region, China, Atmos. Chem. Phys., 10, 5107–5119, doi:10.5194/acp-10-5107-2010, 2010. Yue, D. L., Hu, M., Wu, Z. J., Guo, S., Wen, M. T., Nowak, A.,
9431–9439, doi:10.5194/acp-10-9431-2010, 2010.
Zhang, Y. H., Hu, M., Zhong, L. J., Wiedensohler, A., Liu, S. C., Andreas, M. O., Wang, W., and Fan, S. J.: Regional integrated experiments on air quality over Pearl River Delta 2004 (PRIDE-PRD2004): overview, Atmos. Environ., 42, 6157–6173, 2008a.