1
RESEARCH OF NEURONAL MORPHOLOGY’S CLASSIFICATION AND
RECOGNITION
Sun Tao, Lin liang & Huang qiaoyu
College of Science, Guilin University of Technology China, Guilin, China
ABSTRACT
By comparing cluster analysis, BP neural network, This paper establishes a classification model based on fuzzy
clustering identification, and has obtained good classification results; analyzes the same neurons’ different
characteristics in different animals, obtaining aggregates of neurons can better classify neurons, but can not distinguish the different morphological characteristics in different animals, The use of the component indicators of neurons can distinguish them clearly.
Keywords: Classification of neurons; Cluster Analysis; Neural network; Fuzzy Clustering.
1. INTRODUCTION
How to identify and distinguish different types’ neurons accurately is of great significance to Human Brain Project
(HBP), at present, the science still have not solved this issue. Vivisection distinguishing neurons is mainly through geometric shape and potential distribution these two factors. The use of neurons’ potential distribution pattern is
more complex, is mainly related to neuron’ Hodgkin-Huxley model and the discrete form of rall cable model. This paper studies how to use geometric features of neurons, by mathematical modeling, gives a space shape’s classification of neurons, and classifies neurons accurately.
1.1. Data source
Neuronmorpho.org [1] contains a large number of geometric shape data of neurons, Here, we select two sets of data,
A set of data is the control group, has 43 different types’ neurons(Grouped); B set of data is feature group, including
Motor neurons, purk neurons, pyramidal neurons, intermediate neurons, sensory neurons, seven of five kind neurons which is Known of classification,( intermediate neurons can be divided into three categories: Bipolar, tripolar, multipolar Intermediate neurons).
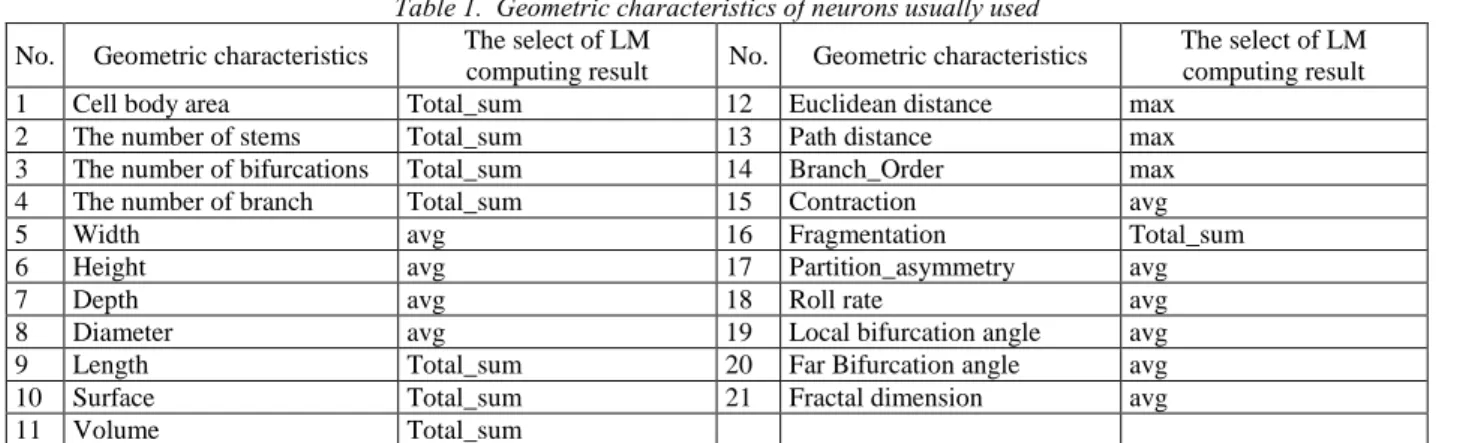
In order to classify more precisely, using LM [2] to calculate 21 geometry value of the 50 neurons samples in A, B.
Table 1. Geometric characteristics of neurons usually used
No. Geometric characteristics The select of LM
computing result No. Geometric characteristics
The select of LM computing result 1 Cell body area Total_sum 12 Euclidean distance max
2 The number of stems Total_sum 13 Path distance max 3 The number of bifurcations Total_sum 14 Branch_Order max 4 The number of branch Total_sum 15 Contraction avg
5 Width avg 16 Fragmentation Total_sum
6 Height avg 17 Partition_asymmetry avg
7 Depth avg 18 Roll rate avg
8 Diameter avg 19 Local bifurcation angle avg
9 Length Total_sum 20 Far Bifurcation angle avg
10 Surface Total_sum 21 Fractal dimension avg
11 Volume Total_sum
Notes: English name and Interpretation is consistent with it used in L-Measure software, The select of LM computing result refers to the document of LMeasure_contest_help.doc, Uncharted characteristic index computing results Choose the average value.
2. THE CLASSIFICATION OF NEURONS
Using Neurons geometric data in A and B, Find out the geometric characteristics of five kinds of neurons in B, give a methods of morphological classification of neurons.
2.1. Cluster Analysis
Known by the principal component analysis, the first four eigenvalue in 21 Characteristics indicators is greater than
2
1, together they explain 95.594% of the total variance, although the fifth explain 3.039% of the total variance, but its characteristic value is 0.649 and less than 1. This shows that the explanatory power of principal components is not more than the average explanatory power of directly introducing of the original variables. Therefore, only need to extract the first four principal components. Use these four principal components to replace the original 21 variables and to do clustering and classification identification.
Observing the initial factor loading matrix, we can know cell surface area, the number of the stems, width, height, depth, diameter, length, surface area, volume, Euclidean distance, path distance, Roll rate and Fractal dimension in the first principal component F1 has a very high load, this indicates F1 basically reflects geometric contour
information of neurons space shape. Number of bifurcations Branching number Roll rate and fractal dimension in the second principal component F2 has a very high load, this indicates F2 basically reflects bifurcation and the
branch information of neurons space shape. Contraction, proximal bifurcation angle and remote bifurcation angle in the third principal component F3 has a very high load, this indicates F3 basically reflects flexibility and scalability of
neurons space shape. Asymmetric division in the fourth principal component F4 has a very high load, this indicates
F4 basically reflects symmetry of neurons space shape.
The Variable coefficient vector of the i (“i” represent for first, second, third, fourth, fifth) principal components Fi is
obtained by the i column vector of the initial factor loading matrix dividing the square root of the i characteristic root, That is :
1 1 2 21
2 1 2 21
3 1 2 21
4 1 2 21
0.286538 0.278449 0.254683575
0.029575 0.002247 0.09569
0.059618 0.039195 0.256065
0.09962 0.216156 0.093193
F ZX ZX ZX
F ZX ZX ZX
F ZX ZX ZX
F ZX ZX ZX
Substitute Fi into comprehensive evaluation function
1
( / )
m
Z i i
i
F k F
, here k=21, thus:1 2 3 4
0.558544 0.202454 0.125172 0.069768 Z
F F F F F
Calculating the score of each principal component and also referencing to the control group data to divide the sample into five intervals, We obtained the correct rate of 90.4%. While dividing into seven intervals, the correct rate is 67.7% only, Misjudgment rate is high, we will try other methods.
2.2. BP Neural Network
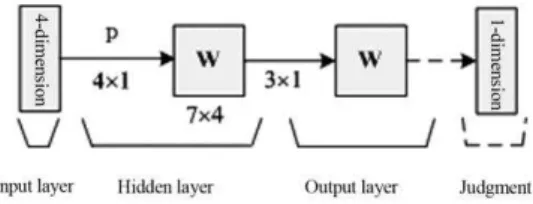
BP neural network is one of the most widely used and the most successful network[3], can be a good solution to the complex causal relationship and non-deterministic reasoning, judging, identification and classification Problem. Based on previous principal component analysis, We have 21 indicator variables down into four, Therefore, in the design of BP neural network [4] , the number of the input layer elements is 4, that is Nin=4;Since we have five
classes of neurons, Therefore, the number of the output layer elements is 3, that is Nout=3, This can Characterize 8
kind of neurons, and includes unknown neurons In addition to 5 kinds. in order to ensure the accuracy and convergence rate of the Network training, We will set the network training error of 1×10⁻⁵.
Fig. 1: Neural network computing flow chart
The calculation shows that, Using the 21 neural network indicators, the accuracy rate of Clustering Class 7 is 69.17% ; in the 21 neural network indicators, the accuracy rate of Clustering Class 5 is 95.45% ; Because the study sample is relatively few, only seven, so the deviation of the results is also evident.
2.3. Fuzzy Clustering
3
Fuzzy Mathematics is an important tool for studying uncertain phenomena, for neuron classification problem, Fuzzy Mathematics [5] theory, can also be used to modeling and solving. The main point is to establish fuzzy similar matrix Rij=(rij)51×21, and then use transitive closure to do cluster analysis, and can draw dynamic clustering diagram.
In the 21 indicators, the deviation of clustering recognition is also obvious, the accuracy rate is 33/51=65% under 70%, This shows that we only use 21 indicators data, the deviation of clustering recognition is inevitable. So we re-process the data, establish 43 effective indicators, After several trials of different data, we Obtain recognition method using fuzzy clustering, the deviation of recognition achieves minimum, results are as followings:
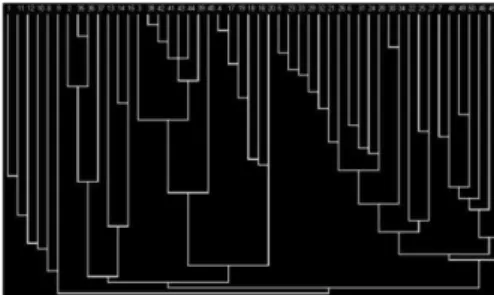
Result one: when range transformation λ=0.4619, the correct rate of clustering 5 classes was 96.1%, but further divided into 7 classes, the correct rate is only 76.5%, shown as figure 2.
Fig. 2: Range transformation clustering diagram
Result two: the 45 set of data, Known as divided into motor neurons and purk neurons, When λ=0.4349, Classification accuracy rate is 99.2%, shown as figure 3.
Fig. 3: Standard deviation transform clustering diagram
Thus, we verified, Fuzzy clustering recognition method, In neurons classification problems, Indeed has advantages
;Through the known types of neurons, distinguish similar types of neurons. Calculation program is as follows:
step one: Data Standardization.
Apply shift standard deviation transformation and shift range transformation to standardize data Step two: Calibration(establish fuzzy similar matrix).
Apply exponent similarity coefficient method
2 2 11 3
exp 4
i
ki jk ij
k k
x x
r
m s
And,
1
2
1 i
i k
k k ik
s x x
n
Establish fuzzy similar matrix Rij=(rij)51×21
Step three: Use the method of transitive closure to do cluster analysis.
4 2 ( ) 1 2 ( ) ( ) 1 1 ( 1) ( ) j j r k j j j j n r i k i i x x n r F x x n r
And ( ) ) 1 ( 1( 1, 2, , )
j n j j k i j i k
x x k m
n
,1
1
( 1, 2, , )
n
k ik
i
x x k m
n
, x( ,x x1 2,,xn)Step four: Dynamic clustering of fuzzy cluster analysis.
Step five: Call the main program, input data, output dynamic clustering diagram. The following is the clustering results of 43 indicators parameter dividing into 5 classes:
λ=0.4556
{1 11 12 10 8 9} Motor neurons {2 35 36 37 13 14 15} purk neurons {3 38 42 41 43 44 39 40} Pyramidal neurons {4 17 19 18 16 20}Sensory neurons
{5 23 33 29 32 21 26 6 31 24 28 30 34 22 25 27 7 48 49 50 46 45 51 47} Intermediate neurons
This can be seen that only two classification results are not correct, Accuracy was 96%. However, if it is divided into 7 classes, 12 results is not correct, Accuracy dropped to 76.5%.
Use of
F
distribution to examine the effectiveness of
, whenn
51,
r
5,
f
21.1228
; when51,
7,
n
r
f
13.6861
;when
0.05
, Look-up table:F
4, 47
2.61
,F
7, 47
2.25
,Obviously, it is valid for the classification.
In order to obtain each group’s classification geometric characteristics, We take the group number t=[6,7,8,22,8] ,
i
t
: represent the i group’s samples number,11 12 1
21 22 2
1 2
m
m
n n nm
x
x
x
x
x
x
x
x
x
x
is the normalized data matrix, make:
1 ( ) 0
1
( )
t i k ik i tx
x
t i
; 11
n k ik ix
x
n
;,make 1 ( )1 r
i
k k
j
f
x
x
, 1 ( ) 2 1 0 r t i ik kj i t
f
x
x
;then1
2
(
)
(
1)
f n r
f
f r
reflects the gap between each group and gap within each group. It is not difficult to prove: thebigger f is, the more it can reflect indicators rates between each group, so, sort by the elements of f , Find the geometric characteristics whose current classification impact is the greatest and then could well reflect the spatial morphology of neurons.
m=21,that take 21 indicators, 6 geometric characteristics which are obvious in each group are:
Motor Purk Pyramidal Sensory Interneuron
N_stems EucDistance SectionArea Euc Distance N_stems
N_bifs Volume N_stems N_stems Terminal_degree
N_branch N_branch EucDistance Volume SectionArea
Surface N_bifs Branch_Order TerminalSegment SectionArea
SectionArea SectionArea N_tips SectionArea N_bifs
5
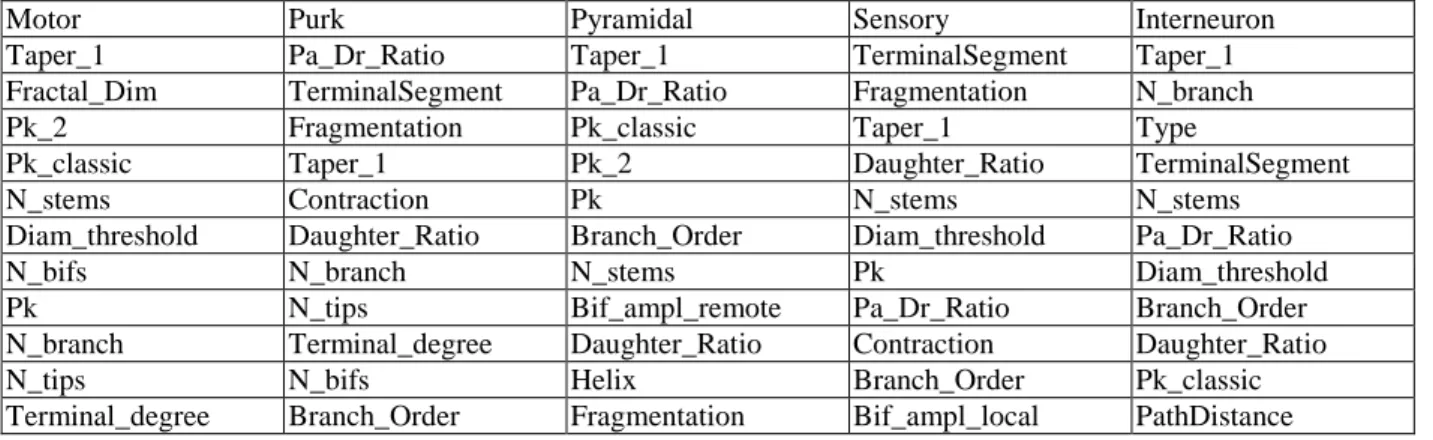
m=43,that take 43 indicators, 11 geometric characteristics which are obvious in each group are:
Motor Purk Pyramidal Sensory Interneuron
Taper_1 Pa_Dr_Ratio Taper_1 TerminalSegment Taper_1
Fractal_Dim TerminalSegment Pa_Dr_Ratio Fragmentation N_branch
Pk_2 Fragmentation Pk_classic Taper_1 Type
Pk_classic Taper_1 Pk_2 Daughter_Ratio TerminalSegment
N_stems Contraction Pk N_stems N_stems
Diam_threshold Daughter_Ratio Branch_Order Diam_threshold Pa_Dr_Ratio
N_bifs N_branch N_stems Pk Diam_threshold
Pk N_tips Bif_ampl_remote Pa_Dr_Ratio Branch_Order
N_branch Terminal_degree Daughter_Ratio Contraction Daughter_Ratio
N_tips N_bifs Helix Branch_Order Pk_classic
Terminal_degree Branch_Order Fragmentation Bif_ampl_local PathDistance
3. CLASSIFICATION OF SIMILAR NEURONS IN DIFFERENT ANIMALS
The morphology of neurons is complex and diverse, different animals have different neurons, the same animals also have different neurons, Similar neurons in different animals also have differences. Then when distinguish morphological characteristics of same type of neurons in different animals, the parameters of distinguishing features should be selected to reflect the following three aspects:
Such morphological features can well represent the characteristics of this class of neurons;
At the same animals species, dissimilarity of such neurons’ morphological characteristics should be as small as
possible;
At the different animals species, dissimilarity of such neurons’ morphological characteristics should be as big as possible;
3.1. Model Based On Tree Structure
Due to the similarity of tree structure[6] and the morphology of neurons, using a tree structure model to simulate the geometry distribution of neurons is just right.
3.2. The Selection Of Morphological Features
Tree structure-based neuron model inherits all the advantages of tree model; it is benefit for the statistics of the
details of the neurons’ characteristics; get more detail information, contribute to distinguish of similar neurons in different animals’ nervous system. When selected morphological parameters, the following two characteristics are for reference:
Characteristic one: Branch length
Neurons’ tee structure, from the lowest level, where the nerve endings exist, as a starting point, travel turn to the root node which is labeled one, find out the length of each nerve endings to the AV which is labeled one, take all the length values as parameters of this kind of morphological characteristics.
In the three-dimensional space where Neurons located, the distance formula between two adjacent AV a1 and a2
is: 2 2 2
1 ( 1 2) ( 1 2) ( 1 2)
d x x y y z z
Among, the space coordinates of
a
1 is( ,
x y z
1 1, )
1 , the space coordinates ofa
2 is( ,
x y z
2 2,
2)
, then the branchlength formula from one nerve ending to the AV which is labeled “one” is
l
d
1d
2
d
3...
d
n, Among, n isthe number of branch from nerve ending to the AV which is labeled “one”. Characteristic two: Number of sub-AV
Number of sub-AV is defined as the number of AV which is non-home AV and associated with this AV. through traversing and searching the generated neurons tree to obtain the number of AV whose number of sub-AV is 0. Similarly, we can in turn obtain the number of AV whose number of sub-AV is 1,2…… . So we can use the number of sub-AV as indicators of distinguishing morphological characteristics.
Table 2. Relationship table of home AV and sub-AV
AV label Home AV label Number of sub-AV sub-AV label
B A 2 C and D
C B 2 E and F
E C 1 G
6
We can known from the analysis of table 2, AV A, AV C and AV D are connected with AV B, among them, AV A and AV B are home AV, AV C and AV D are AV of AV B. As shown in the table, the number of sub-AV of sub-AV B is two, and the sub-sub-AV is C and D respectively; the number of sub-sub-AV of sub-AV C is also two, and the sub-AV is E and F respectively; the number of sub-AV of AV E is one, and its sub-AV is G; the number of sub-AV of AV F is one, and its sub-AV is H; By traversing the entire neurons tree structure model we can obtain each AV’s corresponding number of sub-AV, can use number of sub-AV as morphology Indicators of judgment. Following
takes pig’s purk neurons and mouse’s purk neurons as examples, by tree model calculating obtain the following morphological characteristics value:
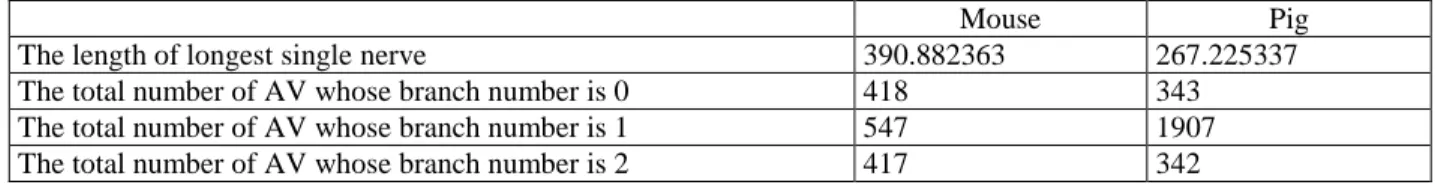
Table 3. Comparison of Purk neurons morphological characteristics of Mouse and Pig
Mouse Pig
The length of longest single nerve 390.882363 267.225337
The total number of AV whose branch number is 0 418 343
The total number of AV whose branch number is 1 547 1907
The total number of AV whose branch number is 2 417 342
Analysis shows: for purk neurons, in these extracted characteristics, there are two most prominent features, One is the length of the longest single nerve, neurons belong to the pig, its length of the longest single nerve is very
close; Neurons belong to the mouse, is also very close, but pig’s length of the longest single nerve is far less than
mouse; the other is the total number of AV whose branch number is 1, the total number of AV who belongs to pig and whose branch is one, is very close, AV who belongs to mouse, is also very close, but the total number of AV who belongs to pig and whose branch number is one, is far more than mouse. We can see from the classification results that, by choosing above two morphological characteristics, we can well distinguish which animals this kind of neurons belong to.
4. CONCLUSIONS
This paper analyze the complexity of diversity of neurons space shape, through a variety of methods, trial again and again, Using cluster analysis, neural network algorithms, etc, finally, by comparison, establishes a classification method of fuzzy clustering. On known data, obtained better classification results, when λ=0.4556, classify neurons in A, B, The results is 96% correct, But further divided into 7 class, in this level the accuracy is only 76.5%.
Using online data, and the classification algorithm written and designed by myself, analyze similar neurons’
different characteristics in different animals. We obtains that, aggregate indicators of neurons can better classify neurons, but can not distinguish the morphological characteristics of different animals, while using the component indicators of neurons can distinguish them clearly. For example, using single nerve branch’ longest length and the total number of non-branching AV, can distinguish purk neurons between pig and mouse.
In addition, the author generates a new idea, puts forward the new concept of flat level ( flat level: Neurons are known as a certain width, height and depth ,they are w, h, d, mark α=min (w, h, d), The other two larger variables
are denoted as b, c, then neurons flat level can be defined as
2 2
a
b
c
), neurons flat level is a important
geometry which reflect neurons space shape, purk neurons projection difference in different coordinate plane, the shape of purk is similar to two-dimensional. If adding flat level into the process of classification of neurons, it should improve the classification accuracy in a certain extent, It remains need follow-up experiments.
5. REFERENCES
[1]. NeuroMorpho.Org.http://neuromorpho.org/neuroMorpho/index.jsp,2010,9.
[2]. L-Neuron project. Lm and corresponding software. http://cng.gmu.edu:8080/Lm/ , 2010,9.
[3]. Xiancai Gui. BP neural network’ implementation and application in MATLAB. Zhanjiang Normal College, pp: 79-83,2004.
[4]. Kaili Zhou, Yaohong Kang. Neural network model and its Matlab simulation program design. Tsinghua University Press 2005
[5]. Jijian Xie, Chengping Liu. Fuzzy Mathematics and Its Applications(Third Edition). Huazhong University Press,2006.