Internal migration of Canadian immigrants,
1993–2004: Evidence from the Survey of
Labour and Income Dynamics
Karen M. King
The Martin Prosperity Institute, Rotman School of Management
University of Toronto
[email protected]
K. Bruce Newbold
School of Geography and Earth Sciences
McMaster University (Hamilton, ON)
Abstract
Combining the 1993, 1996, and 1999 six-year panels of the Survey of Labour and Income Dynamics Master Files, the purpose of the paper is twofold. First, it examines the migration and distribution pat-terns of the foreign-born across Census Metropolitan Areas (CMAs). Second, it examines how internal migration modeling results may differ when pre- and post-migration measures are used. Results suggest that internal migration of the foreign-born generally does not increase their dispersion across Canada, with the foreign-born primarily choosing one of the three immigrant gateway cities of Toronto, Montreal, and Vancouver, or moving to other relatively large CMAs.
Keywords: immigrant, internal migration, Canada.
Résumé
En combinant les fichiers maîtres de panels obtenus sur une période de six ans de l’Enquête sur la dynamique du travail et du revenu de 1993, 1996 et 1999, cet article a deux objectifs principaux. Premièrement, examiner la migration et les modèles de répartition des gens nés à l'étranger dans toutes les régions métropolitaines de recensement (RMRs). Puis, examiner comment les résultats des modèles de migration interne varient selon que des mesures pré-migration ou post-migration ont été utilisées. Les résultats suggèrent qu’en général, la migration interne des gens nés à l’étranger n'accroit pas leur réparti-tion dans le pays, et que les gens nés à l'étranger choisissent de vivre principalement dans une des trois villes portails d’immigration ; soit Toronto, Montréal et Vancouver, ou dans d’autre RMRs de taille importante.
Introduction and background
With over 200,000 immigrants admitted annually to Canada as refugees, family spon-sored, or economic immigrants1 over the last decade, and with most of these settling in Toronto, Montreal, or Vancouver, there is growing concern about the geographic centration of this population, with both long-term and newly arrived immigrants con-centrated in a handful of provinces and census metropolitan areas (CMAs). Ontario and British Columbia, for instance, have the largest proportion of foreign-born, with 27 per cent and 26 per cent of their total population in 2001, respectively, followed by 15 per cent in Alberta (Statistics Canada 2003a). More precisely, immigration is primarily an ur-ban issue, with the proportion of immigrants living in CMAs increasing from 84 to 94 per cent between 1981 and 2001, and with the proportion of immigrants living in Toronto, Montreal, and Vancouver increasing from 58 to 73 per cent over the same period (Schel-lenberg 2004). In 2001, the CMAs of Toronto, Vancouver, and Hamilton had the largest proportion of foreign-born with 44 per cent, 38 per cent, and 25 per cent of their total population foreign-born, respectively, while Montreal had 18 per cent (Statistics Canada 2003a). Toronto has one of the largest proportions of foreign-born in the world; in comparison, other immigrant-receiving cities in the rest of the world have smaller pro-portions, including Miami (40 per cent), Sydney (31 per cent), Los Angeles (31 per cent), and New York City (24 per cent; Statistics Canada 2003b). Recent immigrants, or those who arrived in Canada between 1991 and 2001, primarily chose Toronto (43 per cent) as their destination, while the two other gateway cities of Vancouver and Montreal received smaller proportions (18 and 12 per cent, respectively; Statistics Canada 2003b). Conse-quently, the impact of immigration is largely felt in a handful of CMAs and provinces.
Faced with a native-born population that is aging and declining populations in many smaller urban areas on the one hand, and a highly concentrated immigrant population on the other, Citizenship and Immigration Canada (CIC), along with provincial govern-ments, have attempted to encourage immigrant settlement outside of the three major immigrant destinations. For instance, the Provincial Nominee Program allows provinces and territories to nominate economic immigrants who intend to reside in their province or territory for expedited immigration processing. However, there has been limited suc-cess thus far, with only a small fraction of immigrants entering Canada through this program. In 2003, the Provincial Nominee Program settled 4,418 immigrants in Canada (out of 221,355 immigrants admitted to Canada in the same year), increasing to 6,248 in 2004 (CIC 2005). Moreover, there is no mechanism to keep immigrants in their initial settlement location.
The issue is therefore whether post-immigration relocation decisions reinforce these provincial and urban concentrations, or whether the immigrant population does, in fact, disperse after arrival. Between 1981 and 2001, Canada’s foreign-born population became more concentrated in Vancouver and Toronto, primarily due to the destination choices of new arrivals. However, post-immigration patterns differ between arrival cohorts, with those arriving in the late 1970s and early 1980s increasing the proportion living in gateway cities, and those arriving in the early 1990s decreasing the proportion (Hou 2004). Hou and Bourne (2006) found internal migration increases the concentration of immigrants
in Toronto and Vancouver, with immigrants less likely to out-migrate and more likely to in-migrate from these cities than the Canadian-born. Unlike the two gateway cities of Toronto and Vancouver, Montreal does not follow the same pattern; instead, internal mi-gration has led to the dispersal of immigrants from Montreal (Hou and Bourne (2006).
Although there is no long-term tracking of immigrant settlement location and reloca-tion decisions, there is some suggesreloca-tion that their initial locareloca-tion is short-lived (Liaw and Xu 2005). Concomitantly, greater insight into the determinants of Canadian immigrants’ internal migration behaviour is needed to understand the complex migration patterns and impacts of relocation. First, what motivates immigrants to make an internal migration? Canadian data sources do not include information on migration motivations, excepting the Longitudinal Survey of Immigrants to Canada; as a result, the reason for migration choices must be inferred. Second, if an internal migration occurs, what determines the new destination? With much of the Canadian literature focused on inter-provincial mi-gration, there is little understanding of the potential of internal migration to disperse or concentrate immigrant settlement, and the relative impact on individual CMAs. These two questions are particularly important in light of the federal government’s attempt to redistribute the immigrant population (CIC 2004).
This paper examines the internal migration of the foreign-born in Canada between 1993 and 2004, using data drawn from the 1993, 1996, and 1999 panels of the Survey of Labour and Income Dynamics (SLID) Master Files, which provide a longitudinal as-sessment of residential location choices. The objectives of this paper are twofold. First, the paper describes the migration and distribution patterns of the foreign-born across CMAs, in contrast to the bulk of research that has examined internal migration at the provincial scale (see, for exceptions, Ray 1994; Lo and Wang 1997; Moore et al. 2000; Moore and Pacey 2003; Hou and Bourne 2006; King and Newbold 2007). Second, the paper examines how internal migration modeling results may differ when pre-migration or post-migration characteristics of migrants are used.
Internal migration in Canada and theoretical framework
The empirical analysis is set within a human capital perspective (Sjaastad 1962). Stud-ies in this tradition suggest that migration propensity is related to a number of individual factors, such as age, education, sex, and marital status (DaVanzo and Morrison 1981; Greenwood 1985). In particular, the theory defines migration as an investment in human capital, whereby the costs of migration are balanced against future expected returns. With this, migration is highly selective for socio-economic and demographic characteristics. Migrants tend to be among those who are young, educated, and proficient in English (Kritz and Nogle 1994; Nogle 1994; Gurak and Kritz 2000). Individuals tend to migrate at younger ages to maximize the benefits of migration over the course of a lifetime; meanwhile, education is a proxy for the ability to gather information on other opportu-nities (Greenwood 1975; Newbold 1996). Households with fewer members tend to be more migratory than their larger counterparts, primarily due to fewer ties to a location diminishing the cost of a migration (Robinson and Tomes 1982).
inter-nal migration, while those admitted as economic immigrants tended to have higher migra-tion rates during the first year of residency (Nogle 1994). Newbold (2002) found that the propensity to migrate among immigrants declined with both increasing age and residence duration. Mobility is also driven by residential needs, which change due to life cycle fac-tors, such as changing household structures (Rossi 1955). Changes to the life cycle of a household may alter housing needs, neighbourhood characteristics, and/or accessibility (Michelson et al. 1973; Clark and Onaka 1983). Demand for housing services may rise due to changes in the size of households, as well as the composition of households.
Analysis of foreign-born mobility should also recognize differences across groups with respect to their socioeconomic and sociocultural development in Canada. Extend-ing the human-capital framework, foreign-born specific variables are important in the analysis of internal migration. For the foreign-born, the presence or absence of immi-grant communities has been associated with increased migration propensities; those in a community are less likely to migrate out, while those external to the community are more likely to migrate into it (Kritz and Nogle 1994; Gurak and Kritz 2000; Logan et al. 2002). Moore and Rosenberg (1995), for instance, found that an increase in the relative concentration of immigrants from the same region decreased the propensity to migrate. Moreover, residential choice amongst immigrants may differ greatly from those of the native-born, due to the desire to live with co-ethnics and a greater sensitivity to economic conditions (see, for example, Kritz and Nogle 1994; Gurak and Kritz 2000).
Nogle’s (1994) internal migration analysis of immigrants to Canada revealed that internal migration is not solely for maximizing income. Instead, there is an important “friends and family” effect, which represents the strength of family and friends to draw immigrants to a particular location. Findings from Wave 1 of the Longitudinal Survey of Immigrants to Canada affirm these results, as the presence of family in the same city was the primary reason given for residential choice (Newbold 2007). The size of pre-existing immigrant communities is strongly correlated with the size of the region, and thus of amenities, and with economic and non-economic opportunities, thereby encouraging continuing settlement (Hou 2004). It is in this vein that the origins and destinations of internal migrations are used to proxy the importance of immigrant communities, and the presence of family and friends.
Immigration-specific variables, including region of birth and period of arrival, can proxy culture or location-specific capital. The foreign-born have already made at least one international move, thereby indicating that they are willing to leave social and personal capital (DaVanzo 1978; Krtiz and Nogle 1994). Period of immigration should be con-trolled, as the foreign-born differ in the immigration stage, and so should settlement area. For the foreign-born in Canada, recent arrivals are more likely to make post-immigration moves than their counterparts who arrived earlier (Newbold 1999, 2002).
Data and methods
The following analysis uses data drawn from Statistics Canada’s 1993, 1996, and 1999 panels of the Survey of Labour and Income Dynamics (SLID) Master files. SLID is a lon-gitudinal survey, with each panel collecting labour market and income information over a six-year period. In addition to labour market activity and income information, SLID also collects information on socioeconomic and demographic characteristics and household location. The purpose of SLID is to provide insight into the economic well-being of Canadians, and the economic changes faced by individuals and households through time. Each of the three panels consists of approximately 15,000 households.2
The advantages of working with the SLID files are twofold. First, much of the ex-isting literature has examined the determinants of international and internal migration, primarily using cross-sectional data. Census-based cross-sectional data has a restrictive time frame over which mobility is captured (typically 5 years), and masks multiple migra-tions such as return migramigra-tions. Thus, the longitudinal nature of SLID allows for more accurate tracking of individuals on a year-to-year basis. Second, individual characteristics of migrants (and stayers) are typically measured post-migration, owing to the structure of census data files typically used for migration analysis. But end-of-period information may not accurately reflect circumstances that initially prompted the migration decision. For example, in terms of education, a migration may have occurred five years before the cen-sus with one level of education, but with additional education obtained over the five-year period. However, with few longitudinal datasets available for internal migration research, beginning-of-period (or pre-migration) characteristics are not routinely used. Therefore, little is known about the effect of using pre-migration versus post-migration measures in the understanding of internal migration behaviours.
To allow for a sufficient sample size, the three panels of SLID were merged to form one panel. The dates are recoded to reflect the information for each year of the panel; for instance, data for the first year of the panel (1993/1996/1999) are recoded as Year 1, and so forth until Year 6 (1998/2001/2004). The data include location of residence for each of the six years in the panels. The sample includes those foreign-born aged 20 to 59 at the start of each panel who were resident in Canada through all six years. Individuals who are institutionalized were excluded from the sample, as were residents of the three northern territories. Migrants are defined as individuals who changed CMA of residence at least once between 1993 (1996/1999) and 1998 (2001/2004). Migrants making single or multi-ple moves over the six-year period are not differentiated, due to issues with sammulti-ple size. The internal distribution of foreign-born internal migrants is examined at the scale
of the CMA/region. In addition to the twenty-seven CMAs defined by Statistics Canada
in 2001, ten provincial regions are created to cover the residual areas, creating a total of 37 regions. For example, the province of British Columbia contains three CMAs (Abbots-ford, Vancouver, and Victoria), with “Rest of British Columbia” containing all other areas in the province outside of these three CMAs. This process is continued for the other nine provinces (excepting Prince Edward Island, which does not have a CMA) to create residual provincial regions. However, due to the small sample size, and in compliance with Statistics Canada’s disclosure regulations, the 37 regions are reduced to 20 regions
in the descriptive analysis. In the logistic regression, the regions are aggregated into five
categories: (1) Gateway CMAs of Toronto, Vancouver, and Montreal; (2) Large CMAs:
Quebec City, Ottawa, Hamilton, Winnipeg, Calgary, and Edmonton; (3) all other CMAs; and (4) non-CMA areas.
The methodology used within this study can be subdivided into two parts. The first section focuses upon a descriptive analysis of the foreign-born, and their distribution and migration patterns. Specifically, the analysis focuses upon the region of residence in Year 1 and Year 6, and on the characterization of foreign-born internal migrants in Year 1 and Year 6. The second part of the analysis utilizes binary logistic models to measure the ef-fect of pre- and post-migration characteristics on an individual’s propensity to make an internal migration Canada; this is defined as follows:
) 1
/(
1 Xi
i e
P = + α +β
where X is a vector of explanatory variables, and the dependent variable contrasts the
foreign-born who have made an internal migration with those who did not have a change in region. That is, how do these two groups differ in terms of covariates associated with making the choice whether to migrate? This analysis focuses on individuals’ decisions to out-migrate from a CMA/region or to stay.
Covariates used in both parts of the analysis include standard socioeconomic and sociodemographic variables commonly found within the migration literature, with par-ticular reference to the internal migration literature of the foreign-born. Socioeconomic variables selected for inclusion include household income (less than $25,000, $25,000– 49,999, $50,000–74,999, $75,000–99,999, $100,000–149,999, or $150,000 and greater),3 labour force status (full-time employed, part-time employed, unemployed, not in labour force, or not stated), occupation (management, business, natural and applied science, health, social science, art and culture, sales and service, trade, or transportation), and edu-cation (high school degree or less, some university, non-university certificate, bachelor’s degree, or higher than a bachelor’s degree). Selected sociodemographic variables include age group (20–29, 30–39, 40–49, 50–59, or 60–65), marital status (married, single, or divorced, separated or widowed (DSW)), visible minority status (visible or non-visible), number of parents (0, 1, or 2), number of children (0, 1, 2, 3, or greater), and household size (1, 2 to 3, 4 to 5, or 6 or more). Finally, foreign-born-specific variables include years since immigration to Canada (0 to 9 years, 10 to 19 years, 20 to 29 years, 30 to 39 years, or 40 years or more) and region of birth (United States, United Kingdom, Western Europe, Eastern Europe, Northern Europe, Southern Europe, Middle East, Caribbean, South America, Rest of Asia (excluding South Asia and Southeast Asia), South Asia, Southeast Asia, Africa, Australia and New Zealand, and Other).
Results
Of the 6,994,999 (weighted) foreign-born in the 1993/1996/1999 panels of SLID, 465,567 (6.7 per cent) made at least one move during the six-year period covered by the panels, with 93,962 (20.2 per cent) of these movers making multiple moves. Of the 465,567 migrants, 196,196 (42.1 per cent) were from the 1993 panel, 137,604 (29.6 per cent) from the 1996 panel, and 131,767 (28.3 per cent) from the 1999 panel.
Distribution of foreign-born migrants
Tables 1 and 2 identify the proportion of the foreign-born population residing in each region in Years 1 and 6. For the non-migrant foreign-born (individuals who did not undertake an internal migration), Toronto was the choice of residence for 2,198,053 (33.7 per cent), followed by Vancouver with 855,297 (13.1 per cent) and Montreal with 767,488 (11.8 per cent). The primary region of origin of the migrants is Toronto, with 135,026 out-migrants (29.0 per cent), followed by Rest of Ontario (55,173 or 11.8 per cent), and Montreal (43,465 or 9.4 per cent). However, the major destinations of in-migrants in Year 6 are Rest of Ontario (103,041, or 22.3 per cent), Toronto (71,026, or 15.3 per cent) and Vancouver (32,269, or 6.9 per cent).
In comparing the three gateway cities, the potential for redistribution due to internal migration differs between Vancouver and that of Toronto and Montreal. Vancouver has a lower rate of out-migration as the origin of 2.1 per cent of migrants. However, it is the destination for 6.9 per cent of migrants. Vancouver’s ability to attract in-migrants coupled with its relatively low rate of out-migration resulted in a net gain of 22,475 foreign-born; Table 1. Region of residence in Year 1.
Foreign-born Non-migrants Out-migrants All foreign-born
Region Number Percentage
Abbotsford, BC 42,285 36,433 5,852 1.3 13.8
Vancouver, BC 865,091 855,297 9,794 2.1 1.1
Victoria, BC 70,989 61,467 9,522 2.1 13.4
Rest of British Columbia 247,681 224,118 23,563 5.1 9.5
Calgary, AB 225,425 210,434 14,991 3.2 6.6
Edmonton, AB 281,450 251,266 30,184 6.5 10.7
Rest of Alberta 122,075 109,049 13,026 2.8 10.7
Winnipeg, MN 156,800 140,534 16,266 3.5 10.4
Saskatchewan and
Rest of Manitoba 99,028 89,952 9,076 1.9 9.2
Ottawa, ON 267,537 247,319 20,218 4.3 7.6
Oshawa, ON 98,718 88,194 10,524 2.3 10.7
Toronto, ON 2,333,079 2,198,053 135,026 29 5.8
Hamilton, ON 213,621 196,521 17,100 3.7 8
St. Catharines-Niagara, ON 84,616 78,940 5,676 1.2 6.7
Kitchener, ON 191,804 176,865 14,939 3.2 7.8
London, ON 127,602 118,277 9,325 2 7.3
Rest of Ontario 558,802 503,629 55,173 11.8 9.9
Montreal, QC 810,953 767,488 43,465 9.3 5.4
Rest of Quebec 102,372 89,954 12,418 2.7 12.1
NS/NB/NFLD/PEI 95,072 85,642 9,431 2 9.9
Total (weighted) 6,994,999 6,529,432 465,567
while Toronto and Montreal had net losses of 64,000 and 19,468, respectively. The re-gions that gained the largest number of foreign-born from internal migration include Rest of Ontario (47,868), Vancouver (22,475), Calgary (14,246) and Hamilton (10,308). In addition to Toronto and Montreal incurring the largest losses of foreign-born due to internal migration, Edmonton had a net loss of 16,479, followed by Winnipeg (9,137) and Saskatchewan and Rest of Manitoba (5,077).
Examination of this internal migration suggests a limited dispersion of the foreign-born outside of the CMAs, with the exception of the province of Ontario, although it is unlikely that they are settling in truly “rural” areas but instead are remaining proximate to other metropolitan areas. In this case, there is evidence of some dispersion to smaller cities within the Rest of Ontario, as it posted a net gain of 47,868 foreign-born. In addi-tion, other southern Ontario CMAs such as Oshawa, Kitchener, Hamilton and St. Cath-arines-Niagara also had a net gain of 30,575, although these largely fall within the loosely defined Greater Toronto Area that extends east, west, and north of the Toronto CMA. However, the dispersion of foreign-born outside of CMAs in other provinces is limited; areas such as the Rest of Alberta, Rest of British Columbia and Rest of Quebec had very modest gains of 4,494, 1,115, and 604 foreign-born, respectively. Conversely, the Atlantic provinces had a net loss of 3,015 foreign-born due to internal migration.
Table 2. Region of Residence in Year 6.
Foreign-born Non-migrants In-migrants / All migrants
All foreign-born
Region Number Percentage
Abbotsford, BC 42,244 36,433 5,811 1.2 13.7
Vancouver, BC 887,566 855,297 32,269 6.9 3.6
Victoria, BC 68,984 61,467 7,517 1.6 10.9
Rest of British Columbia 248,836 224,118 24,718 5.3 9.9
Calgary, AB 239,671 210,434 29,237 6.3 12.2
Edmonton, AB 264,971 251,266 13,705 2.9 5.2
Rest of Alberta 126,569 109,049 17,520 3.8 13.8
Winnipeg, MN 147,663 140,534 7,129 1.5 4.8
Saskatchewan and Rest of
Manitoba 93,951 89,952 3,999 0.9 4.3
Ottawa, ON 273,689 247,319 26,370 5.7 9.6
Oshawa, ON 99,969 88,194 11,775 2.5 11.8
Toronto, ON 2,269,079 2,198,053 71,026 15.3 3.1
Hamilton, ON 223,929 196,521 27,408 5.9 12.2
St. Catharines-Niagara, ON 88,782 78,940 9,842 2.1 11.1
Kitchener, ON 200,502 176,865 23,637 5.1 11.8
London, ON 125,404 118,277 7,127 1.5 5.7
Rest of Ontario 606,670 503,629 103,041 22.1 17
Montreal, QC 791,485 767,488 23,997 5.1 3.0
Rest of Quebec 102,976 89,954 13,022 2.8 12.6
NS/NB/NFLD/PEI 92,058 85,642 6,416 1.4 7.0
Total (weighted) 6,994,999 6,529,432 465,567
The proportion of the foreign-born population that undertakes internal migration differs in each CMA/region. Based on region of residence in Year 1, the proportion of foreign-born undertaking an out-migration as a share of the foreign-born in the region of origin ranges from a high of 13.8 per cent in Abbotsford to a low of 5.4 per cent in Montreal. The large proportion of foreign-born undertaking internal migration high-lights the dynamics of internal migration exchange of foreign-born within Canada. For example, 17.0 per cent of foreign-born residing in the Rest of Ontario in Year 6 were in-migrants. However, although the proportion of foreign-born making internal moves is high, the net gains/losses of internal migrants are typically low, more suggestive of a limited net exchange between regions. For example, while Abbotsford has high in- and out-migration rates (over 13 per cent), the net result is a loss of only 41 foreign-born, meaning that internal migration did not translate to further concentration or dispersion of foreign-born in this CMA.
Pre- and post-migration characteristics comparing migrants
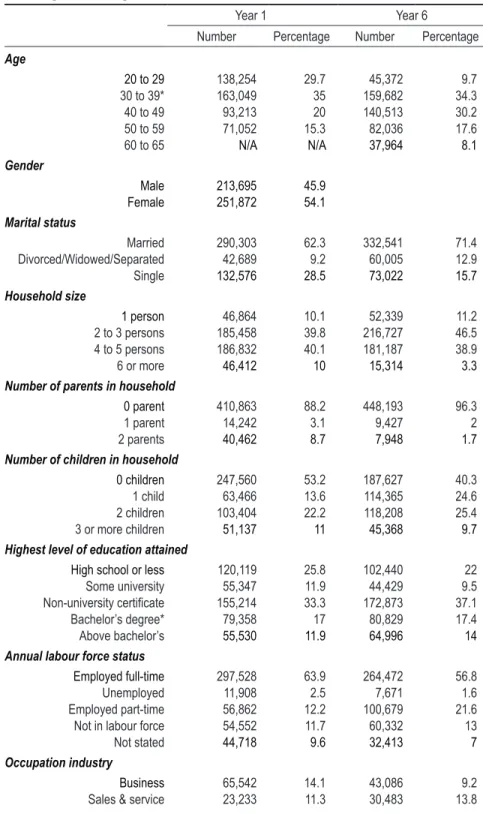
The largest proportion of migrants was born in the United Kingdom (18.1 per cent), Southeast Asia (14.3 per cent), South Asia (9.64 per cent), and the United States (9.6 per cent; Table 3). In addition, there is a relatively large share of migrants who have self-identified as a visible minority (45.0 per cent). Given that many migrants are recent arrivals, the region of birth characteristic indicates that there may be two distinct groups of internal migrants—one group characterized by Asian origins and more recent arrivals, and the second from older source countries such as the United Kingdom and Europe. However, migration propensities and reasons are likely to diverge.
The descriptive analysis using pre- and post-migration measures of socioeconomic and demographic characteristics of foreign-born echoes the findings from internal mi-gration literature (Table 3).4 Foreign-born migrants are primarily young, with the largest proportion in the youngest age category of 30 to 39 years (35.0 per cent in Year 1 and 34.3 per cent in Year 6) and married (62.3 per cent in Year 1 and 71.4 per cent in Year 6). Foreign-born migrants have varying education levels, with many having a minimum of a bachelor’s degree (approximately 30 per cent in both years); however, 25.8 and 22.0 per cent of migrants in Years 1 and Year 6 had a high school degree or less. In both periods, the majority of full-time employed migrants were in the sales and service or business-related occupations.
Despite these consistencies, there is variation in the results when using pre- and post-migration measures. In particular, measures of both household size and compo-sition differ between the two time periods. In general, the majority of migrants have small household sizes, with few dependents or additional persons in their household. Yet households with 2–3 persons or 4–5 persons each represented approximately 40 per cent of migrants in Year 1, while another 10 per cent lived alone or in households of 6 persons or more. Post-migration, the proportion of individuals living in the largest household of 6 persons or more declined to 3.3 per cent while those in the household size 2–3 persons increased to 46.6 per cent. Concurrently, household compositions changed both in regards to households with parents and with children. The proportion of migrant households without parents increased between Year 1 and Year 6 (88.3 and 96.3 per cent).
Table 3. Pre-migration (Year 1) and post-migration (Year 6) characteristics of foreign-born migrants.
Year 1 Year 6
Number Percentage Number Percentage
Age
20 to 29 138,254 29.7 45,372 9.7
30 to 39* 163,049 35 159,682 34.3
40 to 49 93,213 20 140,513 30.2
50 to 59 71,052 15.3 82,036 17.6
60 to 65 N/A N/A 37,964 8.1
Gender
Male 213,695 45.9
Female 251,872 54.1
Marital status
Married 290,303 62.3 332,541 71.4
Divorced/Widowed/Separated 42,689 9.2 60,005 12.9
Single 132,576 28.5 73,022 15.7
Household size
1 person 46,864 10.1 52,339 11.2
2 to 3 persons 185,458 39.8 216,727 46.5
4 to 5 persons 186,832 40.1 181,187 38.9
6 or more 46,412 10 15,314 3.3
Number of parents in household
0 parent 410,863 88.2 448,193 96.3
1 parent 14,242 3.1 9,427 2
2 parents 40,462 8.7 7,948 1.7
Number of children in household
0 children 247,560 53.2 187,627 40.3
1 child 63,466 13.6 114,365 24.6
2 children 103,404 22.2 118,208 25.4
3 or more children 51,137 11 45,368 9.7
Highest level of education attained
High school or less 120,119 25.8 102,440 22
Some university 55,347 11.9 44,429 9.5
Non-university certificate 155,214 33.3 172,873 37.1
Bachelor’s degree* 79,358 17 80,829 17.4
Above bachelor’s 55,530 11.9 64,996 14
Annual labour force status
Employed full-time 297,528 63.9 264,472 56.8
Unemployed 11,908 2.5 7,671 1.6
Employed part-time 56,862 12.2 100,679 21.6
Not in labour force 54,552 11.7 60,332 13
Not stated 44,718 9.6 32,413 7
Occupation industry
Business 65,542 14.1 43,086 9.2
(Table 3, cont’d.) Year 1 Year 6
Number Percentage Number Percentage
Social science 36,538 7.8 30,993 6.7
Management* 7,852 7.5 5,312 7.3
Trade and transportation 52,765 5.9 64,152 3.9
Natural and applied sciences 27,406 5 18,199 6.5
Primary and manufacturing 16,052 3.4 21,501 4.6
Health* 41,657 3 5,458 3
Art and culture 145,901 1.7 198,439 1.1
Don’t know 13,906 8.9 14,154 1.2
Not applicable 34,717 31.3 33,791 42.6
Total income
Less than $24,999 53,354 11.5 44,871 9.6
$25,000 to $49,999 110,905 23.8 102,544 22.0
$50,000 to $74,999 100,092 21.5 82,054 17.6
$75,000 to $99,999 92,784 19.9 114,146 24.5
$100,000 to $149,999 61,815 13.3 94,451 20.3
$150,000 or greater 46,618 10.0 27,502 5.9
Years since immigration
0 to 9 years 167,522 36.0 83,136 17.9
10 to 19 years 98,083 21.1 136,487 29.3
20 to 29 years 111,148 23.9 98,190 21.1
30 to 39 years 71,101 15.3 100,125 21.5
40 years plus 17,713 3.8 47,630 10.2
Visible minority status
Minority 209,700 45.0
Non-minority 255,868 55.0
Region of birth
United Kingdom 44,626 18.1
Southeast Asia 84,474 14.3
Western Europe (Excluding UK) 57,726 12.4
South Asia 27,886 9.6
United States 4,694 9.6
Eastern Europe 17,355 6.0
Africa 11,838 5.0
Caribbean 22,398 4.8
Rest of Asia 11,820 4.1
South America 18,755 4.0
Southern Europe 19,220 3.7
Middle East 66,709 2.5
Mexico and Central America 44,896 2.5
Australia, New Zealand, Pacific
and Other 23,538 2.1
Northern Europe 9,634 1.0
Total (weighted) 465,567
Note: Year 1 and Year 6 values are significantly different at p=0.05, with the exception of characteristics marked *
Together, these results suggest migration may have been motivated by moves out of the parental home. The majority of migrant households have no children (53.2 and 40.3 per cent, respectively, in Year 1 and Year 6), although a growing number of households have children; this suggests that changing household sizes have motivated migration.
While the majority of migrants are employed full-time, the proportion declined be-tween the two periods (63.9 and 56.8 per cent), while the proportion of unemployed migrants remained constant (although this may be just capturing labour market turnover) and the proportion of migrants employed part-time increased from 12.2 to 21.6 per cent over the six year period. However, this could be the result of two reasons. First, individu-als increasingly choose to transition into retirement through part-time work, and second, individuals may face difficulties finding full-time employment post-migration.
Considering the educational and occupational profile of the foreign-born, internal migration may be motivated by financial gain. The proportion of migrants who had total household incomes of less than $25,000 declined between Year 1 and Year 6 (11.5 to 9.6 per cent), with the proportion of migrants with total household incomes between $100,000 to $149,999 increasing from 13.3 to 20.3 per cent in the six years. However, the proportion of migrants that had total household incomes greater than $150,000 declined between Year 1 and Year 6, from 10.0 to 5.9 per cent.
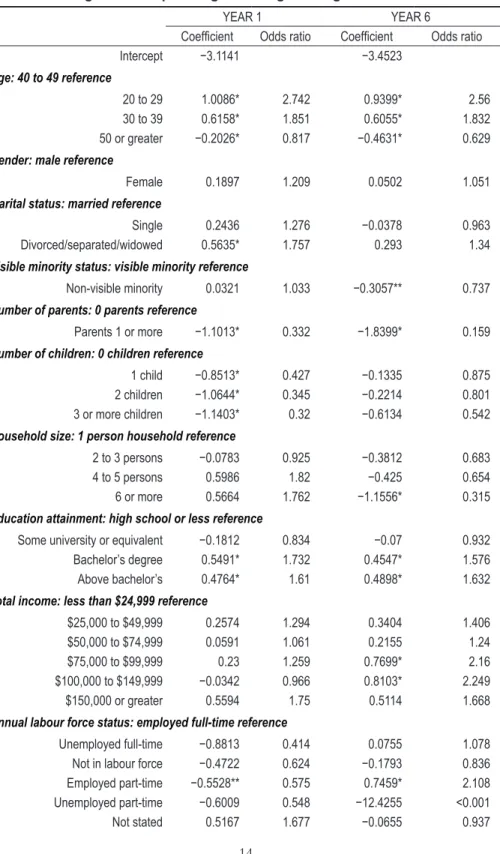
Pre- and post-migration characteristics: logistic regressions
Internal migration research has primarily used post-migration characteristics to examine internal migration behaviour. The second part of this analysis examines how the results of modeling internal migration may differ by using pre- or post-migration measures, with the migration decision dependent upon demographic, socio-economic, residential, and immigrant characteristics. Partial models are run for demographic, socio-economic, residential, and immigrant characteristics, and their results are consistent with the “Full” model presented in Table 4. The Full model examines the odds of a foreign-born in Canada making an internal migration across CMAs/regions during the six-year period captured in the SLID panels, using pre- and post-migration measures. Odds ratios are used to compare whether the probability of migration occurring between two groups is the same. An odds ratio greater than one indicates that the probability of migration is more likely for a given group in comparison to the reference group.
As regards demographic characteristics, results indicate that females are more likely to make an internal migration than their male counterparts. The foreign-born who are divorced, separated, or widowed are more likely to make an internal migration than their married counterparts; however, the odds ratios differ between pre- and post-migration (odds ratios of 1.76 versus 1.34, respectively). The examination of pre- and post-migra-tion measures of age show similar results. For example, in comparison to the foreign-born aged 40 to 49 years, individuals who are aged 20 to 29 years or 30 to 39 years are more likely to migrate, while individuals aged 50 years or greater are less likely to do so.
measures. The Year 1 results reinforce the earlier descriptive results, with migration moti-vations potentially linked to changing household structure.
In both Years 1 and 6, those with a tertiary education have greater odds of un-dertaking an internal migration than those with a high-school education or less. With regard to labour force status, the pre- and post-migration measures have differing results; however, the coefficients are not statistically significant. For example, in comparison to foreign-born who are employed full-time, foreign-born who are unemployed full-time or employed part-time are less likely to migrate in Year 1, but more likely to migrate in Year 6. The results indicate that individuals with the highest incomes are generally more mobile, with the likelihood of migration greater for those with total household incomes greater than $25,000.
However, with the majority of the foreign-born living in the three immigrant gate-way cities in Canada, the presence of family and friends may outweigh economic motiva-tions. The foreign-born who have lived in Canada for longer periods are less likely to have been migrants in comparison to the foreign-born who immigrated less than 10 years ago. Controlling for socioeconomic, demographic and residential characteristics, the model corroborates the descriptive analysis suggesting that both recent arrivals are undergoing post-immigration migration.
The regions in Canada are aggregated into four categories to differentiate between the types of possible residential choices of the foreign-born. The residence category in Year 1 indicates the strength of retention of the foreign-born by a residential category, while residence category at Year 6 indicates the attractiveness of a region. The gateway cities of Toronto, Vancouver, and Montreal are chosen as the reference group, as they are the primary residence of the foreign-born in Canada. Not unsurprisingly, in comparison to the foreign-born residing in the gateway cities of Toronto, Vancouver and Montreal, foreign-born residing in either other large CMAs, smaller CMAs, or non-CMA areas are more likely to have been migrants in Year 1. The pre- and post-migration models highlight different dynamics. For example, in comparison to the foreign-born in the gateway cities, the foreign-born who were residing in non-CMAs have an odds ratio higher than one in both the pre- and post-migration models. For example, in the pre-migration model, the foreign-born who resided in non-CMAs at the start of the six-year period are more likely to have been migrants in comparison to their counterparts in the gateway cities. However, the foreign-born residing in non-CMAs at the end of the six-year period are also more likely to be migrants. Therefore, depending on whether the pre- or post-migration models are used, the interpretation of the region variable is quite different.
Summary and conclusions
While there is a significant volume of research on internal migration of the foreign-born in Canada, this paper addresses two knowledge gaps in the literature. First, the paper examined internal migration at the CMA/region level and assesses the ability of post-arrival migrations to increase immigrant concentration or dispersion across Canada. Second, the paper examined how the choice of pre- or post-migration measures may af-fect internal migration modeling.
Table 4. Pre-migration and post-migration Logistic Regression Full Model.
YEAR 1 YEAR 6
Coefficient Odds ratio Coefficient Odds ratio
Intercept −3.1141 −3.4523
Age: 40 to 49 reference
20 to 29 1.0086* 2.742 0.9399* 2.56
30 to 39 0.6158* 1.851 0.6055* 1.832
50 or greater −0.2026* 0.817 −0.4631* 0.629
Gender: male reference
Female 0.1897 1.209 0.0502 1.051
Marital status: married reference
Single 0.2436 1.276 −0.0378 0.963
Divorced/separated/widowed 0.5635* 1.757 0.293 1.34
Visible minority status: visible minority reference
Non-visible minority 0.0321 1.033 −0.3057** 0.737
Number of parents: 0 parents reference
Parents 1 or more −1.1013* 0.332 −1.8399* 0.159
Number of children: 0 children reference
1 child −0.8513* 0.427 −0.1335 0.875
2 children −1.0644* 0.345 −0.2214 0.801
3 or more children −1.1403* 0.32 −0.6134 0.542
Household size: 1 person household reference
2 to 3 persons −0.0783 0.925 −0.3812 0.683
4 to 5 persons 0.5986 1.82 −0.425 0.654
6 or more 0.5664 1.762 −1.1556* 0.315
Education attainment: high school or less reference
Some university or equivalent −0.1812 0.834 −0.07 0.932
Bachelor’s degree 0.5491* 1.732 0.4547* 1.576
Above bachelor’s 0.4764* 1.61 0.4898* 1.632
Total income: less than $24,999 reference
$25,000 to $49,999 0.2574 1.294 0.3404 1.406
$50,000 to $74,999 0.0591 1.061 0.2155 1.24
$75,000 to $99,999 0.23 1.259 0.7699* 2.16
$100,000 to $149,999 −0.0342 0.966 0.8103* 2.249
$150,000 or greater 0.5594 1.75 0.5114 1.668
Annual labour force status: employed full-time reference
Unemployed full-time −0.8813 0.414 0.0755 1.078
Not in labour force −0.4722 0.624 −0.1793 0.836
Employed part-time −0.5528** 0.575 0.7459* 2.108
Unemployed part-time −0.6009 0.548 −12.4255 <0.001
may differ depending on pre- and migration measures. While the pre- and post-migration models share similar results, there were a few exceptions in the direction of in-fluence as well as magnitude. In particular, the results reveal the potential role of changing household composition. Using pre-migration household size, individuals in households of 4–5 persons or 6 persons or more are more likely migrate than one-person households, although this is not consistent with post-migration measures, where these large house-holds were less likely to migrate. More than likely, the analysis based on pre-migration characteristics caught those households that were ready to dissolve as children moved out of their parental home. In addition, compared to foreign-born who are employed full-time, foreign-born who are unemployed full-time or employed part-time are less likely to migrate in Year 1, but more likely to do so in Year 6. The interpretation of the residence category variable is quite different as the pre-migration model indicates the ability to retain type of residential category, while the post- migration model indicates a category’s attractiveness.
(Table 4, cont’d.) YEAR 1 YEAR 6
Coefficient Odds ratio Coefficient Odds ratio
Occupation industry: business reference
Natural and applied sciences −0.2585 0.772 0.0811 1.084
Health −0.5597 0.571 −0.3615 0.697
Social science 0.1439 1.155 0.1496 1.161
Arts and culture −0.04 0.961 −0.4053 0.667
Sale and service −0.49** 0.613 0.1569 1.17
Trade and transportation −0.4433 0.642 −0.6559 0.519
Primary −1.6911 0.184 −1.3832 0.251
Manufacturing −0.9348* 0.393 −0.3605 0.697
Don’t know 0.0411 1.042 −0.5823 0.559
Not applicable −0.0303 0.97 0.2335 1.263
Region of residence: gateway CMAs Toronto, Vancouver and Montreal reference
Large CMAs 0.8281* 2.289 1.1011* 3.007
All other CMAs 0.9787* 2.661 1.2605* 3.527
Non-CMA areas 1.2274* 3.412 1.9961* 7.36
Years since migration to Canada: 1 to 9 years reference
10 to 19 years −0.2978 0.742 −0.0341 0.966
20 to 29 years −0.4583** 0.632 −0.4559** 0.634
30 to 39 years −0.1091 0.897 −0.3552 0.701
40 years or longer −0.8875** 0.412 −0.6268** 0.534
Panel 1 0.1734 1.189 0.3505** 1.42
Panel 2 0.0397 1.041 0.0797 1.083
Likelihood ratio 271.702 352.985
* are significant at p =0.01. ** are significant at p =0.05.
Data has been weighted as per Statistics Canada’s disclosure regulations and normalized.
In addition, the longitudinal nature of SLID has allowed for more accurate tracking of the migration of individuals rather than the more restrictive timeframe over which mobility is typically captured in cross-sectional data. The yearly residential information contained in the SLID allows for a greater number of migrations to be recognized that would otherwise go undetected with cross-sectional data. However, by combining the three panels, due to the small sample size of the SLID, the period effects are largely un-studied, with the exception of the panel dummy in the regression model.
Largely echoing the internal migration literature, the foreign-born who undertake an internal migration are young, married, and employed (see, for example, Nogle 1994; New-bold 1996). The years since immigration and region of birth results suggest that there are two distinct streams of internal migrants: long-time residents of Canada from traditional source countries, likely making later-life migrations, and second, recent arrivals to Canada from Asian countries, making post-immigration relocation migrations. While the majority of migrants are in small households, changing family structures may be the stimulus for migration, a conclusion that is reinforced in the literature (see, for example, Robinson and Tomes 1982 and Rossi 1995).
On the other hand, the descriptive results suggest that financial gain may be a stim-ulus for migration. In addition, the model results suggest that those with higher total household incomes are more migratory than those in the lowest income group (less than $25,000). However, foreign-born migrants may rely on social networks of family and friends, meaning that the location of family and friends may be as important as economic considerations in the migration decision (Newbold 2000). A larger proportion of mi-grants are employed part-time or are not in the labour force post-migration, suggesting that migrants may have had difficulties finding full-time employment.
Overall, there is little indication of dispersion, with areas outside of CMAs receiving few internal migrants, with the exception of Ontario. There is some limited dispersion of the foreign-born to smaller cities within Ontario, with the Rest of Ontario having a net gain of 47,868 foreign-born. However, Southern Ontario CMAs proximate to To-ronto also had a net gain. Ontario was the only province to have a substantial net gain of foreign-born outside of its CMAs. In comparison, regions outside of CMAs in Alberta, British Columbia, and Quebec had modest net gains, while Atlantic provinces had a net loss.
Consequently, smaller CMAs and non-CMA regions face difficulties both with initial attraction of the foreign-born upon arrival, as well as attraction of the foreign-born after they have settled in Canada. These results suggest that once the foreign-born undertake post-arrival relocations, they are less mobile if they reside in one of the gateway cities of Toronto, Vancouver, and Montreal. Internal migration of the foreign-born generally does not increase dispersion across Canada, with post-arrival migrations of the foreign-born generally adding to existing immigrant populations in CMAs. These results suggest that internal migration of the foreign-born generally does not increase dispersion across Canada; therefore, policies aimed at dispersion may have limited effect. For communities located outside the main immigrant magnets to succeed in increasing their share of the foreign-born population in Canada, both attraction and retention policies/programs are needed.
post-migration allows only for inferences concerning possible post-migration motivations. Greater insight into the determinants of Canadian immigrants’ internal migration behaviour is needed to understand their complex migration patterns and impacts of relocation.
Acknowledgment
This paper was completed while the first author was a Social and Economic Dimen-sions of an Aging Population (SEDAP) PDF at McMaster University (Hamilton, ON). She gratefully acknowledges the funding support of this program for this research.
References
CIC (Citizenship and Immigration Canada). 2005. Annual Report to Parliament on Immigration, 2005. http://www.cic.gc.ca/english/resources/publications/annual-report2005/index.asp (retrieved December 28, 2008).
———. 2004. Sustainable Development Strategy. http://www.cic.gc.ca/english/resources/ publications/sds/strategy-2001.asp (retrieved December 28, 2008).
Clark, W.A.V. and J.L. Onaka. 1985. An empirical test of a joint model of residential mobility and housing choice. Environment and Planning A 17:915–30.
DaVanzo, J.S. 1978. Does unemployment affect migration? Evidence from micro data. The Review of Economics and Statistics 60(4):504–51.
DaVanzo, J.S. and P.A. Morrison. 1981. Return and other sequences of migration in the United States. Demography 18(1):85–101.
Greenwood, M.J. 1975. Research on internal migration in the United States: A survey. Journal of Economic Literature 13:541–6.
Gurak, D.T. and M.M. Kritz. 2000. The interstate migration of U.S. immigrants: Individual and contextual determinants. Social Forces 78(3):1017–39.
Hou, F. 2004. The initial destinations and redistribution of Canada’s major immigrant groups: Changes over the past two decades. Analytical Studies Branch Research Paper Series. Ottawa: Statistics Canada. http://www.statcan.gc.ca/pub/11f0019m/11f0019m2005254-eng.pdf (retrieved January 7, 2009).
Hou, F. and L.S. Bourne. 2006. The migration-immigration link in Canada’s gateway cities: A comparative study of Toronto, Montreal, and Vancouver. Environment and Planning A 38:1505–25.
King, K.M. and K.B. Newbold. 2007. Internal migration dynamics of a Canadian immigrant gateway: Toronto as an origin, way-station and destination between 1991 and 2001. Canadian Journal of Regional Science 20(2):243–62.
Kritz, M.M. and J.M. Nogle. 1994. Nativity concentration and internal migration among the foreign-born. Demography 31:509–24.
Liaw, K.L. and L. Xu. 2005. Problematic post-landing interprovincial migration of the immigrants in Canada: From 1980–3 through 1992–95. Journal of Population Studies 31:105–52.
Lo, L. and S. Wang. 1997. Settlement patterns of Toronto’s Chinese immigrants: Convergence or divergence? Canadian Journal of Regional Science 20:49–72.
Logan, J.R., R.D. Alba, and W. Zhang. 2002. Immigrant enclaves and ethnic communities in New York and Los Angeles. American Sociological Review 67:299–322.
Michelson, W., D. Belgue, and J. Stewart.1973. Intentions and expectations in differential residential selection. Journal of Marriage and the Family 35(2):189–96.
Moore, E.G., D. McGuinness, M.A. Pacey, and M.W. Rosenberg. 2000. Geographic dimensions of aging: The Canadian experience 1991–1996. SEDAP Research Paper No. 23. http:// socserv2.socsci.mcmaster.ca/~sedap/p/sedap23.pdf (retrieved May 5, 2007). Moore, E.G. and M.W. Rosenberg. 1995. Modeling migration flows of immigrant groups in
Canada. Environment and Planning A 27:699–714.
Newbold, K.B. 1996. Internal migration of the foreign-born in Canada.” International Migration Review 30:728–47.
———. 1999. Spatial distribution and redistribution of immigrants in the Metropolitan United States, 1980 and 1990. Economic Geography 75(3):254–71.
———. 2002. Measuring internal migration among the foreign-born: Insights from Canadian data. Review of Regional Studies 33(3):370–89.
———. 2007. Secondary migration of immigrants to Canada: An analysis of LSIC Wave 1 data. The Canadian Geographer/Le Géographe canadien 51(1):58–71.
Nogle, J.M. 1994. Internal migration for recent immigrants to Canada. International Migration Review 28:31–48.
Ray, B. 1994. Immigrant settlement and housing in metropolitan Toronto. The Canadian Geographer 38(3):262–5.
Robinson, C. and N. Tomes. 1982. Self-selection and interprovincial migration in Canada. Canadian Journal of Economics 15:474–502.
Rossi, P. 1955. Why Families Move: A Study of the Social Psychology of Urban Residential Mobility. Glencoe, IL: Free Press.
Schellenberg, G. 2004. Immigrants in Canada’s Census Metropolitan Areas. Ottawa-Hull: Statistics Canada, Analytical Studies Business and Labour Market Analysis Division. http://www. statcan.gc.ca/pub/89-613-m/2004003/4224946-eng.pdf (retrieved October 10, 2008). Sjaastad, L.A. 1962. The costs and returns of human migration. Journal of Political Economy
70:80–93.
Statistics Canada. 2000. Survey of Labour and Income Dynamics master files: 1993 Panel. Accessed via McMaster University’s Research Data Centre (January 2006 to March 2007).
———. 2003a. Canada’s Ethnocultural portrait: The Changing Mosaic. 2001 Census Analysis Series (Cat. No. 96F0030XIE2001008). Ottawa-Hull: Statistics Canada. http://www12. statcan.gc.ca/english/census01/products/analytic/companion/etoimm/contents.cfm (retrieved May 5, 2007).
———. 2003b. Immigration and Citizenship: Highlight Tables. 2001 Census Analysis Series (Cat. No. 97F0024XIE2001005). Ottawa-Hull: Statistics Canada. http://www12.statcan.ca/ english/census01/products/highlight/Immigration/Index.cfm?Lang=E (retrieved May 10, 2007).
———. 2003c. Survey of Labour and Income Dynamics master files: 1996 Panel. Accessed via
McMaster University’s Research Data Centre (January 2006 to March 2007).
———. 2006. Survey of Labour and Income Dynamics master files: 1999 Panel. Accessed via
McMaster University’s Research Data Centre (January 2006 to March 2007).
———. 2007. Consumer Price Index. CanSim II Series V735319. http://datacentre.chass.utoronto. ca/cansim (retrieved April 10, 2007).
Trovato, F. 1988. The interurban mobility of the foreign born in Canada, 1976–81. International Migration Review 22:59–86.