The Financial Impact of the Fukushima Reactor Meltdown
on the Stock Returns of German Nuclear Power Providers
Per Espen Schug
Dissertation written under the supervision of Professor Geraldo Cerqueiro
Dissertation submitted in partial fulfilment of requirements for the MSc in
Finance, at the Universidade Católica Portuguesa, 24.05.2018.
Abstract
The purpose of this thesis is to determine the financial impact of the Fukushima reactor meltdown on the stock returns of German nuclear power providers. It was argued that the Fukushima incident affected these companies beyond the event itself, as it sparked a change to the political climate towards nuclear power. The day Chancellor Merkel announced the decision to end all nuclear power production in Germany by 2022 was deemed the most significant event after Fukushima. An event study was used to measure the effects of both events on a German sample and an EU sample. The results showed that the Fukushima reactor meltdown had a significant negative effect on nuclear power providers of both samples. The negative effect was explained by investors reassessing the risk of dealing with nuclear power and their reaction to new government policies. The announcement made by Chancellor Merkel also had a significant negative effect on German nuclear power providers. The negative effect was explained by the market reacting to the companies’ loss of expected future cashflows and the uncertainty regarding how they will adjust their business strategy. The financial loss experienced by the shareholders of the three German nuclear power providers was EUR -6,94 billion.
Title: The financial impact of the Fukushima reactor meltdown on the stock returns of German
nuclear power providers.
Author: Per Espen Schug
Keywords: Event study, Fukushima, Financial impact, Germany, Nuclear power providers Abstrato
Esta tese tem como objetivo determinar o impacto financeiro da explosão do reator nuclear em Fukushima nos retornos das ações das empresas de energia nuclear alemãs. Após o incidente em Fukushima, as consequências para as empresas continuarem a ser visíveis, uma vez que este despoletou uma mudança política na perceção do uso da energia nuclear. O dia em que a Chanceler Merkel anunciou a sua decisão para acabar com a produção de energia nuclear até 2022 foi, provavelmente, o evento mais relevante desde o incidente em Fukushima. Um estudo de evento foi utilizado para medir os efeitos de ambos os eventos numa amostra de empresas alemãs e da União Europeia. Os resultados mostraram que a explosão do reator nuclear em Fukushima teve um impacto significativamente negativo nas empresas de energia nuclear em ambas as amostras. O efeito negativo foi explicado pela reavaliação dos riscos da energia nuclear por parte dos investidores e pela sua reação às novas medidas políticas. Os anúncios feitos pela Chanceler Merkel tiveram igualmente um efeito negativo nas empresas alemãs de energia nuclear. Este efeito foi explicado pela reação do mercado às perdas de fluxo de caixa futuro por parte das mesmas empresas e pela incerteza em como estas irão ajustar a sua estratégia de negócio. A perda total experienciada pelos acionistas das três empresas de energia nuclear alemãs foi de -6,94 mil milhões de euros.
Título: O impacto financeiro da explosão do reator nuclear em Fukushima no retorno das ações
das empresas de energia nuclear alemãs
Autor: Per Espen Schug
Palavras-chave: Estudo de evento, Fukushima, Impacto financeiro, Alemanha, Empresas de
Acknowledgments
This master dissertation is the biggest step in my academic career so far, and I feel like I have learned a lot through this experience. I would have never been able to accomplish what I did without the support of certain people in my life. Now, I would like to use this opportunity to express my thanks to those who have helped me along the way.
Firstly, I wish to express my sincere thanks to Professor Geraldo Cerqueiro for being so supportive throughout the whole process of writing this dissertation. With his advice, I always had a clear view of what steps I needed to take next, in order to progress with my work.
Secondly, I would like to thank Professor Adrian Baldock, from my undergraduate program, for teaching me the fundamentals of writing a dissertation. He prepared me well for the academic challenges I faced when writing this dissertation.
Lastly, I would like to thank my family and friends for the encouragement and support during this very important time in my life. Special thanks go to my parents, who helped me overcome the emotional and financial challenges that this master program entailed.
Table of contents
1 Introduction ... 1
1.1 Fukushima reactor meltdown ... 1
1.2 Political implications ... 1
1.3 Research topic ... 2
1.4 European nuclear power industry ... 3
1.5 German nuclear power industry ... 4
1.5.1 E.ON ... 4
1.5.2 RWE ... 5
1.5.3 EnBW and Vattenfall ... 5
2 Literature review ... 5
2.1 Event study methodology ... 5
2.1.1 Advantages ... 6 2.1.2 Applications ... 6 2.1.3 Structure ... 6 2.1.4 Assumptions ... 7 2.1.5 Criteria ... 8 2.2 Event studies ... 8
2.2.1 Event studies on natural disasters ... 8
2.2.2 Event studies on nuclear disasters ... 9
2.2.3 Event studies on Fukushima ... 10
3 Methodology ... 12
3.1 Statistical methods ... 12
3.1.1 Calculations and parametric tests ... 12
3.1.2 Nonparametric tests ... 15
3.2 Introduction to events ... 16
3.2.1 Event 1 ... 16
3.2.2 Event 2 ... 17
3.3 Data and variables ... 17
3.3.1 Sample selection ... 17
3.3.2 Data sources ... 18
3.5 Confounding events ... 19 4 Results ... 19 4.1 Event 1 ... 19 4.1.1 German sample ... 19 4.1.2 EU sample ... 21 4.2 Event 2 ... 22 4.2.1 German sample ... 22 4.2.2 EU sample ... 23
4.3 Extended event period ... 24
4.4 Comparison to other studies ... 25
4.5 Validation ... 26 4.5.1 Market efficiency ... 26 4.5.2 Anticipation ... 28 4.5.3 Confounding events ... 28 5 Discussion of findings ... 28 5.1 Event 1 ... 29 5.2 Event 2 ... 30 5.3 Financial impact ... 31 6 Conclusion ... 32 Reference list ... 33 Appendices ... 37
Appendix A: Descriptive statistics ... 37
Appendix B: Event study results ... 38
Appendix C: Extended event window ... 47
Appendix D: Validation... 49
List of figures
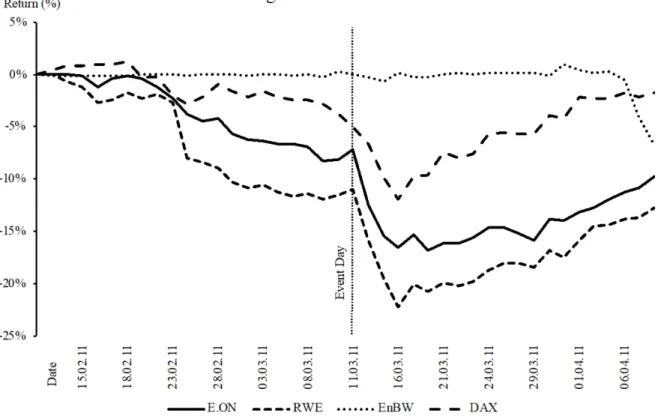
Figure 1.1: Stock Returns during the Fukushima Reactor Meltdown ... 2
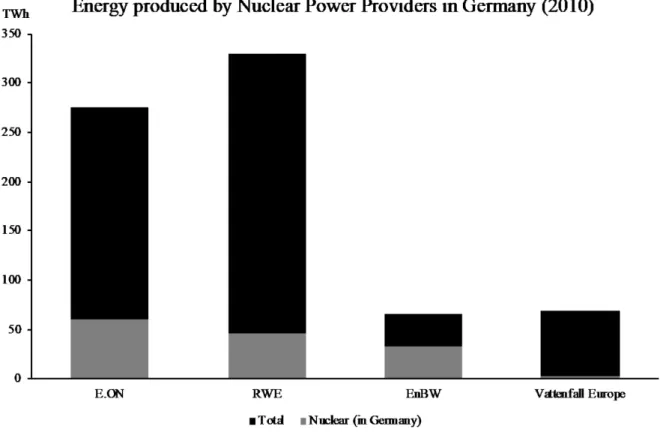
Figure 1.2: Energy produced by Nuclear Power Providers in Germany (2010) ... 4
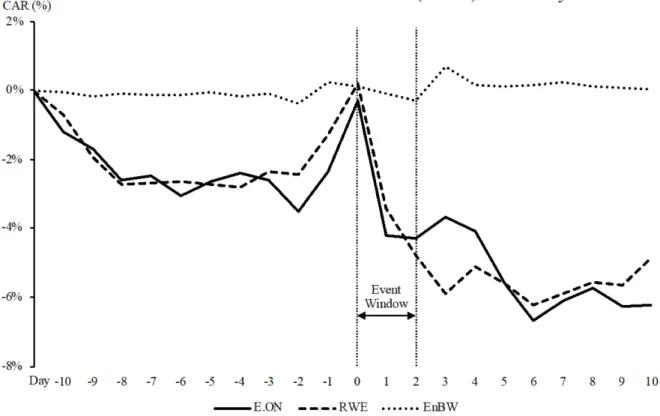
Figure 4.1: Event 1 - Cumulative Abnormal Return (MRM) - Germany ... 27
List of tables
Table 4.1: Event 1 - Average Cumulative Standardized Abnormal Return - Germany ... 20
Table 4.2: Event 1 - Average Cumulative Standardized Abnormal Return - EU ... 21
Table 4.3: Event 2 - Average Cumulative Standardized Abnormal Return - Germany ... 23
Table 4.4: Event 2 - Average Cumulative Standardized Abnormal Return - EU ... 24
List of abbreviations
ACSAR average cumulative standardized abnormal return AR abnormal return
CAR cumulative abnormal return CMRM constant mean return model
CSAR cumulative standardized abnormal return EU European Union
EUR Euro
Fukushima Fukushima Daiichi Nuclear Power Plant mil. million
MRM market return model
SAR standardized abnormal return TWh terawatt-hour
1 Introduction
1.1 Fukushima reactor meltdown
On Friday 11 March 2011 at 2:46 p.m., an earthquake occurred off the east coast of Japan. With a magnitude of 9,0, it was the most powerful earthquake in Japan’s recorded history. It did a lot of damage to buildings in the region, but even more destructive than the earthquake itself was the tsunami it caused. The tsunami wreaked havoc across major cities and harbours along the east cost of Japan. The 15-meter high wave also critically damaged the Fukushima Daiichi Nuclear Power Plant (Fukushima). According to the World Nuclear Association (2017), the water masses cut the power supply to the cooling system of three nuclear reactors. As a result, the fuel-rods heated up uncontrollably and there was little that could be done to prevent a reactor meltdown. Other nuclear power plants in the region were also damaged, but it became rather clear that the situation in Fukushima was most severe (ARD, 2011). Three hours after the tsunami hit Fukushima, TEPCO, the owner of the power plant, fist declared a state of nuclear emergency. Two hours later, the Fukushima prefecture ordered people within a 2km radius to the power plant to evacuate. The next day, Japan’s Prime Minister extended the evacuation zone to 20km, which meant that more than 200.000 people were forced to evacuate the area around Fukushima. On 12, 14 and 15 March, hydrogen explosions occurred in reactors 1, 3 and 4. Worst of all, a meltdown occurred in some of the reactors, and high levels of radiation were released into the air and water surrounding Fukushima. The nuclear power plant remained in a critical state until 15 March. On 26 December 2011, the Japanese government officially ended the incident (World Nuclear Association, 2017).
1.2 Political implications
This event had massive implications on nuclear power providers in Germany. Prior to Fukushima, the support of the federal government for nuclear power was very strong. In October 2010, all 17 nuclear power plants in Germany even received a lifetime extension of 12 years on average (Deutscher Bundestag, 2010: 6). However, the political tune towards nuclear power changed drastically, following the meltdown in Fukushima. On Monday 14 March, Chancellor Merkel reacted to what had happened in Japan, and announced a 3-months long moratorium, which put the lifetime extension of German nuclear power plants on hold. Consequently, eight power plants were shut down immediately, while all had to undergo security tests. A day later, the EU-Energy Commissioner Oettinger hosted a summit meeting with political representatives from member states and the industry to discuss security standards of nuclear power plants within the European Union (ARD, 2011). This chain of events seems
to have negatively affected the stock returns of German nuclear power providers (Figure 1.1). On 30 May, Chancellor Merkel announced that the governing parties had decided to shut down all nuclear power plants in Germany by 2022. This decision was made official in the parliament on 30 June. The eight power plants shut down during the moratorium would remain switched off indefinitely, while the remaining nine nuclear power plants would gradually shut down until 2022 (Deutscher Bundestag, 2011).
Figure 1.1: This figure shows the cumulative stock returns of the German market index DAX and the three nuclear power providers E.ON, RWE and EnBW around the time of the Fukushima reactor meltdown. EnBW was in the process of being acquired by the state of Baden-Wuerttemberg, which is why only few shares were in free float at that time.
1.3 Research topic
Over the past three decades, various event studies have been conducted on the effects of natural or manmade disasters on companies’ stock returns. For instance, Weiderman and Bacon (2008), tested the efficient market theory by looking at the effect of hurricane Katrina on stock returns of oil companies. Furthermore, Kalra et al. (1993) studied the effects of the 1986 Chernobyl nuclear accident on the stock prices of utility companies.
the impact of the political decisions made as a reaction to Fukushima. After all, they had severe implications on the industry. As of yet, no existing research on Fukushima distinguishes between the two, by using separate events. The event study methodology will be used to answer the following research question:
“What is the financial impact of the Fukushima reactor meltdown on the stock returns of German nuclear power providers?”
To fully answer the research question, the following objectives need to be fulfilled: 1. To compare and contrast theories on event study methodology.
2. To identify the most significant events for nuclear power providers in Germany. 3. To examine the effects of these events.
4. To analyse the impact on shareholders.
The 2011 Fukushima disaster has already been the topic of event studies, such as the one conducted by Ferstl et al. (2012). They tried to determine the effect of the meltdown on nuclear and alternative energy stocks world-wide. Ferstl et al. also included German nuclear power providers in their sample. However, they did not look at any effects beyond those of the event itself.
This study will fill this research gap, by also incorporating a political event connected to Fukushima. That way, a more comprehensive financial impact on stock returns of German nuclear power providers can be determined. To put it all into perspective, the effects measured in Germany will be compared to the effects of other nuclear power providers in the European Union (EU).
This dissertation will continue with a brief introduction to the European and German nuclear power industry, followed by a literature review, in which all the relevant theories and studies related to the topic will be presented. Then, the methodology used in this study will be explained. After that, the results will be analysed and discussed. Lastly, there will be a conclusion and a recommendation for future studies.
1.4 European nuclear power industry
In 2010, 14 countries in the EU operated nuclear power plants. Together, they supplied 871,3 TWh of nuclear energy that year. That accounts to an average of 34% of the total electricity supplied in those countries (IAEA, 2011: 12f). At the time of the Fukushima incident, 10 of the nuclear power providers in the EU were publicly traded.
1.5 German nuclear power industry
In 2011, the four energy companies that operated nuclear power plants in Germany are E.ON, RWE, EnBW and Vattenfall. They were also the four largest energy companies in Germany at that time. In 2010, the year before the disaster in Fukushima, they supplied German power grids with a total of 370,7 TWh. This accounted for 82,2% of all electricity fed into the grids for general supply (Bundesnetzagentur, 2011: 15). The same year, 140,5 TWh of electricity was produced in Germany through nuclear power (AGEB, 2011: 20).
Figure 1.2: This figure shows the total energy produced by the four energy companies E.ON, RWE, EnBW and Vattenfall Europe in 2010. It also shows the amount of nuclear energy produced by each company in Germany that year.
1.5.1 E.ON
E.ON SE is a German energy company that generates electricity through nuclear power, oil, gas, coal and renewable energy sources in Central Europe, Nordic countries, the UK and Southeast Europe. The E.ON group produced 275,5 TWh of electricity in 2010, with 133,8 TWh being produced in Central Europe (Figure 1.2). In Germany, 59,9 TWh were generated through nuclear power, meaning that nuclear power accounted for 45% of the total electricity
nuclear power in Nordic countries, which is the only region outside of Germany where it operates nuclear power plants (E.ON, 2010: 14).
1.5.2 RWE
Apart from nuclear power, the German energy company RWE AG also generates electricity through coal, gas, oil and renewable energy in Great Britain, Netherlands, Belgium and Southeast Europe. In 2010, the RWE Group produced a total of 329,7 TWh of electricity, of which 192,3 TWh were generated in Germany. Nuclear power accounted for 45,2 TWh that year, which is nearly 25% of the total electricity produced by RWE in Germany. Its nuclear power is exclusively produced in Germany (RWE, 2010: 76).
1.5.3 EnBW and Vattenfall
EnBW AG produced 65,5 TWh of electricity in 2010, where 33,4 TWh stemmed from nuclear power plants (EnBW, 2010: 3). In the same year, Vattenfall Europe AG generated 68,9 TWh in total and 2,1 TWh through nuclear power (Vattenfall Europe, 2010: 25). At that time, Vattenfall Europe AG was a holding company, owned by the Swedish energy company Vattenfall AB, which produced 172,5 TWh of electricity in 2010 and 43,6 TWh through nuclear energy (Vattenfall AB, 2010: 34).
2 Literature review
The following literature review aims to establish the theoretical background for the research question. Relevant theories and results of similar event studies will be summarised, compared and critically reviewed.
2.1 Event study methodology
McWilliams and Siegel (1997: 626) define the event study as a tool to measure the effect of an unanticipated event on stock returns. The magnitude of the abnormal returns during an event give information about the impact of the event on the company’s shareholders (MacKinlay, 1997: 13; Kothari and Warner, 2007: 5). An event study looks at the effect on a specific class of security. Most of the time it is common equity (MacKinlay, 1997: 13).
One of the first event studies was conducted by James Dolley (1933), who studied the price effects of stock splits. In the next 40 years, the methodology became more sophisticated, as researchers started to control for confounding events and removed unwanted effects. For instance, Fama et al. (1969) removed the effects of simultaneous increases in dividends, when studying stock splits. The methodology used today is still very similar to the one used by Fama et al. (1969) and other researchers at that time (MacKinlay, 1997:13).
2.1.1 Advantages
The fact that event studies look at stock returns has a number of advantages. According to Benston (1982: 210), these types of economic measures give a better indication about a company’s true performance than accounting-based measures, since the latter can be manipulated by managers. McWilliams and Siegel (1993: 626) agree that stock prices are less susceptible to manipulation and add that they give a better estimate of the true value of a firm. The reason for that is that a company’s share price is said to be based on the discounted value of all its future cash flows. Hence, all relevant information about the firm is also priced into it. Since event studies examine the effect of an event on a company’s stock returns, they should provide a more accurate picture of the effect than an accounting-based method (McWilliams and Siegel, 1997: 627).
2.1.2 Applications
Event studies are used to measure the effect of events related to finance, economics, accounting, law and management (MacKinlay, 1997; McWilliams and Siegel, 1997; Kothari and Warner, 2007). In their definition, McWilliams and Siegel (1997: 626) differentiate between endogenous and exogenous events. Endogenous events are events inside the control of a company, such as employee layoffs or corporate control changes. Exogenous events are outside the control of a company, like announcements of new legislations or liability cases. Moreover, event studies with shorter event windows are better suited to provide insights on the effects of corporate policy decisions (Kothari and Warner, 2007: 5). Event studies with longer event windows can be used to test market efficiency, as it is assumed that markets react very fast to new information. Thus, the effect of an event is not expected to persist long after the event took place (Fama, 1991: 1601).
2.1.3 Structure
MacKinlay (1997: 14f) explains that an event study consists of an event window and an estimation window. At first, the event window only includes the day of the event. However, it is common to add days surrounding the event day to the period. A typical event window consists of the event day and the day after. That way, the effects can be captured that occur after market close. Days prior to the event can also be included in the event window, especially, if there is a concern that information has leaked to the public. The impact of an event can be determined by measuring the abnormal return. The abnormal return is the actual return minus the expected return of the security. The expected return is the return that would have been expected had the event not taken place. It can be modelled in multiple ways. Two examples are the constant mean
return model and the market return model. In the constant mean return model, the stock return is expected to be constant over time. With the market return model, it is assumed that there is a stable linear relation between the return of the security and the return of the market. The estimation window should be a period of 120 days before the event and is used to either calculate the mean return or to estimate the market model parameters. McWilliams and Siegel (1997: 628) recommend a slightly longer estimation window of up to 250 days before the event. However, the estimation window should not include days from the event window, since that could lead to the event influencing the calculated expected return of the company (MacKinlay, 1997: 15).
The goal of an event study is to produce results that shed light on the root cause of the effects generated by the event (MacKinlay, 1997: 15f). Therefore, the abnormal returns need to be explained by showing that the results are consistent with some kind of theory (McWilliams and Siegel, 1997: 638). However, before any conclusions can be drawn from the results, it needs to be determined whether the abnormal returns are significant.
2.1.4 Assumptions
According to McWilliams and Siegel (1997: 629), the following three assumptions must be true, in order to be able to infer the significance of an event: markets are efficient, the event unanticipated and there are no confounding events during the event period. If all three assumptions are true, researchers can be more confident that they captured all abnormal returns related to the event.
Market efficiency means that all relevant information available to the market is very quickly priced into the share price of a company (McWilliams and Siegel, 1997: 630). If this assumption is deemed to be true, it is difficult to justify long event windows. An event is unanticipated if there was no knowledge about the event, prior to its announcement. If there were leakages of information or the event was anticipated, it becomes difficult to determine at what point in time the market first became aware of the information. Confounding events are events that can have a financial impact on a company and take place around the same time as the studied event. They make it difficult to isolate the effect of the event in question from other effects. For that reason, they weaken the validity of the test results (McWilliams and Siegel, 1997: 630ff).
Lastly, there are also some criticisms when it comes to event studies. Fama (1991: 1602) criticises that event studies do not paint a clear picture on how much of the abnormal returns can be explained by a rational reaction of the market to the information. Nevertheless, he acknowledges that this is only a minor criticism, and that event studies produce the cleanest evidence of market efficiency. Furthermore, Binder (1985: 371) claims that in the market return
model with a simple linear regression, the abnormal returns of the firms in the sample are assumed to be independent and identically distributed. However, when these firms operate in the same industry and are tested on an event in the same calendar period, the abnormal returns are not truly independent, nor is it likely that they are distributed equally among all companies. To avoid this problem, he suggests using a multivariate regression instead of a linear regression.
2.1.5 Criteria
McWilliams and Siegel (1997: 629f) identified five criteria that need to be considered when using an event study methodology: the size of the sample, nonparametric tests to identify outliers, the length of the event window, confounding events and an explanation of the abnormal returns. For event studies, small sample sizes are problematic, since the test statistics are based on the normal distribution assumption for large samples (McWilliams and Siegel, 1997: 634). MacKinlay (1997: 15) recommends to present summary statistics when dealing with small samples, since the distribution can be strongly influenced by a few outliers.
Moreover, it is important to choose the right length for the event window. The length should be based on the nature of the event (Ryngaert and Netter, 1990: 257). Using a long event window could indicate that the researcher believes that markets are inefficient or that the event was anticipated. They also make it more difficult to control for confounding effects (McWilliams and Siegel, 1997: 650). Generally, short event windows are said to be sufficient to capture the effect of an event, assuming that markets are efficient (McWilliams and Siegel, 1997, 636).
2.2 Event studies
Now that the theory has been explained, it makes sense to look at studies that have been conducted on events similar to the one used in this paper. That way, the results of this paper can later be compared to existing literature.
2.2.1 Event studies on natural disasters
In 2005, the Gulf of Mexico was hit by the devastating Hurricane Katrina. Weiderman and Bacon (2008) used this disaster to test the market efficiency theory. In their study they observed the effect of the hurricane on stock returns of 15 oil companies (Weiderman and Bacon, 2008: 11). Their results revealed that the hurricane had a significant negative impact on stock returns. Their findings also indicated a semi-strong market efficiency, as the stock returns began to drop significantly up to 25 days before the day Hurricane Katrina reached New Orleans. According to Weiderman and Bacon (2008: 11), this showed that the market was quick to anticipate the destruction that Hurricane Katrina would cause.
In addition, Yamori and Kobayashi (2002) conducted an event study on the impact of the 1995 Hanshin-Awaji earthquake on Japanese insurance companies. Due to the destruction caused by the earthquake, insurance companies had to make very high insurance payments. With their study, they actually set out to measure whether Japanese insurance companies had benefited from the disaster. The thesis behind it was that demand for insurance coverage would increase after natural disasters (Yamori and Kobayashi, 2002: 93). Yamori and Kobayashi (2002: 101) used a sample of 13 insurance companies. Their results showed that abnormal returns on the day of the earthquake were negative and highly significant for most companies in the sample. Furthermore, they found that the market reacted efficiently, as the cumulative abnormal return was only significantly negative right after the earthquake. Yamori and Kobayashi (2002: 107) conclude that the negative impact of earthquakes on the financial condition of Japanese insurance companies outweigh the benefits caused by the higher demand for insurance coverage.
Both Weiderman and Bacon (2008) and Yamori and Kobayashi (2002) found that natural disasters have a negative impact on the stock returns of effected companies and that the market is very efficient at incorporating the new information of the unanticipated event in their assessment of a company’s stock price. These studies also show that the event study methodology is applicable to natural disasters and that it is possible to get statistically significant results with fairly small sample sizes. These findings strengthen the confidence in this paper’s research design, as it also deals with the impact of a natural disaster on companies’ stock returns and relies on a relatively small sample size.
2.2.2 Event studies on nuclear disasters
The Three Mile Island (TMI) nuclear power plant, owned by GPU, suffered a reactor meltdown in 1979. It was the most significant commercial nuclear energy accident in the United States. Hill and Schneeweis (1983) studied the effects of the incident on the monthly risk-adjusted returns of 64 U.S. electric utility companies. They also divided their sample into two subsamples, consisting of nuclear and non-nuclear utility companies (Hill and Schneeweis, 1983: 1285). They found that the reactor meltdown had a significant negative effect on the stock returns for both nuclear and non-nuclear utility companies. However, the impact was larger for nuclear companies. Hill and Schneeweis (1983: 1291) interpreted the negative effects of the TMI reactor meltdown on utility companies, as the market anticipating the long-term costs of operating nuclear power plants to increase, due to the possibility of new safety regulations being imposed by the government. Nevertheless, Hill and Schneeweis (1983: 1291) also acknowledged that confounding events, such as the introduction of new environmental
regulations, had an effect on the returns of the utility companies. Since their event window was 25 months long, it is very likely that confounding events affected their results.
In another study, Kalra et al. (1993) examined the effect of the 1986 Chernobyl nuclear accident on stock returns of U.S. utility companies. The accident in Chernobyl was different to the TMI accident in the way that the Soviet government withheld information about the severity of the incident. In their study, they used a sample of 69 companies and split them into three portfolios, based on their nuclear capacity. The portfolios were nuclear, mixed and conventional utility companies. The day the news about Chernobyl first reached the U.S. was recognized as the event day (Kalra et al., 1993: 55f). The results showed that all three portfolios experienced significant negative abnormal returns. However, the abnormal returns of the nuclear and conventional portfolio were relatively small, compared to the abnormal returns of the mixed portfolio. Kalra et al. (1993: 62) argued that this could be explained by the fact that most companies in the mixed portfolio were committed to sizably increasing their nuclear capacity but were still awaiting approval. Hence, there was more uncertainty about the future strategy of these companies, as the Chernobyl accident could influence the probability of the government granting approval.
2.2.3 Event studies on Fukushima
Kowashima and Takeda (2012) applied the event study methodology to the 2011 Fukushima reactor meltdown. In their paper, they investigated the effects of the incident on nine Japanese electric utility companies, which were not directly damaged by the earthquake. That way, they could measure the effect on the market’s assessment of risk and return associated with generating nuclear power in general (Kowashima and Takeda, 2012: 2032). Their results showed that the negative abnormal returns were more significant for companies that owned nuclear power plants than for those that did not. From that, Kowashima and Takeda (2012: 2036) concluded that the market anticipated the costs of operating nuclear power plants to increase, due to possible new regulation. They also measured an increase in systematic and total risk after the Fukushima incident. Based on that, they interpreted that the negative cumulative abnormal returns were not caused by a one-time loss, but rather by a structural change in society and regulation. These results strengthened their first conclusion.
Ferstl et al. (2012) expanded the scope by examining the effects of the Fukushima incident on nuclear and alternative energy stocks worldwide. They conducted an event study on nuclear power and alternative energy providers from France, Germany, Japan and the USA with two event windows. One to determine the immediate effect of the meltdown and another to measure
nuclear energy companies in Germany, France and Japan, while there were no significant returns for U.S. companies. However, the cumulative abnormal returns of German and French companies were only significant at the 10% level. In contrast, the abnormal returns of alternative energy companies were significantly positive for most countries (Ferstl et al., 2012: 30). In the post event window, the cumulative abnormal returns for German nuclear power providers was not significant. Ferstl et al. (2012: 33) explained these findings with the market quickly anticipating new government policies in favour of alternative energy. Furthermore, they found an increase in volatility for stock prices of Japanese nuclear power providers, suggesting that this stemmed from uncertainty of the market regarding new government regulations. Their conclusion coincides with the conclusion drawn by Kawashima and Takeda (2012).
Contrary to the previous two studies, Betzer et al. (2011) looked at how changes in the political climate, following Fukushima, affected German nuclear and renewable energy providers. Their first sample consisted of three nuclear power providers and their second sample of 35 renewable energy companies from a German renewable energy index. They defined the day of the earthquake as the event day and their event window was 22 days long, starting that day (Betzer et al., 2011: 11). Their results revealed significant negative abnormal returns for the nuclear sample on the day of the event. The abnormal returns for renewable energy providers were significantly positive that day. The results of the cumulative abnormal returns showed that almost all information was incorporated into the stock prices on the day of the event, indicating a high market efficiency. Furthermore, the effects were persistent over the event period (Betzer et al., 2011: 12f). Based on that, they concluded that the effects were caused by changes in the political climate after Fukushima (Betzer et al., 2011: 18).
All three studies arrive at the conclusion that the observed abnormal returns experienced by those companies were not caused by the event directly, but rather by the market anticipating new government policies that make operating nuclear power plants costlier. Therefore, this paper will look at the political events that followed Fukushima in more detail, to get a better understanding of the true impact on German nuclear power providers.
3 Methodology
3.1 Statistical methods
The methodology recommended by McWilliams and Siegel (1997) served as the template for this paper’s event study.
3.1.1 Calculations and parametric tests
To estimate the expected returns of the companies in the sample, the market return model (MRM) and the constant mean return model (CMRM) were used. McWilliams and Siegel (1997: 628f) describe that with the MRM, the expected return can be estimated using ordinary least squares parameters α and β, derived from a regression of the rate of return of company 𝑖𝑖 on day 𝑡𝑡 (𝑅𝑅𝑖𝑖𝑖𝑖) on the rate of return of a market portfolio on day 𝑡𝑡 (𝑅𝑅𝑚𝑚𝑖𝑖). The 𝑅𝑅𝑖𝑖𝑖𝑖 can be
calculated as follows:
𝑅𝑅𝑖𝑖𝑖𝑖 = 𝛼𝛼𝑖𝑖 + 𝛽𝛽𝑖𝑖𝑅𝑅𝑚𝑚𝑖𝑖+ ε𝑖𝑖𝑖𝑖
The abnormal return (𝐴𝐴𝑅𝑅) is the difference between the actual return on an event day and the expected return. With the MRM, the 𝐴𝐴𝑅𝑅 of company 𝑖𝑖 on day 𝑡𝑡 (𝐴𝐴𝑅𝑅𝑖𝑖𝑖𝑖) can be calculated the
following way:
𝐴𝐴𝑅𝑅𝑖𝑖𝑖𝑖 = 𝑅𝑅𝑖𝑖𝑖𝑖− (𝛼𝛼𝑖𝑖 + 𝛽𝛽𝑖𝑖𝑅𝑅𝑚𝑚𝑖𝑖)
Alternatively, the 𝐴𝐴𝑅𝑅 can be calculated with CMRM. In that case, the expected return (𝐸𝐸[𝑅𝑅𝑖𝑖])
is the mean of the 𝑅𝑅𝑖𝑖𝑖𝑖 from the estimation window with 𝑇𝑇 days. It can be calculated like this:
𝐸𝐸[𝑅𝑅𝑖𝑖] = 𝑇𝑇 � 𝑅𝑅1 𝑖𝑖𝑖𝑖 𝑇𝑇 𝑖𝑖=1
The 𝐴𝐴𝑅𝑅 of the CMRM is, again, the actual return minus the expected return:
𝐴𝐴𝑅𝑅𝑖𝑖𝑖𝑖 = 𝑅𝑅𝑖𝑖𝑖𝑖− 𝐸𝐸[𝑅𝑅𝑖𝑖]
MacKinlay (1997: 18) argues that the MRM potentially leads to better results than the CMRM, as it reduces the variance of the 𝐴𝐴𝑅𝑅𝑠𝑠 and, therefore, captures more of the effects caused by the
event. The smaller the variance of the 𝐴𝐴𝑅𝑅𝑠𝑠, the more accurate the results. Nevertheless, the results of the CMRM will serve as a comparison to the results of the MRM.
To test the null hypothesis of no abnormal return, 𝐴𝐴𝑅𝑅𝑖𝑖𝑖𝑖 is divided through the standard deviation
(𝑆𝑆𝑆𝑆) of the residuals of company 𝑖𝑖 from the estimation window:
𝑡𝑡𝐴𝐴𝐴𝐴𝑖𝑖𝑖𝑖 = 𝐴𝐴𝑅𝑅𝑖𝑖𝑖𝑖 𝑆𝑆𝑆𝑆𝐴𝐴𝐴𝐴𝑖𝑖 where 𝑆𝑆𝑆𝑆𝐴𝐴𝐴𝐴𝑖𝑖 = � 1 𝑇𝑇 − 2 × �(𝐴𝐴𝑅𝑅𝑖𝑖𝑖𝑖)2 𝑇𝑇 𝑖𝑖=1 � 0,5
The significance level is based on 𝑇𝑇 − 2 degrees of freedom.
The 𝐴𝐴𝑅𝑅𝑠𝑠 from all days in the event window with 𝑘𝑘 days can be summed up, which leads to the cumulative abnormal return (𝐶𝐶𝐴𝐴𝑅𝑅). It aggregates all measured effects of the event on company 𝑖𝑖′𝑠𝑠 stock return and is calculated as follows:
𝐶𝐶𝐴𝐴𝑅𝑅𝑖𝑖 = � 𝐴𝐴𝑅𝑅𝑖𝑖𝑖𝑖 𝑘𝑘 𝑖𝑖=1
The significance of the 𝐶𝐶𝐴𝐴𝑅𝑅𝑖𝑖 can be tested the following way:
𝑡𝑡𝐶𝐶𝐴𝐴𝐴𝐴𝑖𝑖 = 𝐶𝐶𝐴𝐴𝑅𝑅𝑖𝑖 𝑆𝑆𝑆𝑆𝐶𝐶𝐴𝐴𝐴𝐴𝑖𝑖 where 𝑆𝑆𝑆𝑆𝐶𝐶𝐴𝐴𝐴𝐴𝑖𝑖 = �𝑘𝑘 × 𝑆𝑆2𝐴𝐴𝐴𝐴𝑖𝑖�0,5 In this formula, 𝑆𝑆2
𝐴𝐴𝐴𝐴𝑖𝑖 is the variance of the residuals from the estimation window.
Additionally, it makes sense to also calculate the standardized abnormal return (𝑆𝑆𝐴𝐴𝑅𝑅). This method was first introduced by Patell (1976). Through standardization, each abnormal return has the same variance (Serra, 2002: 5). To obtain the 𝑆𝑆𝐴𝐴𝑅𝑅, the 𝐴𝐴𝑅𝑅 is standardize by dividing it though its standard deviation:
𝑆𝑆𝐴𝐴𝑅𝑅𝑖𝑖𝑖𝑖 = 𝐴𝐴𝑅𝑅𝑆𝑆𝑆𝑆𝑖𝑖𝑖𝑖 𝑖𝑖𝑖𝑖 where 𝑆𝑆𝑆𝑆𝑖𝑖𝑖𝑖 = �𝑆𝑆2𝐴𝐴𝐴𝐴𝑖𝑖 × �1 + 1 𝑇𝑇 + (𝑅𝑅𝑚𝑚𝑖𝑖− 𝑅𝑅����)𝑚𝑚 2 � (𝑅𝑅𝑇𝑇𝑖𝑖=1 𝑚𝑚𝑖𝑖− 𝑅𝑅����)𝑚𝑚 2 �� 0,5 Here, 𝑆𝑆2
𝐴𝐴𝐴𝐴𝑖𝑖 is adjusted by the predicted error, where 𝑅𝑅���� is the average return of the market 𝑚𝑚
portfolio in the estimation window. The sum of the 𝑆𝑆𝐴𝐴𝑅𝑅𝑠𝑠 over all event days is called the cumulative standardized abnormal return (𝐶𝐶𝑆𝑆𝐴𝐴𝑅𝑅) and it is calculated like this:
𝐶𝐶𝑆𝑆𝐴𝐴𝑅𝑅𝑖𝑖 = �𝑘𝑘10,5� � 𝑆𝑆𝐴𝐴𝑅𝑅𝑖𝑖𝑖𝑖 𝑘𝑘
𝑖𝑖=1
By dividing the 𝐶𝐶𝑆𝑆𝐴𝐴𝑅𝑅𝑠𝑠 through their standard deviation (𝑆𝑆𝑆𝑆𝐶𝐶𝐶𝐶𝐴𝐴𝐴𝐴), their values are identically
distributed, making them in line with parts of the underlying assumption of independent and identically distributed 𝐴𝐴𝑅𝑅𝑠𝑠. The 𝐶𝐶𝑆𝑆𝐴𝐴𝑅𝑅𝑠𝑠 can then be averaged across the sample. The average standardized cumulative abnormal return (𝐴𝐴𝐶𝐶𝑆𝑆𝐴𝐴𝑅𝑅) on day 𝑡𝑡 for all companies 𝑛𝑛 is calculated the following way:
𝐴𝐴𝐶𝐶𝑆𝑆𝐴𝐴𝑅𝑅𝑖𝑖 =1𝑛𝑛 ×𝑆𝑆𝑆𝑆1 𝐶𝐶𝐶𝐶𝐴𝐴𝐴𝐴� 𝐶𝐶𝑆𝑆𝐴𝐴𝑅𝑅𝑖𝑖𝑖𝑖 𝑛𝑛 𝑖𝑖=1 where 𝑆𝑆𝑆𝑆𝐶𝐶𝐶𝐶𝐴𝐴𝐴𝐴 = �(𝑇𝑇 − 2)(𝑇𝑇 − 4)� 0,5
The 𝐴𝐴𝐶𝐶𝑆𝑆𝐴𝐴𝑅𝑅𝑖𝑖 displays the average effect of the event on the companies in the sample. To test
whether the value for the 𝐴𝐴𝐶𝐶𝑆𝑆𝐴𝐴𝑅𝑅𝑖𝑖 is significantly different from zero, the following test statistic
can be used:
𝑍𝑍𝐴𝐴𝐶𝐶𝐶𝐶𝐴𝐴𝐴𝐴 = 𝐴𝐴𝐶𝐶𝑆𝑆𝐴𝐴𝑅𝑅𝑖𝑖× 𝑛𝑛0,5
there is still the issue of covariance of 𝐴𝐴𝑅𝑅𝑠𝑠 across companies, when the calendar dates of the event window are the same for all companies in the sample (MacKinlay, 1997: 27). To circumvent this issue, the 𝐴𝐴𝑅𝑅𝑠𝑠 will additionally be analysed without aggregation across companies.
3.1.2 Nonparametric tests
According to Serra (2002: 7), parametric tests are not so reliable at testing the null hypothesis of no abnormal return since these tests depend on the assumption of normality. However, abnormal returns are often distributed with fat tails and positively skewed. Nonparametric tests are free of those assumptions regarding the distribution and potentially yield more powerful results. Nevertheless, nonparametric tests are typically only used in combination with parametric tests and serve as a robustness check for the conclusion based on the latter (MacKinley, 1997: 32). In this paper, the generalized sign test and the Corrado rank test were used, based on the template provided by Serra (2002).
The generalized sign test is a binomial test that measures differences between the fraction of non-negative abnormal returns in the estimation and the event window. Under the null hypothesis of no 𝐴𝐴𝑅𝑅, the average fraction of non-negative 𝐴𝐴𝑅𝑅𝑠𝑠 across all firms at the end of the event window (𝑝𝑝0) is not significantly different to the average fraction of non-negative 𝐴𝐴𝑅𝑅𝑠𝑠
from the estimation window (𝑝𝑝̅). The test was conducted as follows:
𝑍𝑍𝐺𝐺𝐶𝐶𝑖𝑖𝐺𝐺𝑛𝑛 =[𝑝𝑝̅(1 − 𝑝𝑝̅)/𝑛𝑛]|𝑝𝑝0− 𝑝𝑝̅| 0,5 where 𝑝𝑝̅ =1𝑛𝑛 �𝑇𝑇 � 𝜑𝜑1 𝑖𝑖𝑖𝑖 𝑇𝑇 𝑖𝑖=1 𝑛𝑛 𝑖𝑖=1
Here, 𝜑𝜑𝑖𝑖𝑖𝑖 is 1 if the abnormal return is positive and 0 if it is negative.
The Corrado rank test measures the significance of the 𝐴𝐴𝑅𝑅𝑠𝑠 from the event period by ranking them alongside the 𝐴𝐴𝑅𝑅𝑠𝑠 from the estimation window. The null hypothesis of no 𝐴𝐴𝑅𝑅 was tested like this: 𝑍𝑍𝐴𝐴𝑅𝑅𝑛𝑛𝑘𝑘 = ∑𝑘𝑘 𝑛𝑛1 𝑖𝑖=1 ∑ (𝐾𝐾𝑛𝑛𝑖𝑖=1 𝑖𝑖𝑖𝑖− 𝐾𝐾�𝑖𝑖) [∑𝑘𝑘 𝑆𝑆2𝐾𝐾� 𝑖𝑖=1 ]0,5
where 𝐾𝐾�𝑖𝑖 = 0,5 +(𝑇𝑇 + 𝑘𝑘)2 and 𝑆𝑆2 𝐾𝐾� = 1𝑛𝑛 �𝑛𝑛12�(𝐾𝐾𝑖𝑖𝑖𝑖− 𝐾𝐾�𝑖𝑖)2 𝑛𝑛 𝑖𝑖=1 𝑇𝑇 𝑖𝑖=1
In this formula, 𝐾𝐾𝑖𝑖𝑖𝑖 is the rank of the abnormal return of company 𝑖𝑖 at time 𝑡𝑡. 𝐾𝐾�𝑖𝑖 is the expected
rank of an abnormal return of company 𝑖𝑖, estimated over a period including the number of days of the estimation window 𝑇𝑇 and the event window 𝑘𝑘.
3.2 Introduction to events
To examine the effects of the Fukushima nuclear meltdown on the German nuclear power industry, an event study with two separate events will be used. One is the disaster itself and the other is a significant political event.
3.2.1 Event 1
The first event is the Fukushima reactor meltdown, which took place on 11 March 2011. The incident itself did not damage any Germany nuclear power providers directly. Nevertheless, it can be argued that it indirectly, negatively impacted the stock returns of German nuclear power providers. For one, it reminded the market about the risks involved when dealing with nuclear technology. Secondly, the market arguably anticipated that the incident would lead to a shift in the political climate, making the operation of nuclear power plants costlier. These theories are backed up by the findings of the studies presented in the previous chapter (Kowashima and Takeda, 2012; Ferstl et al., 2012; Betzer et al., 2011).
The situation in Fukushima was critical from 11 March until 15 March. The event window will be limited to the time span of these days, since new information about the incident was reported most intensely in this period. 11 March is the event day (0) and the event window spans for three days (0, 2). 12 and 13 March are a weekend, which is why they are not included in the event window. Due to the nature of the event, it can be said with absolute certainty that the event was unanticipated and that there was no leakage of information before the event day. Therefore, the event window does not include days before the event day. The estimation window spans a period of 250 days and ends a day before the Fukushima incident (-250, -1). It has to end a day before the event, so that no effects of the event are included in it.
3.2.2 Event 2
The second event is the day Chancellor Merkel announced that all nuclear power plants in Germany were required to shut down indefinitely by 2022. This announcement occurred through a press conference on 30 May 2011 and was somewhat of a turning point, as it sealed the fate of the future of nuclear energy in Germany. Another potential event was 30 June, which was the day the decision was made official in parliament. However, it was deemed ill-suited, because there was little uncertainty around its outcome. The day Chancellor Merkel announced the 3-months long moratorium is another alternative, but its effects are already included in the first event window. For these reasons, the announcement by Chancellor Merkel on 30 May is the second event for this study.
Contrary to event 1, it is difficult to argue that the second event was unanticipated. Ever since the Fukushima disaster, there was an ongoing and open political discussion on the future of nuclear power. With the immediate decision on the moratorium for nuclear power in March, Chancellor Merkel already proved that she had drastically changed her tune towards nuclear power. Therefore, it can be assumed that the decision made on 30 May was somewhat anticipated. However, there was still uncertainty about the severity and timeframe of the implementation, should it come to the decision to shut down all nuclear power plants. For these reasons, the event window around the event day will be covering 2 days before and 2 days after (-2, 0, 2). The estimation window will be the same 250 days as for event 1, so that the confounding effects of the Fukushima disaster do not influence the estimated expected returns.
3.3 Data and variables
Now that the events have been defined, it makes sense to explain on what companies the effects of the events are measured.
3.3.1 Sample selection
The event study for both events will be conducted on two samples. The first sample only includes German nuclear power providers and the second sample consists of other nuclear power providers in the EU. By using these two samples it is possible to see if the effects of the two events were different for German nuclear power providers than for those of other EU countries. This is particularly interesting for the second event, since the political event only directly affected German companies.
The first sample consists of E.ON, RWE and EnBW, since they were the only publicly traded nuclear power providers in Germany at that time. As mentioned in chapter 1.5.3, the Swedish company Vattenfall AB also operated nuclear power plants in Germany at that time, through
its subsidiary Vattenfall Europe. However, neither Vattenfall AB nor Vattenfall Europe were publicly traded at the time of the events, which is why they were excluded from this sample. EnBW was in the process of being acquired by the state of Baden-Wuerttemberg during event 1. As a result, only few shares of EnBW were in free float at that time. For that reason, the effects of event 1 on EnBW are expected to be rather small. For this sample, the DAX 30 was used as the market portfolio for the regression of the MRM.
The second sample consists of all seven remaining nuclear power providers in the EU that were publicly traded at the time of the disaster. This sample includes companies from Spain, France, Finland and the Czech Republic. All other nuclear power providers in the EU were not publicly traded at that time, rendering them unsuitable for this event study. The Euronext 100 was used as the market portfolio for this sample. The list with all the companies in this sample can be found in Table 1 of Appendix E.
3.3.2 Data sources
To conduct this event study, it is necessary to have the daily stock returns of all companies over the estimation and the event windows. The daily stock returns were calculated using the daily closing prices, derived from Thompson Reuters DataStream. The 3-months German Bund was used to calculate the daily excess returns. Its yield was also derived from Thompson Reuters. The market capitalization was calculated with the number of shares outstanding at the end of 2010, found in the annual report of the respective company.
3.3.3 Descriptive statistics
For the German sample, the mean of the ARs from the estimation window is almost 0, with a slightly higher median, for all companies (Table 1 in Appendix A). The standard error of the ARs is lower with the MRM than it is with the CMRM in all cases. Based on that, it can be said that the MRM is the better estimate of the expected return. The average excess kurtosis is very high, particularly for EnBW, meaning there is a high probability of obtaining extreme values. For E.ON and RWE, the ARs are negatively skewed, which means the probability of obtaining extremely negative ARs is higher. For EnBW, the skewness is positive. In the end, it can be said that the ARs of both models are not normally distributed. The distribution of the ARs from the EU sample is similar, yet slightly closer to a normal distribution.
3.4 Hypotheses
Based on the findings of other literature and the reasons given in chapter 3.2.1, it is expected that event 1 had a negative impact on the stock returns of nuclear power providers in Germany and the EU. As was explained in chapter 3.2.2, the effect of event 2 is also expected to be
negative for the German sample. For the EU sample, the effect is expected to be negative as well, since the market could have anticipated the governments of other EU countries to follow the example of Germany, regarding their stance on nuclear power. These hypotheses will be tested on 𝐴𝐴𝑅𝑅𝑠𝑠 and 𝐶𝐶𝐴𝐴𝑅𝑅𝑠𝑠 for companies individually. Then, they will be tested on 𝐴𝐴𝐶𝐶𝑆𝑆𝐴𝐴𝑅𝑅𝑠𝑠 and nonparametric tests for the samples as a whole.
3.5 Confounding events
Both samples contain some companies that are multinational, which would increase the chance of confounding events. However, the length of the event windows is relatively short for both events, which would reduce their likelihood. In this paper, the ARs of companies are eliminated from the sample, for the day of the confounding event. This is one of the methods suggested by Foster (1980) to control for such effects and was used in similar studies, like the one conducted by Ferstl et al. (2012). The recognized confounding events will be presented in chapter 4.5.3.
4 Results
In this chapter, the results of each sample will be presented and compared to the findings of similar studies. Then, the results will be rationalized.
4.1 Event 1
4.1.1 German sample
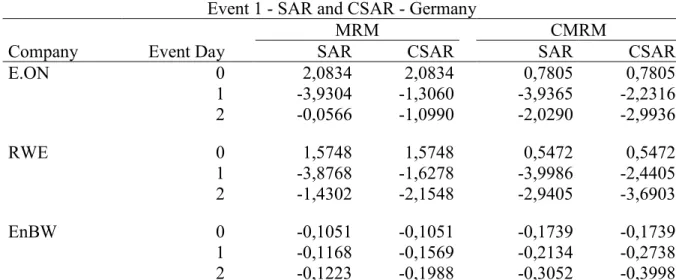
The abnormal returns and cumulative abnormal returns experienced by E.ON, RWE and EnBW during the Fukushima reactor meltdown will now be presented. On the event day, the ARs with the MRM for E.ON and RWE are positive and even significant at the 5% level for E.ON (Table 1.1 in Appendix B). Only the AR of EnBW is negative, yet insignificant. These results come at a surprise, as it was expected the ARs would be negative for all three companies on the day of the event. On day 1, the ARs for E.ON and RWE are negative and highly significant, being -3,93% and -3,62% respectively. For both companies the null hypothesis of no abnormal return can be rejected at the 1% level. On day 2 the ARs of all three companies is negative, yet not significant. At the end of event 1, the CAR is negative for all three companies. However, only the CAR of RWE (-3,51%) rejects the null hypothesis of no cumulative abnormal return at the 5% level.
The results of the CMRM show a much more significant impact of event 1 on the three German companies. Although, the ARs for E.ON and RWE are again positive on the day of the event, they are far smaller and not significant. On day 1 and 2, the ARs of both companies are negative and highly significant. Especially on day 1, the ARs of E.ON (-5,35%) and RWE (-4,77%) reject the null hypothesis at the 1% level. For EnBW, the ARs and CARs are negative on all
event days, but, again, the values are not significant. On day 2, E.ON and RWE have a CAR of -7,09% and -7,67%, rejecting the null hypothesis at the 1% level.
For both the MRM and the CMRM, the results of the SARs and CSARs are very similar to the T-statistics of the ARs and CARs (Table 1.2 in Appendix B). For instance, with the MRM the SAR of E.ON on day 1 is -3,93, while the T-statistic of the AR that day is -3,96. The fact that these values are so similar makes sense, since the SAR is calculated by standardizing the AR by its standard deviation, which is exactly how the T-statistic is calculated. The only difference is that for the SAR the standard error is adjusted by the predicted error. That adjustment explains the slight difference between the results. The fact that the difference is so small, strengthens the validity of the test results for the ARs and CARs, as there seem to be only small discrepancies between the standard error and the adjusted standard error.
The ACSAR of the MRM is -1,15 and rejects the null hypothesis of the event having no effect on the sample at the 5% level (Table 4.1). For the CMRM, the ACSAR on day 2 is -2,35 and significant at the 1% level. These results show that event 1 had a significant negative impact on German nuclear power providers. These results are consistent across both models.
Event 1 - Average Cumulative Standardized Abnormal Return - Germany
MRM CMRM
Sample Event Day ACSAR Z ACSAR Z Germany 0 1,1796 2,0431 0,3831 0,6635 1 -1,0261 -1,7772 -1,6420 -2,8440 2 -1,1462 -1,9853 -2,3517 -4,0733
Table 4.1: This table shows the average cumulative standardized abnormal return of the German sample during the Fukushima reactor meltdown, calculated with the MRM and the CMRM.
Lastly, to test the robustness of the parametric test results, it makes sense to also look at the nonparametric test results (Table 1.3 in Appendix B). The significance values of the generalized sign test reveal that the fraction of positive ARs during event 1 is not significantly different to the fraction estimated over the event window for both the MRM and CMRM. Hence, they fail to reject the null hypothesis. This could be explained by the two positive ARs on day 0 in conjunction with the small sample size. The rank test reveals a significance value of 1,13 with the MRM and a value of 2,27 with the CMRM. Accordingly, the null hypothesis of no abnormal return can only be rejected for the CMRM. The results of the MRM are not consistent across parametric and nonparametric tests.
Based on the test results of both models for ARs, CARs and ACSAR, as well as the partially consistent results between parametric and nonparametric tests, it can be concluded that the Fukushima nuclear reactor meltdown had a negative financial impact on the stock returns of German nuclear power providers.
4.1.2 EU sample
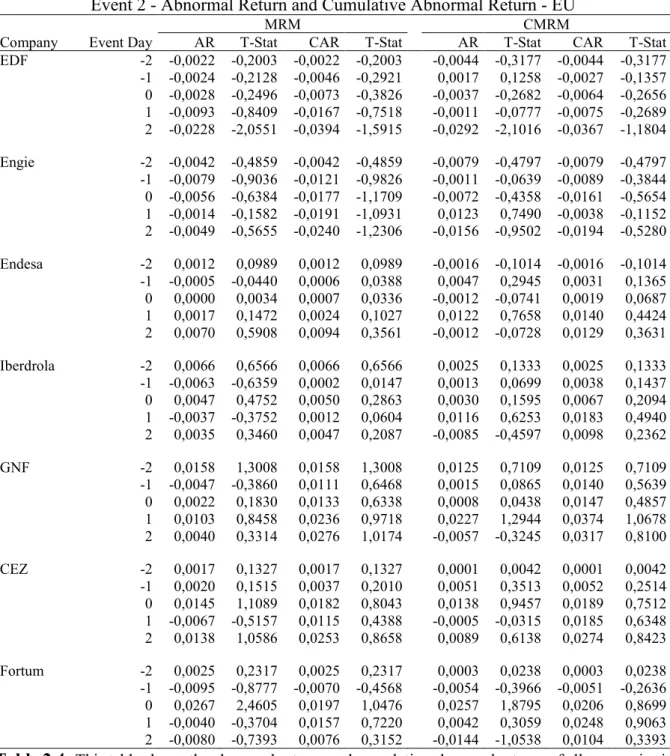
EDF, Iberdrola, GNF and Fortum are the only companies from the EU sample with significant abnormal returns on any of the event days with the MRM (Table 1.4 in Appendix B). With -4,58% on day 1, EDF experiences the most significant AR of the sample, which rejects the null hypothesis at the 1% level. GNF also has a highly significant positive AR that day with +3,86%. EDF, Iberdrola and GNF have the only significant CARs of the sample, being -5,10%, +3,48% and +5,74% respectively. They reject the null hypothesis at the 1% level, although, in different directions.
The results of the CMRM show a similar pattern, with Fortum having the only significant AR (-2,66%) on the event day. The AR of EDF (-5,38%) on day 1 is, again, the most significant AR of the entire sample. EDF (-8,11%) and Endesa (-5,71%) are the only companies with significant CARs at the end of the period. They reject the null hypothesis at the 1% and 5% level respectively. Similar to the results of the German sample, the effects of event 1 seem to be more negative with the CMRM than with the MRM.
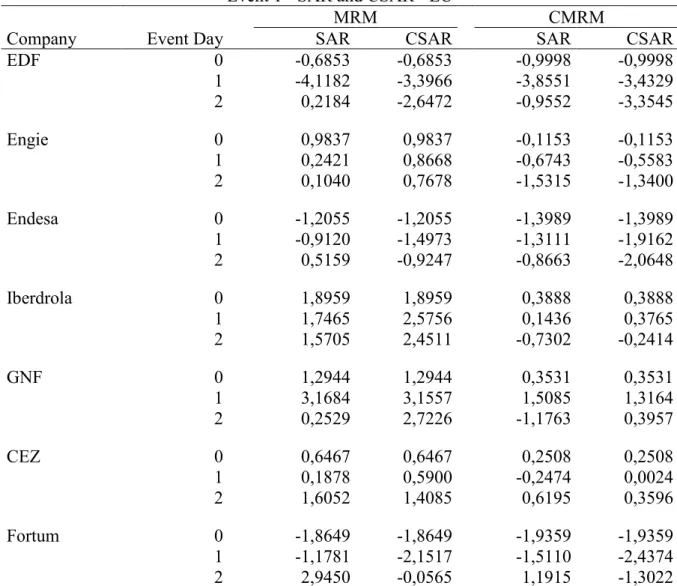
The values of the SARs and CSARs for this sample are very similar to the T-statistics of the ARs and CARS (Table 1.5 in Appendix B). Hence, the same conclusion can be drawn as for the German sample. The difference between the standard error and the adjusted standard error seems to be very small, strengthening the validity of the test results of the ARs and CARs. With the MRM, the ACSAR of the EU sample is only 0,53 and not significant (Table 4.2). For the CMRM, on the other hand, the ACSAR is -1,07 and it rejects the null hypothesis at the 1% level. Based on the results of the CMRM, it can be said that event 1 had a negative impact on nuclear power providers in the EU.
Event 1 - Average Cumulative Standardized Abnormal Return - EU
MRM CMRM
Sample Event Day ACSAR Z ACSAR Z EU 0 0,1515 0,4009 -0,4919 -1,3014 1 -0,4039 -0,9893 -1,1663 -2,8568 2 0,5295 1,4010 -1,0739 -2,8412
Table 4.2: This table shows the average cumulative standardized abnormal return of the EU sample during the Fukushima reactor meltdown, calculated with the MRM and the CMRM.
The results of the generalized sign test show that the fraction of positive ARs is not significantly different between the event and the estimation window for both the MRM and CMRM (Table 1.6 in Appendix B). The values for the rank test show that the ARs of the EU sample are only significant in the CMRM (2,47), where it rejects the null hypothesis at the 5% level. These results are consistent with the results of the ACSAR and support the argument that the effects of event 1 seem to be more negative with the CMRM than with the MRM.
Based on the results of the CMRM for ARs, CARs and ACSAR, which are mostly consistent across parametric and nonparametric tests, it can be argued that the Fukushima incident had a negative impact on the stock returns of nuclear power providers in the EU. This conclusion is only valid, if the assumption is made that the CMRM is better suited to measure the abnormal returns for this event.
4.2 Event 2
4.2.1 German sample
The results of the MRM show that E.ON and RWE have ARs of -2,18% and -1,56% on the day of Chancellor Merkel’s announcement (Table 2.1 in Appendix B). They reject the null hypothesis at the 5% and 10% level, respectively. On none of the other days in the event window, does either one of the three companies have significant ARs. Furthermore, the CAR of E.ON (-3,70%) is the only CAR that is significant in the German sample.
With the CMRM, the ARs across the sample are even less significant than with the MRM. The only AR that is significant at the 10% level is the AR of E.ON (-2,27%) on day 0. Although the CARs of all three companies are negative at the end of the event period, they fail to reject the null hypothesis of no cumulative abnormal return.
As it was the case with event 1, the values of the SARs and CSARs are, again, only slightly different to the T-statistics of the ARs and CARs for both the MRM and CMRM (Table 2.2 in Appendix B).
The ACSAR of the German sample is negative and significant for both models (Table 4.3). The ACSAR of the MRM is -1,31 and rejects the null hypothesis at the 5% level. For the CMRM, the ACSAR of -1,00 is slightly lower and only significant at the 10% level. These results come at a surprise, since the CARs for most companies in the sample were not significant for both models. This could be explained by the fact that with the ACSAR, the values of the CSARs are standardized to make them identically distributed. That is one of the underlying assumptions
when analysing ARs. Therefore, it can be argued that the ACSAR produces more accurate results than the conventional CAR.
Event 2 - Average Cumulative Standardized Abnormal Return - Germany
MRM CMRM
Sample Event Day ACSAR Z ACSAR Z Germany -2 -0,0675 -0,1168 -0,4071 -0,7051 -1 -0,6321 -1,0949 -0,6460 -1,1190 0 -1,0534 -1,8245 -0,9100 -1,5762 1 -1,0578 -1,8321 -0,5307 -0,9192 2 -1,3090 -2,2672 -1,0023 -1,7360
Table 4.3: This table shows the average cumulative standardized abnormal return of the German sample during Merkel’s announcement, calculated with the MRM and the CMRM.
The nonparametric tests also offer split results (Table 2.3 in Appendix B). The significance values of the generalized sign test for the MRM (1,29) and CMRM (0,59) show that the null hypothesis of equal fractions of ARs in the event and estimation window cannot be rejected. The rank test yields values of 3,29 for the MRM and 2,30 for the CMRM, which means that the null hypothesis of no abnormal return can be rejected at the 1% and 5% level, respectively. These results strengthen the inference that can be drawn from the ACSAR values, since they are not based on the same distribution assumptions.
In the end, the highly significant negative ACSARs and consistency across the rank test, as well as the significant negative ARs for E.ON and RWE on the day of the event, support the following conclusion. The announcement of Chancellor Merkel had a negative financial impact on the stock returns of German nuclear power providers.
4.2.2 EU sample
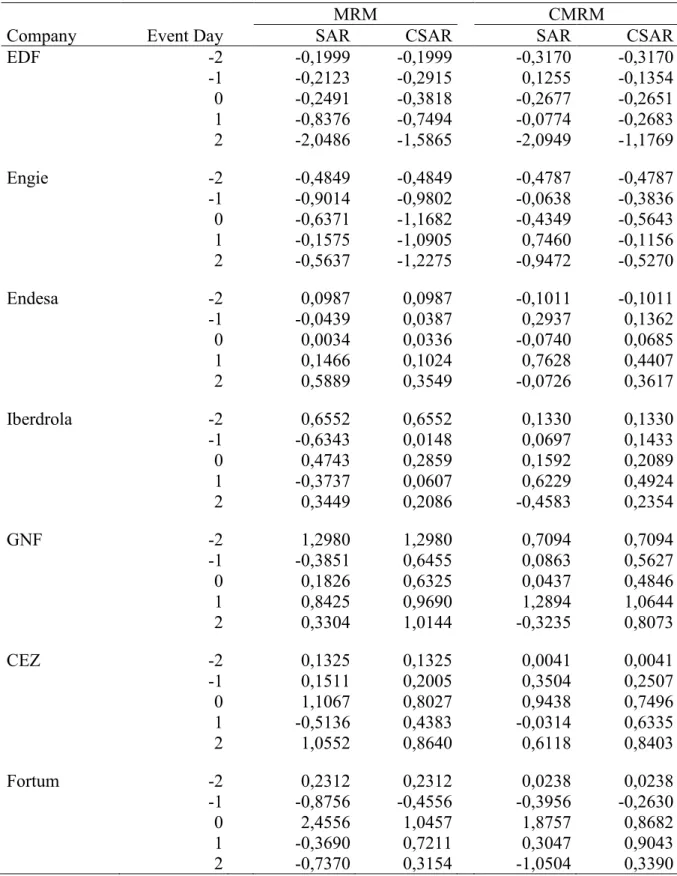
For the EU sample, the only significant ARs occur with the MRM on day 0 for Fortum (+2,67%) and on day 2 for EDF (-2,28%) (Table 2.4 Appendix B). Both ARs reject the null hypothesis at the 5% level. Particularly, in the case of EDF there is doubt whether or not this AR is connected to the event in question, since there are not even remotely significant ARs on day 0 or day 1. The CARs of all companies in the sample fail to reject the null hypothesis, even at the 10% level.
The results of the CMRM are consistent with the results of the MRM. The only significant ARs are experienced by EDF and Fortum on the same days, although slightly less significant for Fortum. The CARs of all companies in the sample are, again, not significant.
The SARs and CSARs are also similar to the T-statistics of the ARs and CARs (Table 2.5 in Appendix B). These results are consistent with the similarities found for the German sample. The ACSARs of the EU sample are -0,01 for the MRM and 0,13 for the CMRM, which means that the values are not significant (Table 4.4). These results are consistent with the results of the CARs and support the argument that event 2 had no impact on nuclear power providers in the EU.
Event 2 - Average Cumulative Standardized Abnormal Return - EU
MRM CMRM
Sample Event Day ACSAR Z ACSAR Z EU -2 0,2463 0,6515 -0,0038 -0,0100 -1 -0,1178 -0,3116 0,0442 0,1171 0 0,1779 0,4707 0,2206 0,5837 1 0,0643 0,1700 0,4484 1,1863 2 -0,0081 -0,0213 0,1252 0,3312
Table 4.4: This table shows the average cumulative standardized abnormal return of the EU sample during Merkel’s announcement, calculated with the MRM and the CMRM.
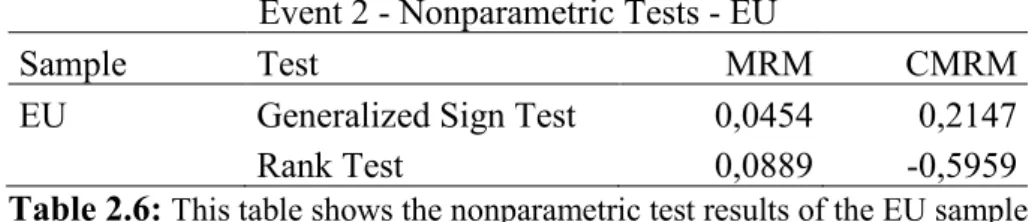
The nonparametric tests show similar results (Table 2.6 in Appendix B). The significance values of the generalized sign test are not significant for the MRM (0,05) and CMRM (0,21). The values of rank test also fail to reject the null hypothesis.
Based on the results of the ARs, CARs, ACSARs and nonparametric tests, it can be concluded that the announcement of Chancellor Merkel had no impact on the stock returns of other nuclear power providers in the EU.
4.3 Extended event period
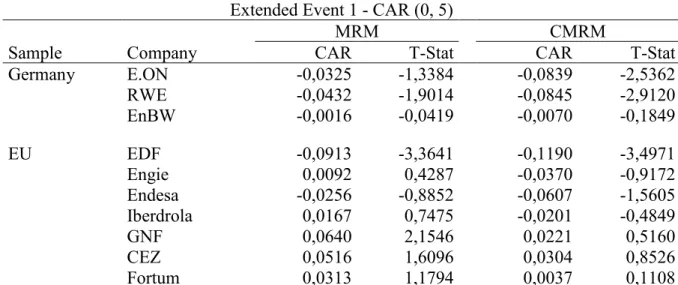
This chapter shows how the results hold up under longer event windows. The event window of event 1 was increased to six days (0, 5), so that it covers the entire week after the Fukushima incident. The situation in Fukushima was most critical until 15 March. However, it is possible that the market reacted to new information beyond that date. The period of event 2 was increased to eight days (-5, 0, 2), so that it covers the entire week leading up to Chancellor Merkel’s announcement. That way, more effects related to anticipation can be included. The goal is to see if the significance of the CARs increases, as they potentially capture more of the effects associated with the events.
In the German sample for event 1, the distribution of significant CARs with the MRM and CMRM is the same as in the shorter event window (Table 1 in Appendix C). However, the
significance values are lower in almost all cases, although the CARs of E.ON (-8,39%) and RWE (-8,45%) are slightly higher with the CMRM. The significance values are lower, because the significance is tested over a longer period of time and the magnitude of the CARs only increased slightly. For the EU sample, the CAR of EDF is actually much more significant with the longer event period, while the CAR of Iberdrola is no longer significant. The CARs of most other companies are slightly more significant, but they remain below the 10% level. The significance of the ACSAR from the extended event period is lower for both samples, than it is with the shorter period (Table 2 in Appendix C). Based on these results, it is fair to say that the shorter event period more accurately captures the effects of the Fukushima reactor meltdown for both samples. Although, for some individual companies, like EDF, the extended event period produces more significant results.
The CARs off all companies in the German sample are less significant in the extended period of event 2 (Table 3 in Appendix C). The CAR of E.ON, which was significant at the 10% level in the shorter event period, is no longer significant at that level with the MRM. The CARs of all companies in the EU sample remain not significant in the extended event period. The ACSARs for the German sample are no longer significant, as opposed to the ACSARs of the shorter event period (Table 4 in Appendix C). The ACSARs of the EU sample remain not significant. Based on these results, it can be argued that including the full week before Chancellor Merkel’s announcement, does not capture the effects of event 2 more accurately. In the case of the German sample, it would even lead to the conclusion that Merkel’s announcement has no effect on German nuclear power providers. With the exception of EnBW, there was arguably enough liquidity in the stock of these European utility companies to claim that the market reacted efficiently to the new information. For that reason and the more significant test results, it was concluded that the original event windows for event 1 and 2 are better suited to capture the effect of the events.
4.4 Comparison to other studies
Chapter 2.2.3 introduced two event studies similar to the one of this paper. The one by Betzer et al. (2011: 24) used a sample of German nuclear power providers consisting of E.ON, RWE and EnBW. The one by Ferstl et al. (2012: 32) only included E.ON and RWE in their German sample. Both studies found that the ARs of their sample companies were positive on the day of the earthquake (11 March). On the following trading day (14 March), they both noted highly significant negative ARs. On 15 March, they also found negative ARs for their samples, but less significant. These findings are consistent with the results of the MRM used in this paper. However, the results of the CMRM are slightly different since they show significant negative
ARs for 15 March as well. Betzer et al. also used the MRM and Ferstl et al. used the Fama and French’s three-factor model, which would explain why their findings are more similar to the results of the MRM from this study.
The results for event 2 cannot be compared to other literature, since there are no other event studies conducted on that event.
4.5 Validation
Before the results can be analysed, it is necessary to see if the three assumptions presented in chapter 2.1.3 are true. The assumptions, formulated by McWilliams and Siegel (1997), were that markets are efficient, the event unanticipated and there are no confounding events during the event period.
4.5.1 Market efficiency
As explained in chapter 2.1.1, the effect of an event is not expected to persist for long after the event took place if the market is deemed efficient. To test this, the ARs of event 1 and event 2 were observed over a 10-day period after the event. This test was exclusively conducted on the German sample with the ARs of the MRM, as the German market is the focus of this thesis. For event 1, there are no significant ARs for any of the three companies beyond day 1 (Table 1 in Appendix D). Hence, it can be concluded that the market was quick to factor in the information of the Fukushima reactor meltdown in the company’s stock price. Figure 4.1 illustrates the market’s quick reaction. The only inefficiency of note is the fact that the market did not seem to react to the information on the day of the event. This will be further discussed in chapter 5.1.
The only significant ARs immediately surrounding event 2 occur on the day of the event (Table 2 in Appendix D). Four to six days after the event, all companies also experience significant ARs. However, these can be explained by other events that are only partially related to event 2. For instance, day 6 was the day after the cabinet passed the decision announced by Chancellor Merkel on day 0. The market potentially reacted to the decision being set in stone. Whether that is the market reacting inefficiently or reacting to new information can be argued either way.
Figure 4.1: This figure shows the cumulative abnormal returns of E.ON, RWE and EnBW over a period starting 10 days before and ending 10 days after the day of the earthquake in Japan.
Figure 4.2: This figure shows the cumulative abnormal returns of E.ON, RWE and EnBW over a period starting 10 days before and ending 10 days after the day of Merkel’s announcement.