1 A Work Project, presented as part of the requirements for the Award of a Master Degree in
Management from the NOVA – School of Business and Economics.
THE OPTIMIZATION OF THE LOGISTICS CHAIN AT JERÓNIMO MARTINS: THE CENTRALIZATION DECISION
ANDREIA REGINA DE SOUSA RAMOS NOGUEIRA
STUDENT NUMBER #2004
A project carried out on the Masters in Management Program at Jerónimo Martins, under the supervision of:
Professor José Crespo de Carvalho and Dr. Olev Milhazes Pinto
2 Abstract
This work project results from a challenge proposed by Jerónimo Martins, the largest food distribution group in Portugal, which consists in developing a simulator to support the centralization decision in Recheio, a cash & carry chain. A quantitative analysis was performed to understand the dispersion of purchasing volume by region and centralization degree. The simulator designed intends to acknowledge the impact of a specific decision on three dimensions: economic, environmental and social. The economic costs, CO2 emissions and stock-out probabilities, are presented for both centralized and decentralized scenarios. In the end, this project aims to optimize the company’s logistics chain.
Keywords: centralization, simulator, logistics, decision.
Acknowledgements
I would like to thank Professor José Crespo de Carvalho for the availability, wisdom and for giving me the opportunity of guiding me. I am very grateful to Dr. Olev Pinto, Dr. Ana Novais, Eng. Pedro Ramalho and all the Logistics and Supply Chain team, for the support, mentoring and availability, as well as for allowing me to having this incredible experience of getting to know more about Jerónimo Martins.
A special thanks to Alexandra Nogueira and Diogo Fortunato for being a strong pillar of motivation and for supporting and encouraging me, unconditionally, throughout this path.
3 Index Abstract ... 2 Acknowledgements ... 2 Index ... 3 Introduction ... 4 Literature Review ... 5 Methodology ... 9 Data Collection ... 10 Data Analysis ... 10
The Simulator Creation ... 13
Quality Testing ... 18
The Purchasing’s Dispersion of Recheio ... 19
Global Analysis ... 19
Regional Analysis ... 20
Exclusive SKUs and Suppliers Analysis ... 22
The Centralization Decision: Creation of the Simulator ... 23
Conclusion ... 24
References ... 26
4 Introduction
The food distribution company, Jerónimo Martins (JM), operates in three distinct areas: manufacturing, services and distribution. Contrary to manufacturing and services, the distribution activity is dispersed across three countries in two continents, Portugal (Pingo Doce and Recheio) and Poland (Biedronka) in Europe, and Colombia (Ara) in South America. In the food distribution sector, the group has 3.249 stores and a sales volume of 13.568 million euros (31st December, 2015) distributed as follows: 2.667 Biedronka’s stores (9.206 million euros), 399 Pingo Doce’s stores (3.407 million euros), 41 Recheio’s stores (832 million euros) and 142 Ara’s stores (122 million euros). In Portugal, the two formats should be distinguished, while Pingo Doce is a leading supermarket chain, which sells to final customers, Recheio, is leader in the cash & carry segment, where the customers are companies that belong to the traditional retail or the HoReCa channel. The company was facing challenges in respect to the centralization decision, mainly in the Recheio’s universe. The reason behind it, resides on the fact that it is targeted to a business-to-business channel, which implies higher purchasing volumes and an increased responsibility to avoid stock-outs. This concern stems from the impact of stock-outs on the relationships between the company and its customers, but also with the customers of Recheio’s customers. Given this, it was proposed the creation of a simulator that would provide some indicators to support the decision-making of whether a supplier or a Stock Keeping Unit (SKU) should be centralized or not. These indicators provide not only an economic perspective, but also a social and environmental one. In addition, a complementary analysis of the distribution of purchasing volume and number of SKUs per region (south, centre and north) and degree of centralization was performed to understand the Recheio’s market and its dispersion.
5 This work project is structured as follows. The first section reviews the academic literature for the main topics discussed in this study. The second section presents the methodology to be followed, including data collection, data analysis methods, the simulator creation and quality testing. Following this, in the third section, it is performed an analysis of the purchasing volume’s dispersion of Recheio’s stores. Additionally, in the fourth section it is presented the choice of variables to integrate the simulator (inputs) that will produce certain decision variables as outputs. Finally, the last section presents the major conclusions and some limitations found during the study. Literature Review
This section, presents the review of relevant literature for the research conducted in this study. Logistics, firstly used in the military activity during the 18th and 19th centuries (Carvalho, 2012), represents a part of the supply chain process (between consumption point and suppliers), which comprise several activities, such as procurement, warehouse and transportation. These activities are responsible for the planning and implementation of consumer goods’ storage and circulation in the most efficient and effective approach (Hesse & Rodrigue, 2004; CSCMP, 2016).
In the food retail sector, the importance of the logistics chain’s optimization is crucial resultant from the continuous increase of costs and market competition, while retailers struggle to achieve growth both in volume and profits. However, there are several challenges which constantly lead to a higher complexity of the structure, for instance, geographic dispersion, environmental awareness (including environmentally friendly products) and transportation concerns, such as unstable energy prices and traffic flows, especially near urban areas (Seidel, Blanquart, & Ehrler, 2016).
According to the European Commission (2015), the logistics costs’ components are transportation (which represents 44% of the logistics volume in the Europe of 28 in 2012), warehousing (24%),
6 capital costs (22%), order processing (6%) and administration (4%). The importance of transportation in the cost structure is corroborated by Kumar and Shirisha (2014), which argue that this is due to the transversal presence of transportation, beginning with deliveries from the manufacturing companies to warehouses, and then to final customers, or directly to them without any intermediary. In turn, the warehouse operation consists in the location of the stored goods between the origin and consumption point (Lambert, Cooper & Pagh, 1998; Stefansson, 2006). The success of this operation, depends mostly on the order picking activity, which is very demanding since it is manually executed (De Koster, Le-Duc, & Roodbergen, 2007). This is more evident in the food retail sector, in which the pallets are composed by several items and, although each item has low volumes, the deliveries occur frequently (Gebennini, Grassi, Rimini, & Depietri, 2013). Regarding the two main logistics’ activities, transportation and warehousing, it is possible to segregate the different parcels of its costs (European Commission, 2015). On the one hand, concerning road transportation, the main parcels considered are personnel, fuel, interests, leasing and depreciation, taxes and insurances, administration and other variable costs. On the other hand, the most important components of the warehousing costs are personnel, storage equipment, real estate, energy and other costs.
Nevertheless, it should be highlighted that when looking for alternative and continuous improvements in terms of cost, time and quality (Guedes, 2012), it has become crucial embracing optimization objectives for the whole supply chain, particularly when the operations are extensive, complex and impacted by demand uncertainty (Shapiro & Wagner, 2009; Garcia & You, 2015). Considering this, a new concept emerged during the 1990’s, Supply Chain Management, defined as the planning and management of the upstream and downstream activities, such as production and procurement, but also activities related to logistics (including transportation and warehousing).
7 The collaboration between different party providers is managed through three types of flows, the flow of information, materials and finance, which share a common optimization objective, to satisfy customers’ needs (Mentzer et al., 2001; Garcia & You, 2015; CSCMP, 2016). Moreover, Garcia and You (2004) defend in a supply chain’s design, the inclusion of the environmental and social’s spheres, in addition to the economic one.
When analyzing the environmental issues, exclusively in relation to the logistics operations, a specific concept emerged in the 1990s, the green logistics (Ubeda, Arcelus, & Faulin, 2011), which was also driven by the introduction of new regulations and the active consumers’ interest (Srivastava, 2007). According to the European Commission (2016), the road transportation activity was responsible, 2012, for 20% of the total emissions of carbon dioxide (CO2) in the European Union. About one fourth of this value, represents the share of truck and buses, for either goods or passengers transportation. There are some developments in the fleet management that can reduce the impact on the environment, such as the introduction of backhauling, which consists in a return trip of a vehicle from its delivery point to the origin point with load (Audy et al., 2012), allowing also to reduce deadheading (return trip without any load) (Juan et al., 2014). This leads to some savings, since the utilization rate and fleet efficiency are increased. Alternative solutions are the optimization of the delivery routes in terms of planning, and the creation of training sessions concerning ECO-driving (Kohn & Brodin, 2008). Some of these fleet management’s developments can be achieved through vertical collaboration and centralization, as discussed below.
The vertical collaboration concept consists in a complex relationship, with two or more entities, due to divergent interests and different bargaining power, which can be done through subcontracting or outsourcing (Harvey, 1989; Hesse & Rodrigue, 2004). In order to be attractive to the partners, the benefits of being in the partnership should surpass those of operating
8 independently (Subramani, 2004; Bagchi et al., 2005; Audy et al., 2012). For the logistics operation, it is essential that all parties involved commit themselves, communicate and exchange information frequently (Barratt & Oliveira, 2001; House & Stank, 2001; Barratt, 2004), as well as, trust one another to achieve shared goals, especially in relation to critical variables, such as delivery time, service quality and cost (Ryu, So, & Koo, 2009). The partners should also have organizational compatibility, and complementary resources, contributing towards a common vision. This type of collaboration across the whole supply chain offers considerable benefits, such as the increase of productivity, since each partner is responsible for the activities (warehouse, transportation or even distribution) in which is specialized (Kumar & Shirisha, 2014). Additionally, it allows to improve the service level, reduce the bullwhip effect (Lee, Padmanabhan, & Whang, 1997), but also the possibility of adjusting inventories and avoiding stock-outs (Hesse & Rodrigue, 2004). In the end, common objectives, trust, communication and partners’ exclusivity (reduced number but strategically relevant) are the main pillars of a collaboration.
Finally, the decision of introducing the centralization effect, a topic with increasing interest among researchers (Gebennini et al., 2013), should take into account the advantages and disadvantages for the supply chain activities. Centralization can offer some interesting possibilities, as the consolidation of loads, which lead to the increase of the utilization rate, decrease of overall fuel consumption and travelled distance and a lower cost per unit transported, reducing the CO2 emissions (Gross, Hayden, & Butz, 2012). The centralization of inventory and transportation can also provide a higher service level, although at the expense of a potential rise in transportation costs, and the opportunity of holding a wider product portfolio in stock (Das & Tyagi, 1997; Kohn & Brodin, 2008).
9 Das and Tyagi (1997) also make reference to benefits of centralization and decentralization, suggested by Patton (1986). If, on the one hand, the centralization can improve inventory management and safety stock (Sparks, 1986; Gross, Hayden, & Butz, 2012) and allow better transportation negotiation schemes, on the other hand, Patton (1986) mentions that decentralization can bring more benefits to the customer, by providing a better and more rapidly customer service. However, decentralization can compromise somehow the operation due to the increased number of vehicles arriving the consumption point, as well as, the need of personnel presence and higher administrative costs to handle the deliveries (Sparks, 1986). The expected increase of fixed costs, namely capital costs, can also compromise the viability of the decentralization decision, since there is an increase of stocks locally (Abrahamsson, 1993; Gross, Hayden, & Butz, 2012).
Methodology
In this section, it follows a thorough explanation of the methodology applied throughout this study. The research approach considered appropriate is a case study research strategy, given the exploratory nature of the project (Eisenhardt, 1989). This strategy is considered very suitable when researching in the early phases of a topic, in this case, the need of creating a tool to decide whether a supplier or SKU should be centralized or decentralized. Additionally, Yin (2009) defends the usefulness of a case study approach when the research question is focused on a “How” or a “Why”, the control over behavioral events by the investigator is residual or none and, finally, it is focused on contemporary events rather than historical ones.
Following this, the research question was defined, as being How the creation of a simulator supports the Centralization decision?, and complemented with three sub-questions: How the
10 economic costs impact the decision?, How the CO2 emissions impact the decision? and How the stock-out probability impacts the decision?.
Data Collection
The process of collecting data started with a qualitative approach, the participant-observation (Saunders, Lewis, & Thornhill, 2009; Yin, 2009), in which the identity of the researcher is known, and not only observes, but also participates in the different activities. This field observation obtained through an internship, provided insightful information about the culture and operations of JM, each process and procedure, and at the same time, the relationships between the supply chain partners (suppliers, carriers and JM, the latter includes warehouses and stores).
The participant-observation approach was complemented with unstructured and semi-structured interviews, aligned with the exploratory nature of the study (Saunders, Lewis, & Thornhill, 2009; Yin, 2009) and field notes (Eisenhardt, 1989). These interviews allow to understand the dimension of the population to be studied, in this case, whether the analysis should be restricted to Recheio’s stores or include a specific group of Pingo Doce’s stores. This approach enabled the collection of information regarding processes and methods already established to clearly define which quantitative data should be analyzed and also integrated in the simulator. Lastly, it raised the necessity of including assumptions to constraint the collection of quantitative data, such as the exclusion of perishable products. These are considered critical products which require specific conditions concerning warehousing or transportation, due to the existence of expiration dates. Data Analysis
As mentioned before, it was adopted a quantitative approach, which consisted in collecting data from JM’s databases regarding purchasing volumes from Pingo Doce’s stores and Recheio’s stores.
11 The following variables respect to 2015: store, range of SKUs, area, division (sub-class of area), suppliers, and volume of SKUs transacted monthly (from January to December). The data collected about purchasing volume was divided into direct acquisition to supplier and through JM’s warehouses, for the 37 Recheio’ stores (located in Portugal, excluding islands) and 9 Pingo Doce hipers (only type of store allowing direct purchasing). Initially, it was clear the need of data cleaning, by removing the SKUs without any purchases and the ones related with marketing activities. When analyzing the purchasing volume, it was indispensable to aggregate the volume per store of SKUs to a unique SKU code. Hereinafter, were created new variables such as SKUs’ volume per supplier, number of stores (with product acquisition), and finally, was performed an ABC analysis by SKU. This analysis consisted in a categorization technique, where the “A” SKUs account for 75% of the annual volume of purchases, the “B” for 20% and the “C” for the remaining 5%, which were assigned through a VBA code in Microsoft Excel.
The following analysis, consisted in considering for each supplier, the number of articles, the correspondent volume, the average number of stores which bought the product. Moreover, it was also conducted an ABC analysis focused on the suppliers, by following the abovementioned procedure, applicable to both centralized and decentralized purchases. However, the former requires an intermediate step, which was the attribution to each SKU of the correspondent suppliers, according to the warehouse’s receptions.
Some interviewees, experts in these matters, highlighted the importance of a specific store in Braga, since its purchasing volume is considerably higher than the average. According to this, both analyses mentioned above were segmented: all Recheio’s stores, all Recheio’s stores without Braga’s store and Pingo Doce’s hipers. The main conclusions led to the decision of performing a single-store analysis, Braga’s store, to understand if the presence of this store would bias or not the
12 results achieved for all Recheio’s universe. It was also determined that the Pingo Doce’s stores should not enter the domain of the study, since the discrepancy between centralized and decentralized purchasing was enormous. This decision was possible due to the exploratory nature of the study, allowing a flexible data collection along with the possibility of making some modifications during this period (Eisenhardt, 1989).
Considering this, an analysis to the purchasing volume (centralized and decentralized) of Braga’s store was executed with the introduction of new variables: % Braga’s volume in total, segregation of number of stores per regions (according to the logistics regions where the store belongs), regional product, unique-store product and country’s (or regional) dispersion index. In relation to the suppliers’ analysis, the variables added were the quantity of products sold on that region (north) and the quantity of products sold on that specific store (Braga) by the correspondent supplier. In conclusion, it was decided to do an aggregation of centralized and decentralized purchasing volumes through the categorization of SKUs, in which “C” represents the centralized SKUs, “D” the decentralized and “CD” represents items that were both centralized and decentralized. As a result, it was decided that Braga’s store should integrate the population selected for the study. By introducing the variables regional product, unique-store product and country’s dispersion, it was imperative to segment the analysis by region (south, centre and north), which include the stores supplied by the warehouses of the respective region. This analysis supported the succeeding one, the objective was to understand which SKUs should be transferred from centralized to decentralized, and vice-versa. In the first case, it should be selected the SKUs to be transferred out of the warehouse to be directly delivered from the supplier to the stores. According to this, the ABC analysis took a crucial role, since the selected products were previously categorized as “C” (low volume of purchasing) and also restricted in terms of dispersion indicators. The dispersion
13 indexes taken into consideration were the regional dispersion and temporal dispersion, in which the regional one should be lower than 80% (based on researcher sensitivity) and the temporal inferior to 75% (9 out of 12 months). In what concerns to the potential centralization of current decentralized SKUs, the selected ones were categorized as “A” and “B” (higher volume of purchasing), with a regional dispersion higher than 80% and a temporal dispersion higher than 75%. In the end, to test the simulator, it was necessary to conduct a region analysis respecting suppliers, by recurring to an auxiliary calculation, the compilation of SKUs which are considered exclusively decentralized, centralized or centralized-decentralized, based on the categorization analysis by region previously performed. Then, proceeding to the suppliers, the objective remained, by focusing on the ones that exclusively supply decentralized or centralized SKUs. In order to complement it and also to understand the dimension of this exclusivity status, the analysis was extended cross-regionally, where the categories mentioned were grouped in pairs of two (south-north, south-centre, north-centre) and three (south-centre-north), to find the SKUs and suppliers exclusively common in that group of regions.
The Simulator Creation
The creation of the simulator, was supported by the preceding analyses, which provided the foundations for the relevant inputs to be introduced, in order to produce certain outputs, vital for the decision-making. The objective is the simulation of the weekly or monthly costs, stock-out probabilities and the CO2 emissions, for the centralized and the decentralized scenarios.
The simulator was designed in the VBA developer tool of Microsoft Excel, through the creation of a userform composed by five tabs, namely cost structure, supplier, warehouses, routes, and service level (Appendix 1). In the first tab, there are four options regarding the cost structure to be assumed in the simulation: JM, third-logistic provider of large dimension or small dimension (influenced by
14 JM’s dimension) and suppliers. In case the latter option is selected, the user must introduce the following costs: administrative, picking (both per SKU) and transportation (fixed and variable by kilometers traveled). Although this is a customized option for each supplier, for the remaining options these costs are assumed to be constant for all suppliers. Additionally, there is the possibility of choosing the vehicle typology (capacity translated in number of pallets), which influences the cost structure. This indicator presupposes the user’s rationality in guaranteeing the optimization of the vehicles’ utilization, so that the truckload can reach a saturation point in terms of pallets capacity. Ultimately, there is an option button to display the costs weekly or monthly. Regarding the second tab, the information to be introduced is the identification of the supplier (code), the quantity of SKUs supplied weekly, and the number of SKUs per pallet. Also, it is available the option of selecting an external replenisher and introducing the respective weekly cost, as well as the number of weekly deliveries, both considered to the decentralized scenario. The next tab enables the choice of one warehouse per logistic region, to be included in the centralization scenario. Following this, there is the choice of the last party to be considered in the supply chain, the stores, exhibited in the form of transportation routes (maximum of seven routes per simulation). In this tab, for each route there is the option of selecting the region to facilitate the routes’ construction, in such a way that the warehouses (previous tab) are directly linked to stores from the same logistic region (until five stores per route) in the centralization scenario. Lastly, another variable of decision, besides costs, was considered to be relevant in terms of the centralization decision, the service level. On the one hand, in the centralization scenario, the service levels to be considered are the deliveries of the suppliers to the warehouse and from the warehouse to the stores. On the other hand, in the decentralization scenario, the single service level to be contemplated is concerned with the deliveries of the supplier to the stores.
15 The calculation of the decentralization and centralization total costs includes administrative, picking and transportation costs (Das & Tyagi, 1997; Stefansson, 2006; Gebennini, Grassi, Rimini & Depietri, 2013), expressed in euros per week:
𝐷𝑇𝐶𝑊𝑖,𝑗,𝑣 = 𝑉𝐶𝐴𝑖,𝑗× 𝑆𝐾 + 𝑉𝐶𝑃𝑖,𝑗× 𝑆𝐾 + 𝑉𝐶𝑇𝑣,𝑗× 𝐾 × 𝐷 + 𝐹𝐶𝑇𝑣,𝑗 4 + 𝐸𝑅 [1] 𝐶𝑇𝐶𝑊𝑖,𝑗,𝑣 = 𝑉𝐶𝐴𝑖,𝑗× 𝑆𝐾 + 𝑉𝐶𝑃𝑖,𝑗× 𝑆𝐾 + 𝑉𝐶𝑇𝑆𝑣,𝑗× 𝐾𝑆 × 𝐷 + 𝑉𝐶𝑇𝐽𝑀𝑣,𝑗× 𝐾𝐽𝑀 × ( 𝑆𝐾 𝑆𝐾𝑃 ⁄ 𝐿 ⁄ ) (𝑉𝑇 5⁄ ) + 𝐹𝐶𝑇𝑣,𝑗 4 [2] This calculation can also be expressed in euros per month:
𝐷𝑇𝐶𝑀𝑖,𝑗,𝑣= 𝑉𝐶𝐴𝑖,𝑗× 𝑆𝐾 × 4 + 𝑉𝐶𝑃𝑖,𝑗× 𝑆𝐾 × 4 + 𝑉𝐶𝑇𝑣,𝑗× 𝐾 × 𝐷 × 4 + 𝐹𝐶𝑇𝑣,𝑗+ 𝐸𝑅 × 4 [3] 𝐶𝑇𝐶𝑊𝑖,𝑗,𝑣 = 𝑉𝐶𝐴𝑖,𝑗× 𝑆𝐾 × 4 + 𝑉𝐶𝑃𝑖,𝑗× 𝑆𝐾 × 4 + 𝑉𝐶𝑇𝑆𝑣,𝑗 × 𝐾𝑆 × 𝐷 × 4 + 𝑉𝐶𝑇𝐽𝑀𝑣,𝑗 × 𝐾𝐽𝑀 × ( 𝑆𝐾 𝑆𝐾𝑃 ⁄ 𝐿 ⁄ ) (𝑉𝑇 5⁄ ) × 4 + 𝐹𝐶𝑇𝑣,𝑗 [4]
Where the index i, represents the number of warehouses and can vary from 1 to 3. Regarding j, it designates the supply chain party, which takes values from 1 to 4, in which 1 represents the cost structure of JM and so on, respecting the order of the simulator’s design (appendix 1). In relation to v, the values that can be assumed are 1 to vehicles of 33 pallets, 2 to vehicles with a medium capacity (20-24 pallets) and 3 to vehicles with small capacity (<12 pallets). The weekly centralization total cost are represented by CTCWi,j,v (or CTCMi,j,v on a monthly basis), while the
weekly decentralization total cost is DTCWi,j,v (or DTCMi,j,v). D corresponds to the weekly
deliveries in total of SKUs and ER is the fixed weekly cost of a replenisher from the supplier. Regarding K, it represents the total kilometers traveled, KJM are the total kilometers traveled
16 between the warehouses and the stores, KS are the total kilometers traveled between the supplier and the warehouses, and VT characterizes the vehicle’s typology. The calculation of kilometers is computed with real distances instead of euclidean distances, enabled by the construction of a VBA function (used in the userform), with Cartesian coordinates as arguments for the origin and destination, which finds the shortest route between them using Google Maps route planner. Additionally, L is the number of stores to receive the SKUs, SK is the number of SKUs delivered per week, while SKP is the number of SKUs per pallet. Finally, the average variable costs are represented by VCAi,j and VCPi,j, for administrative and picking costs, respectively. The variable
costs of decentralized transportation are VCTj,v, while in the centralization case, VCTJMj,v
represents the costs from the warehouses to the stores and VCTSj,v the costs from the supplier to
the warehouses. The only fixed cost considered, which respects to transportation, is FCTj,v. In the
decentralization scenario, the cost structure can be chosen between the abovementioned four options (introduced or inferred by the user). However, the calculation of the centralization scenario has into account that option only for the VCTSj,v, since the remaining variables respect only to the
JM’s cost structure. Additionally, the calculation of weekly deliveries differs from the decentralized case (simulator’s input), since JM’s warehouse and transports’ departments optimize it based on the average number of pallets delivered to each store per week and divided by the maximum capacity per store (assuming the limit of 5 stores per route).
Another relevant indicator, is the introduction of CO2 emissions for the centralization and decentralization scenarios. The calculation was based on an energy-based approach which encompasses the use of fuel consumption and a conversion factor to CO2 emissions, also assumed as 2,9 kilograms of CO2 per liter according to Cefic (2011). The average fuel consumption is
17 assumed to be 33,86 liters per 100 kilometers (based on the current fleet of JM). The calculation can be resumed in the following way:
𝐶𝐸𝑀𝑊 = ((33,86 ∗(𝐾𝑆 + 𝐾𝐽𝑀)100 ) ∗ 2,9) 1000 [5] 𝐷𝐸𝑀𝑊 = ((33,86 ∗100) ∗ 2,9)𝐾 1000 [6] 𝐶𝐸𝑀𝑀 = ((33,86 ∗(𝐾𝑆 + 𝐾𝐽𝑀) × 4100 ) ∗ 2,9) 1000 [7] 𝐷𝐸𝑀𝑀 = ((33,86 ∗𝐾 × 4100 ) ∗ 2,9) 1000 [8]
Where CEMW represents the weekly emissions of CO2 (ton) in the centralization case (or CEMM, on a monthly basis), while for the decentralization case it is represented by DEMW (or DEMM). The final indicator to be presented by this simulator is the stock-out (considered when there is no inventory to fulfill the currently demand), shown in percentage values of the total volume of SKUs, and in absolute value. In this case, it is introduced three service levels: from the supplier to the warehouse and from the warehouse to the stores for the centralized scenario, and from the supplier to the stores for the decentralized scenario. The calculation of the probability of having stock-outs for both scenarios can be shown as:
𝐶𝑆𝑃 = 1 − (𝑆𝐿𝑆𝑊 × 𝑆𝐿𝑊𝑆) [9] 𝐷𝑆𝑃 = 1 − 𝑆𝐿𝑆𝑆 [10]
18 𝐶𝑆𝐴𝑊 = (1 − (𝑆𝐿𝑆𝑊 × 𝑆𝐿𝑊𝑆)) × 𝐷 [11]
𝐷𝑆𝐴𝑊 = (1 − 𝑆𝐿𝑆𝑆) × 𝐷 [12]
𝐶𝑆𝐴𝑀 = (1 − (𝑆𝐿𝑆𝑊 × 𝑆𝐿𝑊𝑆)) × 𝐷 × 4 [13] 𝐷𝑆𝐴𝑀 = (1 − 𝑆𝐿𝑆𝑆) × 𝐷 × 4 [14]
Where CSP represents the probability of having a stock-out in the centralization scenario (percentage), while CSAW is expressed in number of SKUs per week (or CSAM per month). Whereas, for the decentralization scenario is DSP (percentage), DSAW (SKUs per week) and
DSAM (SKUs per month). Lastly, the service levels are SLSW for the deliveries of the supplier to
the warehouses, SLWS from the warehouses to the stores and SLSS from the supplier to the stores.
Quality Testing
A transversal approach was conducted with an extensive and thorough research of literature on the following topics: logistics, food industry, supply chain management, transportation and warehousing, vertical collaboration and centralization.
The different methods of data collection ensured data triangulation, in other words, to corroborate the evidence gathered through the several techniques: observation, interviews, literature’s research and quantitative date. This strength permits the construction of convergent lines which sustain construct validity throughout the data collection process, also supported by field and case study notes. Regarding external validity, as a single-case design it is required an in-depth investigation, which restricts the possibility to generalize (Yin, 2009), only possible when taking into consideration an identical cost structure. Nevertheless, there are some limitative factors such as the suppliers’ dimension and the type of store, which affect the cost structure. For instance, in the case of Recheio, a cash & carry store, the possibility of direct purchasing is facilitated. Additionally, the
19 relationship with carriers and suppliers and the inclusion of perishables’ SKUs, due to the need of additional conditions regarding both warehousing and transportation, can limit the opportunity to generalize this study. Lastly, reliability can be assured through the documentation and record keeping of the case study, leading to the attainment of the same results through its re-conduction. The Purchasing’s Dispersion of Recheio
Global Analysis
This analysis englobes the 37 Recheio’s stores located in Portugal (excluding islands), for the period of one year, 2015.
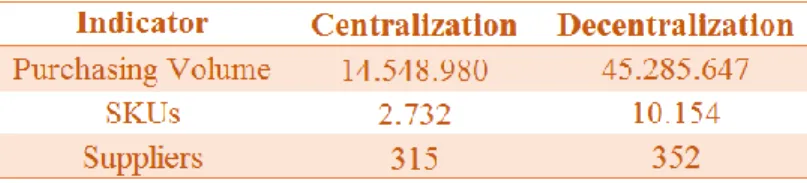
After analyzing the volumes of both centralized and decentralized purchasing, it is notorious the considerable discrepancy of more than 30 million of SKUs, representing the decentralized volume more than 200% of the centralized volume (Table 1). This is supported by the difference in the amount of SKUs supplied, by the warehouses (centralization) and by the suppliers directly to the stores (decentralization), where the SKUs delivered directly are approximately four times higher than the ones delivered through the warehouse. In terms of the number of suppliers, there are no relevant asymmetries. The results can be easily explained by the format of Recheio’s stores, which implies a considerably higher volume of deliveries to customers (enterprises), when compared to other formats, such as Pingo Doce that sells to the final customer. In summary, the centralized purchasing represents 24,32% of the total purchasing, while the decentralized purchasing represents 75,68%.
20 Following the ABC analysis, it is possible to conclude that only 2,62% (266 out of 10.154) of the SKUs represent 75% of the decentralized purchasing (category A). In the case of the suppliers’ ABC analysis, only 6,53% (23 out of 352) supply 75% of the decentralized SKUs. Concerning the distribution of the centralized purchasing, category A represents slightly higher proportions, being 9,19% of the total number of SKUs (251 out of 2.732) and 10,16% of the total number of suppliers (32 out of 315). In conclusion, the aggregation of purchasing is reflected in a total of 12.274 SKUs (8% of the total SKUs purchased are delivered by the two methods). The overall purchasing volume, 59.834.627 units, was supplied by 570 suppliers (appendix 2).
As mentioned before, the Braga’s store was analyzed individually to understand whether it should be part or not of the analysis, since as elucidated in several interviews this store has a specific behavior which could bias the analysis. The factor that contributed to the integration were insignificant proportions of unique-store and regional SKU’s (in quantity and volume) of the total operations of the store (appendix 3).
Regional Analysis
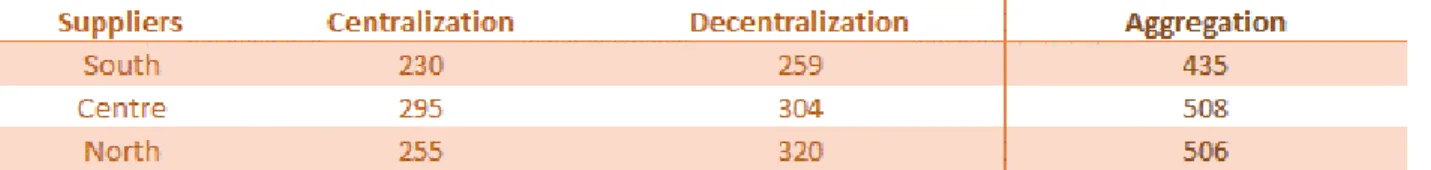
The unequal dispersion of stores in the territory, leads to the necessity of analyzing the distribution of the purchasing volume by region: south (5 stores), centre (19 stores) and north (13 stores). As exhibited in table 2, 3 and 4, there are relevant regional discrepancies in terms of purchasing volume (table 2), as well as, in terms of SKUs (table 3) and suppliers (table 4), mainly when comparing the south region with the remaining ones. In detail, the aggregated purchasing volume is distributed as follows: 9% on south, 47% on centre and 44% on north. The divergences between
21 north and centre are higher in the centralized purchasing (difference of 10 percentage points) than in the decentralized purchasing (1 percentage point). In relation to aggregated SKUs, the south region has 8.932 unique SKUs, while the centre has 10.959 and the north has 11.693. However, it should be highlighted that the centre region has the highest number of centralized SKUs, while the north region has the highest number of decentralized SKUs. In terms of suppliers, it is worth to mention that the reduced number of suppliers in the south region is explained by the limited product portfolio, along with the lower purchasing volume.
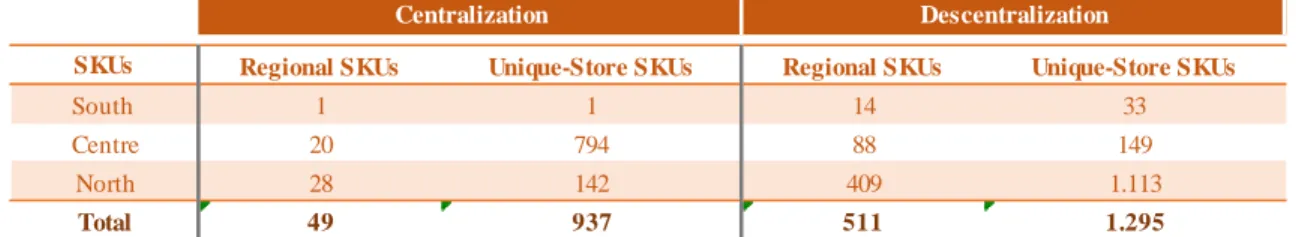
This regional segmentation allowed to understand the existence of two types of SKUs (table 5) and suppliers (table 6): regional and unique-store. The comparison between the centralization and the decentralization scenarios, permits to conclude that the number of regional SKUs centralized (49) is significantly lower than the regional SKUs decentralized (511). This discrepancy can be explained by the fact that a decentralized regional product is associated with more benefits than a centralized one for several reasons, such as seasonality, shorter distance between stores and suppliers and closer relationship between the two parties. In turn, it is notorious the higher number of regional suppliers in the decentralized scenario. On the contrary, the suppliers which deliver
Table 4 – Distribution of Regional and Unique-Store SKUs
SKUs Regional SKUs Unique-Store SKUs Regional SKUs Unique-Store SKUs
South 1 1 14 33
Centre 20 794 88 149
North 28 142 409 1.113
Total 49 937 511 1.295
Suppliers Regional Suppliers Unique-Store Suppliers Regional Suppliers Unique-Store Suppliers
South 0 1 1 3 Centre 2 48 9 11 North 5 16 17 22 Total 7 65 27 36 Descentralization Centralization
22 SKUs through the warehouse for one store only, are almost the double of the suppliers which deliver specific SKUs to a single store. Nevertheless, the tendency expressed in the regional SKUs is similar to the unique-store SKUs. In the decentralization scenario, there is a considerable asymmetry, since the north region is responsible for more than 85% of the unique-store SKUs. Similarly, in the centralization scenario, the centre region has approximately 85% of the unique-store SKUs. A more detailed analysis, can be consulted in appendix 3.
Exclusive SKUs and Suppliers Analysis
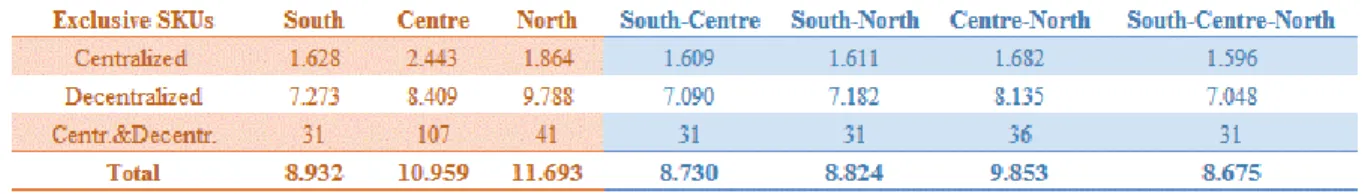
This analysis was performed, in order to have a better understanding of the distribution of SKUs and supplier by degree of centralization (total centralized, total decentralized or intermediate). Concerning SKUs (table 7), the south region has approximately less 2.000 unique SKUs than both the centre and north regions. This is explained by the reduced number of stores in this region, five compared to nineteen (centre) and thirteen (north). Additionally, the north region has a broader product portfolio than the centre region, explained by the difference of more than 600 SKUs of regional and unique-store overall SKUs. The groups of regions are mainly differentiated by the existence of regional and unique-store SKUs. For instance, in the centre-north regions’ group, where although each one individually has approximately 11.000 or even a higher number of SKUs, the shared SKUs represent less than 10.000.
23 Finally, in terms of exclusive suppliers (table 8), the trend explained above for the SKUs is also exhibited. Both centre and north regions, have a higher number of suppliers than the south region, explained by the number of stores, purchasing volume, as well as the number of SKUs. In this case, when grouping regions, the exclusively centralized or decentralized SKUs for one region will be disregarded from the analysis (appendix 4). In the end, the group of region’s analysis aims to have an holistic overview of the product range and homogenous suppliers’ strategies across regions, and degree of centralization to support decision-making.
The Centralization Decision: Creation of the Simulator
As explained in the methodology section, numerous variables were considered as inputs of the simulator, having in mind the desirable outputs, essential to the centralization decision. The outputs processed are the economic cost of the centralization and decentralization scenarios, the CO2 emissions, as well as the stock-out probability.
According to this, it was imperative to account for the main components of the logistics costs (European Commission, 2015), transportation (displayed in variable and fixed costs), warehousing (variable picking costs), but also variable administrative costs related with order processing and administration. In detail, the fixed transportation costs include rents, taxes, insurance, communications, inspections, personnel costs, “via verde” and structure costs, while the variable costs, which depend on the number of kilometers traveled, include diesel costs, tires and maintenance. Picking costs, concern solely to the picking task in the warehouses, whereas
24 administrative costs include supervision, operational management and expedition. In the decentralization scenario, there is an extra cost of having an external replenisher in the stores. Additionally, the probability of stock-out is a relevant indicator, since it is predictable that the service levels’ combination of the centralized deliveries (from suppliers to warehouses, and then to stores), will be considerably higher compared to the service level of the decentralized deliveries (from suppliers to stores). This implies a higher stock-out probability for the latter scenario. This index is seen as a complement to the costs’ analysis, since, in the end, the objective is to avoid stock-outs at the lowest cost possible. The increasing environmental awareness contributed to the inclusion of an indicator which could reflect the impact of a decrease in fuel consumption with significant importance for green logistics, as the CO2 emissions. In this way, the potential benefits of centralization and decentralization are accounted for not only in the economic sphere, but also in the social and environmental ones. In conclusion, further investigation is warranted to explore new decision variables, following future trends and company’s needs, such as working capital.
Conclusion
This exploratory study intended to develop a simulator which allowed to support the decision-making regarding the possibility of centralizing or decentralizing a specific supplier or SKU. In addition, the impact of each simulator’s output on the decision was considered independently. As a support to the study, the dispersion of volume purchasing and SKUs over Portugal, excluding islands, was analyzed. The main findings were the existence of a clear distribution of purchasing volume in terms of centralization’s degree, where more than 75% are decentralized. In terms of regional dispersion, more than 90% is distributed almost equally between the centre and north regions, while the south region has approximately 9% of the purchasing volume. Furthermore,
25 there are considerable asymmetries regarding regional and unique-store SKUs, in which the north region has more than 85% of the unique-store decentralized SKUs and a considerable amount of regional ones. On the contrary, the centre region registers the same proportion for the centralized SKUs. Finally, it is possible to conclude that the north region has a wider product portfolio, and along with the centre region shares the highest number of suppliers.
The creation of the simulator has the ultimate objective of supporting the decision-making, in terms of understanding the impact of the centralization decision for the company, the supplier and the final customers. To do so, the simulator includes transportation, picking and administrative costs, as well as the option of having an external replenisher for the decentralization scenario. The simulation also includes the associated CO2 emissions and the service level guaranteed by the supplier and JM, allowing to realize the probability of having stock-outs. These variables provide the company a holistic overview of the impact of a certain decision on the economic, environmental and social spheres, related with the sub-questions addressed in this study. The economic impact is the primary decision factor, leading JM to choose the most beneficial scenario in terms of cost savings. However, aligned with the corporate social responsibility of JM, the environmental and social impacts are also considered. Given this, the company should aim at the lowest possible level of CO2 emissions and stock-out probability. In this way, the optimal centralization decision must find an equilibrium between the three dimensions, having in consideration the priority level of each dimension on the current strategy of JM. Nevertheless, the use of the simulator can be conditioned by some factors regarding the cost structure, such as the dependence on JM’s dimension, in terms of size and bargaining power, but also the reliability of the information provided by the supplier in the course of a negotiation. In the end, the purpose of this study was the optimization of the logistics chain at JM, through the simplification of the centralization decision.
26 References
Abrahamsson, Mats. 1993. “Time-Based Distribution." The International Journal of Logistics
Management, 4(2): 75-84.
Audy, Jean-François, Nadia Lehoux, Sophie D’Amours and Mikael Rönnqvist. 2012. “A framework for an efficient implementation of logistics collaborations.” International Transactions
in Operational Research, 19(5): 633-657.
Bagchi, Prabir K., Byoung Chun Ha, Tage Skjoett‐Larsen and Lars Boege Soerensen. 2005. “Supply chain integration: a European survey.” International Journal of Logistics Management, 16(2): 275–294.
Barratt, Mark. 2004. “Understanding the meaning of collaboration in the supply chain.” Supply
Chain Management: An International Journal, 9(1): 30-42.
Barratt, Mark and Alexander Oliveira. 2001. “Exploring the experiences of collaborative planning initiatives.” International Journal of Physical Distribution & Logistics Management, 31(4): 266 – 289.
Carvalho, José Crespo de. 2012. “Logística e Gestão Logística.” In Logística e Gestão da Cadeia
de Abastecimento, ed. Manuel Robalo, 23-28. Lisboa: Edições Sílabo.
Cefic. 2011. Guidelines for Measuring and Managing CO2 Emissions from Freight Transport
Operations. Cefic. Accessed April 13, 2016.
http://www.cefic.org/Industry-support/Responsible- Care-tools-SMEs/5-Environment/Guidelines-for-managing-CO2-emissions-from-transport-operations/.
27 CSCMP, Council of Supply Chain Management Professionals. 2016. “Definition of Supply Chain Management.” Accessed April 8, 2016. https://cscmp.org/supply-chain-management-definitions.
Das, Chandrasekhar and Rajesh Tyagi. 1997. “Role of inventory and transportation costs in determining the optimal degree of centralization.” Transportation Research Part E: Logistics and
Transportation Review, 33(3): 171-179.
De Koster, René, Tho Le-Duc and Kees Jan Roodbergen. 2007. “Design and control of warehouse order picking: a literature review.” European Journal of Operational Research, 182(2): 481-501.
Eisenhardt, Kathleen M.. 1989. “Building Theories from Case Study Research.” The Academy of
Management Review, 14(4): 532-550.
European Commission. 2015. Lot 1: Analysis of the EU Logistics Sector. Fact-finding studies in support of the development of an EU strategy for freight transport logistics. European Commission. Accessed April 5, 2016. https://ec.europa.eu/transport/themes/strategies/studies/doc/2015-01-freight-logistics-lot1-logistics-sector.pdf.
European Commission. 2016. “Road Transport: Reducing CO2 emissions from vehicles.” Accessed April 2, 2016. http://ec.europa.eu/clima/policies/transport/vehicles/index_en.htm. Garcia, Daniel J. and Fengqi You. 2015. “Supply chain design and optimization: Challenges and opportunities.” Computers & Chemical Engineering, 81: 153-170.
Gebennini, Elisa, Andrea Grassi, Bianca Rimini and Eleonora Depietri. 2013. “Costs and opportunities of moving picking activities upstream in distribution networks: A case study from the beverage industry.” International Journal of Production Economics, 143(2): 342-348.
28 Guedes, Alcibíades Paulo. 2012. “Gestão da Cadeia de Abastecimento.” In Logística e Gestão da
Cadeia de Abastecimento, ed. Manuel Robalo, 67-76. Lisboa: Edições Sílabo.
Gross, Wendelin F., Cristina Hayden and Christian Butz. 2012. “About the impact of rising oil price on logistics networks and transportation greenhouse gas emission.” Logistics Research, 4(3): 147-156.
Hesse, Markus and Jean-Paul Rodrigue. 2004. “The transport geography of logistics and freight distribution.” Journal of Transport Geography, 12(3): 171-184.
House, Robert G. and Theodore P. Stank. 2001. “Insights from a logistics partnership.” Supply
Chain Management: An International Journal, 6(1): 16-20.
Juan, Angel A., Javier Faulin, Elena Pérez-Bernabeu and Nicolas Jozefowiez. 2014. “Horizontal Cooperation in Vehicle Routing Problems with Backhauling and Environmental Criteria.” Procedia – Social and Behavioral Sciences, 111: 1133-1141.
Kohn, Christofer and Maria Huge Brodin. 2008. “Centralised distribution systems and the environment: how increased transport work can decrease the environmental impact of logistics.”
International Journal of Logistics Research and Applications, 11(3): 229-245.
Kumar, G. Santosh and P. Shirisha. 2014. “Transportation The Key Player In Logistics Management.” Journal of Business Management & Social Sciences Research, 3(1): 14-20.
Lambert, Douglas M., Martha C. Cooper and Janus D. Pagh. 1998. “Supply chain management: implementation issues and research opportunities.” The International Journal of
Logistics Management, 9(2): 1-19.
Lee, Hau L., V. Padmanabhan and Seungjin Whang. 1997. “Information distortion in supply chain: the Bullwhip effect.” Management Science, 43(4): 546–558.
29 Mangina, Eleni and Ilias P. Vlachos. 2005. “The changing role of information technology in food and beverage logistics management: beverage network optimisation using intelligent agent technology.” Journal of Food Engineering, 70(3): 403-420.
Mentzer, John T., William DeWitt, James S. Keebler, Soonhong Min, Nancy W. Nix, Carlo D. Smith and Zach G. Zacharia. 2001. “Defining Supply Chain Management.” Journal of
Business Logistics, 22(2): 1-25.
Patton, Joseph D. 1986. Logistics Technology and Management. New York: The Solomon Press. Ryu, Il, SoonHu So and Chulmo Koo. 2009. “The role of partnership in supply chain performance.” Industrial Management and Data Systems, 109(4): 496–514.
Saunders, Mark, Philip Lewis and Adrian Thornhill. 2009. Research Methods for Business
Students. 5th ed., 289-299. Harlow, England: Prentice Hall.
Seidel, Saskia, Corinne Blanquart and Verena Ehrler. 2016. “Same–same but different? A comparison of food retail and distribution structures in France and Germany.” Case Studies on
Transport Policy, 4(1): 29-37.
Shapiro, Jeremy F. and Stephen N. Wagner. 2009. “Strategic Inventory Management.” Journal
of Business Logistics, 30(2): 161-173.
Sparks, Leigh. 1986. “The Changing Structure of Distribution in Retail Companies: An Example from the Grocery Trade.” Transactions of the Institute of British Geographers, 11(2): 147-154. Srivastava, Samir K.. 2007. “Green supply-chain management: a state-of-the-art literature review.”
International Journal of Management Reviews, 9(1): 53–80.
Stefansson, Gunnar. 2006. “Collaborative logistics management and the role of third‐party service providers.” International Journal of Physical Distribution & Logistics Management, 36(2): 76-92.
30 Subramani, Mani. 2004. “How do suppliers benefit from information technology use in supply chain relationships?,” MIS Quaterly, 28(1): 45-73.
Ubeda, S., F.J. Arcelus and J. Faulin. 2011. “Green logistics at Eroski: A case study.”
International Journal of Production Economics, 131(1): 44-51.
van der Vaart, Taco and Dirk Pieter van Donk. 2008. “A critical review of survey-based research in supply chain integration.” International Journal of Production Economics, 111: 42–55. Yin, Robert K.. 2009. Case Study Research: Design and Methods, ed. Manuel Robalo, 23-28. Thousand Oaks, California: SAGE Publications.