Momentum Strategy among countries and
industries:
Evidence from global stock indices and
ETFs
Yashini Sagoenie 32329 / C343739
Work Project
International Master in Finance 2017/2018
Under supervision of Professor Martijn Boons (Nova - School of Business and Economics) and Professor Ricardo Rochman (Fundação Getulio Vargas – School of Economics) January 2019
2
Abstract
This paper examines several momentum strategies for European countries and industries, namely on individual stock level, on macromomentum level and for ETFs. This study finds most evidence for momentum presence among individual stocks. Macromomentum using ranked indices was present, depending on the holding period and the category of industries or countries. Evidence on ETF level was not found. Equally weighted and value weighted methods were used, with the latter being closer to real life but showing less significant results. When comparing the different strategies, individual stock momentum seems to consistently outperform macro- and ETF momentum.
3
Content
1. Introduction ...4 2. Literature Review ...5 2.1 Background ...5 2.2 Behavioural models ...82.3 Individual stock momentum and macromomentum ...9
2.3.1 Countries ...9 2.3.2 Industries ... 10 2.4 Exchange-Traded Funds ... 11 2.5 Purpose ... 12 3. Momentum Process ... 13 3.1 Data ... 13 3.1.2 Countries ... 13 3.1.2 Industries ... 15 3.1.3 ETFs ... 16 3.2 Methodology ... 16
4. Results and analysis ... 20
4.1 Country momentum ... 20
4.2 Industry momentum ... 25
5. Conclusion and limitations ... 27
References ... 30
Appendix 1 Tables ... 32
Appendix 2 Graphs ... 37
Countries ... 37
Non-accumulated returns countries ... 37
Accumulated returns counties ... 38
Industries ... 39
Non-accumulated returns industries ... 39
4
1. Introduction
Momentum is a concept originally derived from physics and was introduced as a financial concept by Jegadeesh and Titman (1993) who explained that in the United States strategies buying well-performing stocks and selling poorly-performing stocks show significant positive returns over medium-term holding periods for the period 1965-1989. Nowadays, this strategy of stock return continuation – also called momentum – is still relevant. The most recent example of momentum in the financial markets is in the industry of cryptocurrencies. Bitcoin is the best-performing and dominating1 cryptocurrency and went from $3,950 per coin in September 2017 to $15,940 per coin in December 2017 (Business Insider UK). As a result, both professionals and non-professionals started to buy the currency. Looking at the Bitcoin performance compared to other cryptocurrencies, Rohrbach, Suremann and Osterrieder (2017) find that momentum exists in this industry when using a cross-sectional portfolio. Kość, Sakowski, and Ślepaczuk (2018) show that the contrarian strategy of buying low and selling high seems to be more significant in the short run. Commodity pricing is another field where spot price mean reversion is often observed. Over a period of 215 years, Geczy and Samonov (2016) find, for example, significant results for this phenomenon, especially when there are no futures linked to the specific commodity.
Since a growing number of papers proves that the momentum strategy is significant in the short run for several countries but also for certain industries, it will be interesting to focus on Europe and the Brazil, Russia, India and China (BRIC) specifically to see if the previously found results are still valid. Besides, to give a more in-depth insight into momentum, Exchange-Traded Funds (ETFs) will be introduced and compared to normal indices. Recently, using ETFs
1 Bitcoin dominates the cryptocurrency market with 56% of the total market capitalization according to Kość, Sakowski, and Ślepaczuk (2018).
5
to chase momentum profits has become an interesting topic. Therefore, in this paper will be examined whether momentum strategies are significant for several European countries, certain fast-growing developing countries and among the industries across Europe, comparing all of them to local ETFs. The research will differ from previous literature by focussing on specific areas and by using the Jegadeesh – Titman methodology – as opposed to the also often used Fama-French high minus low factor. This research is one of the first studies to examine European industries ETFs using the Morgan Stanley Capital Index. Finally, the time range for the dataset is more recent, namely from 2000 – 2018. The research question of this thesis is:
Which momentum strategy performs best: individual stock momentum, country momentum (MSCIs) or industry momentum (GICS) for the period January 2000 – January 2018?
This research thus compares the momentum strategy for countries and industries on individual and national level and compares it with the ETFs for countries and industries. The rest of the paper is organised as follows. Section 2 describes the literature review, section 3 and 4 describe the momentum process and the data acquisition, respectively. Section 5 shows the conclusion and limitations of this research.
2. Literature Review
2.1 Background
According to Lebovic (1994), momentum has two different meanings. Firstly, it can be defined as an ‘autoregressive process’. An autoregressive model is a model where the current value of the dependent variable, in this case the momentum returns, only depends on its previous values and an error term (Brooks, 2008) and looks as follows:
yt = μ + φyt-1 + φyt-2 + … + φpyt-p + ut (2.1)
6
Momentum can also be explained as ‘a reciprocal relationship between a predilection towards an act and that act’ (Lebovic, 1994). This means that the effect of momentum can be a self-fulfilling prophecy, since the best performing stock - also known as ‘winner’ - will already have the highest demand in turn leading to higher prices and hence higher returns. On the other hand, a ‘loser’ - a bad performing stock - will probably be sold, hence supply will increase and the price of that stock will decrease. This is regarded as a psychological result of the momentum strategy. This is opposed to the contrarian strategy where an investor should ‘buy low’ when the stock is cheap – when the stock is the loser - and ‘sell high’ when the stock has high returns with the goal of maximising the profit.
Stock return continuation related literature often uses data from the United States. As a result, most momentum evidence and theories are based on the financial market in the US. Among others are Moskowitz and Grinblatt (2004) who claimed that industry effects are almost entirely accountable for the United States’ momentum effect. Once controlled for the industrial effects, momentum is no longer profitable according to them. Moreover, Chan, Jegadeesh & Lakonishok (1996) explained how stock returns can give very detailed information about a company and could thus be a good proxy for future performances since the financial market does not adapt quickly to new information.
In 1998, Carhart proposed an extension of Fama and French’s three-factor model (1993) to explain U.S. stock returns by adding the momentum factor (Winner minus Loser) besides the size, market value and book-to-market value factors. Fama and French examined in 2012 whether the four factors are still applicable, this time looking at other financial markets around the world besides the United States. Except for Japan, significant momentum results were found for North-America, Asia Pacific and Europe. When using models that differ from the Fama-French factor model, Grundy and Martin (2001) found evidence that the stock specific return
7
momentum strategy dominated the total return momentum strategy in the US. Other recent research performed by Bhojraj and Swaminathan (2006) shows that momentum is significant for a period of one year for liquid financial markets. After that, reversal takes place. Thus, portfolio managers should take the time horizon into account when investing and looking at past returns for several markets around the world. Yara, Boons and Tamoni (2018) examined momentum strategies among several asset classes in (mostly) developed countries and found significant results for momentum value spread. However, these results are for one-year periods and they are procyclical.
De Bondt and Thaler (1985) found return reversals in the US in the long run meaning that poorly-performing stocks earned 25 percent more than the well-performing stocks as a result of overreaction to information. In 2001, Jegadeesh and Titman evaluated other momentum strategies besides the one proposed in 1993 and they concluded that momentum strategy continued to be profitable. Whereas previously Jegadeesh and Titman mentioned that the overreaction results from De Bondt and Thaler were debatable, they now also found evidence for behavioural reasoning behind the momentum strategy. In 2011, Jegadeesh and Titman revised their momentum strategy once more and stated that momentum seems to be the most significant proof against the efficient market hypothesis. Overall, there seems to be a consensus that momentum is present for short time periods of three months up to one year. The current debate is about momentum’s significance and the source of the potential profit. Most of the academic literature assumes the investor’s behaviour as source of momentum profit either based on evidence supporting their behavioural model (Hvidkjaer, 2006) or evidence that can be explained by rational pricing models and investor irrationality (Chordia and Shivakumar, 2002).
8
2.2 Behavioural models
Hvidkjaer (2006) found in his research that small and large investors use different trading strategies. Small investors seem to underreact and thus have a delayed response. Especially the losers start with a small pressure to buy which gradually changes to a pressure to sell. Winners show a similar pattern though this pattern is weaker than for losers. Large institutions on the other hand do not seem to have initial underreaction or delayed response, but evidence suggests that they use momentum trading strategies from the beginning, namely a pressure to buy the winners and sell the losers. All results slowly disappear after one year. In 1999, Hong and Stein found similar results. They show that slower information diffusion leads to more ‘overshooting’ and reversals in the long-run. However, they mention that the small institutions are most prone to momentum and its reversals.
Chui, Titman and Wei (2010) mention that among others Sagi and Seasholes (2007) provide the rationale behind momentum, namely that risk premia increase because of positive stock return realisation. However, they are not able to explain the size of the momentum returns without assuming high risk aversion which is an example of behaviouralism. They argue that the momentum effect shown by Jegadeesh and Titman (1993) is too strong to be solely explained by risk. Therefore, Chui et al. focus on ‘individualism’ as introduced by Hofstede (2003)2 and its relationship with trading volume and volatility.3 Not only do they find that the momentum effect is stronger on a global scale, they also challenge both the theoretical and the behavioural researchers.4 The researchers conclude that the investors in less individualistic countries do not necessarily prefer using their own information. Instead, they heavily rely on
2 Hofstede explains how there are cultural differences based on five dimensions of which individualism is closest to overconfidence and self-attribution bias. It is thought that more individualist countries tend to be more overconfident and less-individualist countries tend to be less overconfident.
3 Odean (1998) and Scheinkman & Xiong (2003) demonstrate models showing that overconfident traders trade more and their return is more affected by market thus obtain too much volatility. 4 They find that momentum returns are riskier in the US and Europe, but not in Japan and East-Asia. Individuals seem to have a psychological reason causing momentum. This is not found for all countries and there is no pattern to be seen.
9
information presented by their peers. According to Chui et al. (2003), they act less overconfident / self-attributed and thus make decisions that lead from little to no momentum profits.
Although both behaviouralism and non-behaviouralism as explanation behind momentum seem to have significant results, this paper will focus on analysing if the results found in the past regarding momentum are still valid and if it could be more efficient to use ETFs instead of individual stock momentum.
2.3 Individual stock momentum and macromomentum
2.3.1 Countries
Notwithstanding most academic research focussing on the United States, the second most examined region is Europe. Using the same method as Jegadeesh and Titman, however, applied to European countries, Rouwenhorst (1998) finds similar significant results (without rebalancing whereas Jegadeesh and Titman rebalance every month) for individual stock momentum. More recent research by Abourachid, Kubo and Orbach (2017) shows weakly significant results for a more recent time period using the same method as Jegadeesh & Titman and Rouwenhorst. The results are stronger for small stocks and weaker for bigger stocks when examined in shorter time periods. The financial crisis seemed to be the reason for the lower results though correlation does not imply causality. Nijman, Swinkels and Verbeek show significant results for the individual European stocks, but not for countries or industries (2004).
Momentum in emerging economies is a new, but growing area. Cakici, Tang & Yan (2016) carried out similar models as before, however on individual emerging countries rather than emerging countries as a group. Their results suggest that momentum is not evident in emerging countries individually and thus is not related to funding liquidity, market liquidity
10
and credit risk. On the other hand, Chan, Hameed and Tong (2000) find significant momentum results due to higher trading volumes in the previous period and time-series predictability in several indices. Griffin, Ji and Martin (2003) find significant results for all regions / continents except Asia. When looking at the individual BRIC (Brazil, Russia, India and China) countries, they find significant results for the momentum investing strategy.
2.3.2 Industries
Besides examining country momentum, Nijman et al. (2004) also examine individual industry momentum in Europe. Their results imply that industry momentum is weakly present. The authors find significant results for ‘Retailing’, ‘Food, Drug & Retailing’ and ‘Pharmaceuticals & Biotechnology’ at the 90 percent significance level. At 95 percent significance level, momentum returns were found for ‘Commercial Services and Supplies’, ‘Hotels, Restaurants & Leisure’ and ‘Technology Hardware & Equipment’. A portfolio-based regression technique is used to decompose the momentum effects into several sources such as country, industry and individual stock momentum. Their results suggest that industry momentum is not significant, thus industry effects are not likely to be present. Instead, investors should focus on individual stock momentum investment strategies. Previously, Moskowitz and Grinblatt (1999) found the opposite, namely that industry momentum strategic investing is profitable – specifically in the short run - and is primarily driven by long positions in well-performing industries and short positions in badly-well-performing industries.5 Individual stock
momentum within each industry, however, was tremendously weaker than for industries. Overall, both categories had a mean reversion in the long run. Even though Nijman et al., also find negligible industry momentum results, they do not support Moskowitz and Grinblatt who additionally state that industry momentum drives individual stock momentum. Grundy and
5 Even after controlling for size, book-to-market equity, individual stock momentum, cross-sectional dispersion in mean returns and potential microstructure influences (Moskowitz and Grinblatt, 1999)
11
Martin (2001) find that industry momentum on its own does not explain momentum profitability.
2.4 Exchange-Traded Funds
Andreu, Swinkels and Tjong-A-Tjoe (2013) examine momentum strategies for country and industry indices that are directly tradable, namely through ETFs. Using tradable indices is more efficient and cheaper than tracking individual indices. The literature review above explains that momentum was analysed among countries and industries, such as done by Moskowitz and Grinblatt (1999), though this was analysed for non-tradable portfolios implying that investors spend a lot of time going long and short in individual stocks. Instead of buying and shorting individual stocks every month (do not forget about transaction costs and daily liquidity concerns!), Andreu et al. wanted to prove that momentum is present in aggregated returns such as tradable indices in the form of ETFs. Their main result suggests this presence with a yearly excess return of five percent in industry ETFs and eight percent in country ETFs. They also analyse the bid-ask spread to see if it is worth using this strategy given the transaction costs involved. It turns out that the bid-ask spreads are lower than these costs, making the strategy of using ETFs very attractive. Andreu et al. emphasise that even though for example O’Neal (2000) found significant results for tradable portfolios in the form of mutual funds, they preferred examining ETFs for several reasons. First, since mutual funds are actively managed funds, it is hard to tell if significant results are a result of momentum or the manager’s skills. Besides, mutual funds are not easy to short-sell.
Tse (2015) extends this research by using a longer ranking and holding period, including the crisis period, including more ETFs and by analysing time series momentum on top of cross-sectional momentum (looking at the ETF’s own returns rather than looking at its relative performance). He does not find significant results across ETFs for any period from one up to twelve months for ranking and holding when looking at cross-sectional momentum. When
12
examining time series momentum, significant results were found however these were better than the contrarian strategy. The most successful time period was during the 2008 crisis though results worsened after the crisis.
2.5 Purpose
Goal of this research is to examine if European countries and industries show individual stock momentum effects, compare it with momentum effects across countries and industries which will also be compared with ETFs. Different from the literature review, the sample period in this research will be more recent (2000-2018), the approach will differ as will be explained in the methodology and some emerging countries will be added. Besides, whereas previous research used a subsection of the Global Industry Classification Standard (GCIS) for the industries and / or American industry indices, this research will use the overall GCIS industries since these ETFs are easier to obtain (thus being advantageous for investors). Most academic research is focussed on the United States and to lesser extent on Europe. The European GCIS have seldom been examined before. Momentum in emerging countries is another category that has not been extensively examined yet and will therefore be included in this study to determine its importance for future research in this area. Besides, Griffin, Ji and Martin (2003) found significant results for BRIC and it is expected that these countries will be the drivers of the world economy in the future and they are thus important.
Despite the different methods and time period, Nijmark et al. (2004) use a similar dataset as this study. They found significant results for Denmark, France and the UK. Other European countries did not show significant results for the momentum strategy for the period 1990 till 2000. Especially after the introduction of the euro as common currency and after the world (and therefore financial markets) became more digitalised and globalised, the beforementioned significant outcomes might have changed. In fact, Abourachid et al. (2017) already found in a recent research, with a dataset covering 2003 – 2015, that the momentum returns in Europe are
13
lower than previously stated. The lower results can be explained by the worsened market conditions during the financial crisis in 2007 and its severe and relatively long-lasting consequences. The dataset used in this research is extensive enough to offset the effects of the crisis.
On top of focussing on individual stock momentum, country and industry momentum will also be examined and compared with ETFs. Nowadays, these funds are cheaper and more convenient to trade for both small and large investors. Instead of buying and shorting individual stocks every month (as the content of the indices changes), having to trade ETFs significantly lowers the numbers of trades and the transactions costs involved. This paper will contribute to the already existing literature by using a more recent interval than Tse and it will use different ETFs for industries. Whereas Tse uses international ETFs for country indices, he uses US sector indices. Here, European sector indices will be used.
3. Momentum Process
3.1 Data
3.1.2 Countries
The data for the period comprehends 217 months from the period January 2000 – January 2018, every first of the month, was derived from Datastream and was based on the Morgan Stanley Capital International Europe index. Based on the 15 countries represented in the MSCI Europe, the most important local stock exchange will be used to test for momentum. It is therefore plausible that certain stocks are not part of MSCI Europe but are included in this dataset. The European countries included are Austria (ATX), Belgium (BEL20), Denmark (OMX Copenhagen), Finland (OMX Helsinki), France (CAC40), Germany (DAX), Ireland (ISEQ), Italy (MSCI), the Netherlands (AEX), Norway (Oslo Bors), Portugal (PSI20), Spain
14
(IBEX35), Sweden (OMX Stockholm), Switzerland (SMI), the United Kingdom (FTSE100). Besides, local indices from Brazil (Bovespa), Russia (RTS), India (Nifty), China (Shanghai SE) and the United States (S&P500) are included in the dataset as significant results were found for these countries in the past. Reason for including the United States is to see if previously found significant momentum results are still valid. The importance of the stock exchange was based on the Wall Street Journal Market Data Center and on the importance assigned by Datastream itself.6 The Shanghai Stock Exchange was chosen over the Shenzhen Stock Exchange (SSE) and the Hong Kong stock exchange because it is the fourth largest stock exchange in the world in terms of market capitalisation according to Banco Bilbao Vizcaya Argentaria, one of the banks in Spain. The bank’s report also mentions that the SSE has some peculiarities. Part of the index is controlled by the government implying that the government intervenes in case of volatility. Moreover, as opposed to other global market indices, most of the investors in the SSE´s stocks are institutional investors.
All indices are reported in local currencies under the assumption that the strategy is neutral to exchange rate since the stocks bought and sold within each index are of the same currency. For robustness, all indices will also be examined in euros since this paper partly focusses on Europe. Data was represented as monthly adjusted prices of each stock. Returns are obtained using the natural logarithm of the price at time t+1 divided by the price at time t.Since the performance in each index is measured per month and the 10 percent bottom and top performing number of companies is based on the number of companies with valid information in that specific month, companies that have not been part of the index since January 2000 will not affect the results. In total, monthly prices from over 3600 stocks divided over 20 indices were
6 In case the index recommended by the WSJ was not available for download, the stars provided by Datastream were used as guidance. The terminal uses stars (from one to three) to show the
importance of the data to be derived. For example, FTSE100 had 3 stars meaning that it is important and often used information whereas FTSE 100 Banks had one star implying that the information is less often used.
15
used for this study. The number of firms per country ranges from 18 to over 1300. All tables can be found in appendix 1.
[ Table 1 here ]
3.1.2 Industries
As the MSCI was used as a benchmark for the countries, the MSCI will be used again for selecting the industries. The 15 European countries used before are the same 15 countries that are used by MSCI to create European industry MSCI indices. As a result, Brazil, India, China and the US will not be considered in this part of the paper. Data was downloaded from Datastream using the industrial classification of each company. Datastream assigns classifications to the individual companies. The total returns per sector index were derived from Bloomberg. Nijman et al. mentioned that the MSCI aggregation is more adequate for European stocks than the SIC.7 Based on the GICS8 published by MSCI, all companies from all European country indices were divided among 11 sectors.9 The 11 sectors are Energy, Materials, Industrials, Consumer Discretionary, Consumer Staples, Health Care, Financials, Information Technology, Telecommunication, Utilities and Real Estate. Descriptive statistics for each industry are displayed in table 2. The number of firms per industry ranges from 29 to 247. In practice, hedging costs should be considered when combining the returns of various stock indices with different currencies within the industries. For simplification purposes and since hedging costs are almost negligible within Europe, these are assumed to be zero in this paper.
[ Table 2 here ]
7 Which was used for American stocks by Moskowitz and Grinblatt in 1999
8https://www.msci.com/gics; in January 2018, the GICS classifications were changed in September 2018.
9 Nijman et al. mentioned that they had to manually reclassify some of the countries in their dataset since the GICS was introduced in 2000. Since this research’s dataset starts in 2000, this problem can be ignored.
16
3.1.3 ETFs
As mentioned before, the MSCI itself is used as a proxy for the ETFs in this paper. Since the goal of the ETF is to track the MSCI, both should have similar if not the same results. It is important to keep in mind that ETFs will always carry management fees, if present, and will reflect transaction costs. Well-known ETFs for the MSCI are iShares and SPDR. Other well-known ETF providers are Vanguard and Charles Schwab. They usually compete in terms of management fees10 and how well the underlying index or industry is tracked. When looking at industries, the regional GICSs only exist for Europe. Since there does not exist a GICS for BRIC or for emerging markets, BRIC will not be considered for the industries. At macromomentum level, as stated by Bhojraj and Swaminathan (2000) to differentiate between individual stock momentum and overall country level momentum, European ETFs were most consistent with the industry MSCIs. Total returns on all ETFs are derived from Datastream and Bloomberg.
3.2 Methodology
Following Jegadeesh and Titman (1993), stocks are selected based on their performance over the past 3 and 6 months11 and the constructed portfolios will also be held for the same
amount of time (also known as holding period) as the tracking period. To avoid the bid-ask spread, price pressure and to reflect lagged reaction effect, the authors used one lagged month between the construction of the portfolio and the start of the holding period. Since results for strategies with and without the lagged month were similar, this paper will focus on a holding period starting right after the construction of the portfolio. After tracking the stocks for J
10 The management fees have been declining in the past few years with Vanguard recently announcing that it will eliminate trading fees on most of its ETFs, which includes its rivals’ ETFs. 11 Jegadeesh and Titman use up to 12 months of ranking and holding periods. After going through the more recent literature, it seems that 3 to 6 months seems to be a better time interval due to proven mean reversal as mentioned in the literature review.
17
months, all cumulative log returns will be ranked in descending order. Thus, the stock with the highest return will be on top and the stock with the lowest return will be at the bottom. The first decile best performing stock – the so-called ‘Winners’ - and the ten percent worst performing stock – also called ‘Losers’ – will be put together and a cross-sectional12 portfolio will be constructed by going long in the winner stocks and selling short on the losers. This portfolio is also known as the zero-cost portfolio and will be held for K months4. Thus, the J/K strategy is the tracking of individual stocks for J months, while holding the constructed portfolio for K months. Here, J and K are the same. Note that a monthly portfolio reconstruction is the same as revising the weights of 1/K securities any month for the whole constructed portfolio while rolling over the other (K-1)/K stocks in it.
If the return of each portfolio is both positive and significant, a t-test will provide evidence for the momentum’s significance. Jegadeesh and Titman used equally weighted portfolios. Recently, many researchers use value weighted portfolios based on stocks’ market capitalization since the returns of these portfolios are more realistic. Hence, they will also be used for the individual country stock momentum in this paper. Instead of spending 1 / (number of winner and loser stocks) in each stock (which is the equally weighted method), the return of the individual stock will be multiplied by the market cap of this specific stock, reflecting the allocation in the strategy, divided by the market caps of all winner and loser stocks ensuring it to remain a zero-cost portfolio in the value weighted method.
For robustness purposes, local returns for individual stock momentum for countries will be transformed into euros using:
Momentum return € = (1+R[mom,t,local currency])*( 𝑆[ 𝑘 𝑒,𝑡] 𝑆[𝑘 𝑒,𝑡−1] )– 1 (3.1)
12 Moskowitz, Ooi and Pedersen (2012) explain that most research on momentum encompasses cross-sectional research since it compares securities to each other in the cross-section. Alternatively, time-series momentum looks at the security’s own past returns.
18
R[mom,t,local currency] is the momentum return of each stock index in its local currency, 𝑆[𝑘
𝑒, 𝑡] is the exchange rate of the local currency per euro at time t or t-1and the second part of
the equation thus represents the percentage change in the exchange rate. In case of a positive number, the local currency is depreciating. In real life, investors should take hedging costs into account. As these costs are in general relatively low, they will not be included.
In total, t-tests for four investment strategies will be run for this paper. The first strategy is individual stock momentum where stocks per country and industry are used to determine if momentum exists within the indices. The returns of individual companies within each stock index were used for the momentum return calculations. When looking at the AEX (The Netherlands), for example, all 25 companies listed on the exchange were ranked and the top and bottom 10 percent were tracked for three and six months respectively to create the zero-cost portfolios and obtain their returns. The result is the significance per country or industry. To be able to compare individual stock momentum with the other strategies that rank countries or industries as opposed to companies, a second investment strategy is based on the individual stock momentum strategy to obtain an overall overview; the so-called ‘all industries / all countries’. Here, an average will be taken of the monthly momentum returns across the already ranked companies within the countries and industries (so no additional ranking). The importance of this strategy will become clear in the next chapter when individual stock momentum for industries will be compared to macromomentum. The third strategy is called macromomentum or ‘country / industry’ where the countries or industries themselves will be ranked each month based on the monthly returns of each country or industry. The top and bottom 10 percent13 will be used to create the equally weighted zero-cost portfolio as explained before. The fourth investment strategy is based on the ranking of ETFs. Each MSCI index will
13 In the case of countries, the two best and the two worst performing indices were used as there were 20 countries in this research. For the industries, the (one) best and (one) worst performing indices were used as there were 11 industries used in this paper.
19
be ranked based upon its returns and the top and bottom ten percent will be chosen for this strategy. The null hypothesis for all one-sided t-tests is that the momentum returns are equal to zero:
H0: µ = 0 versus H1: µ ≥ 0 (3.2)
In case of rejection of the hypothesis, evidence suggests that momentum is present. The one-sided t-test with a significance level equal to 0,05 is applied to examine this significance. The corresponding critical value is equal to 1,645 given the degrees of freedom of 213 for 3-month periods and 210 for 6-3-month periods. One-sided tests are chosen since the aim is to find positive momentum returns. Matlab is used to perform statistical calculations and display the accompanying results.
After this process of finding significance, the strategies will be compared using linear regression. As the alpha or intercept tells us which strategy performs better, this variable is used to compare the individual stock momentum strategy with the macromomentum and the macromomentum with the results of the ETFs. On top of that, alpha will also be used to compare the strategies for 3 and 6 months. Alpha, also known as Jensen’s alpha, is the risk-adjusted measure of the past performance of an asset and should in theory be equal to zero (according to CAPM). This paper will test this assumption in practice. If alpha is negative, the asset (in this case: strategy) outperforms the benchmark and vice versa if alpha is positive. The strategy and benchmark differ depending on which investment strategies are compared. The regression looks as follows:
Ri - rf = α + β (Rm - rf) + εi (3.3)
The left-hand term is the excess return of the strategy, β (Rm - rf) is the sensitivity of the stock to the benchmark. Epsilon is the error term and shows the deviation from the best fitting line and is in practice risk that is diversifiable. Hence, it is assumed to be close to zero. Matlab has
20
a special function to immediately obtain the risk-adjusted alpha of the portfolio, namely portalpha.
4. Results and analysis
In this section, the results of the four momentum strategies for countries and industries will be presented and a comparison will be made. Tables and graphs can be found in Appendices 1 and 2. The four investment strategies are named as follows: 1. Individual country or industry stock momentum; directly related to investment strategy one in the previous chapter 2. All countries or all industries; shows the results of the second investment strategy in the previous chapter. 3. Country / industry level (macromomentum) is the outcome of the third investment strategy as mentioned before. 4. MSCI; which will show the returns and significance of the fourth investment strategy from the previous chapter based on ETFs.
4.1 Country momentum
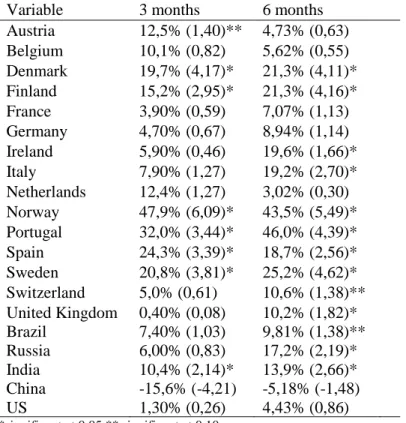
After running t-tests for the twenty countries, the highest individual stock momentum returns (see table 3 with all annualised returns) were found for Norway for three months and Portugal for six months, with the highest returns being equal to 47,9% (t-stat: 5,49) and 46,0% (t-stat: 4,39) respectively. Besides Norway and Portugal, Denmark, Finland, India, Spain and Sweden show significant results for all J/K-strategies. Whether the WML-portfolios were ranked after three or six months and held for the same duration did not matter for their results. They clearly always reject the null hypothesis that the average returns are equal to 0. Ireland, Italy, the United Kingdom and Russia are always significant w hen J/K = 6, but not when J/K = 3 (also for Brazil and Switzerland when alpha is 10 percent). Austria is only significant at 10 percent when J/K is 3 months. All the countries with significant results for both J/Ks have higher momentum returns for six months than for three months, except for Norway and Spain.
21
These results are in line with the research done before namely that the momentum results are present between three to six months and mean reversal will take place after. Bhojraj and Swaminathan (2006) mention that momentum for liquid financial markets is significant for a period of one year before reversal takes place. The countries with significant results are indeed liquid financial markets. However, some of the other liquid financial markets did not find significant results. Nijman et al. (2004) found significant results for Denmark, France and the United Kingdom. It seems that Denmark continuously obtains significant momentum returns across different time periods. Chui et al. also found significant momentum returns for the countries in this research. They reason that more individualistic countries show more significant momentum returns. However, the countries with significant momentum results are not necessarily the countries that score high on individualism based on Hofstede’s country comparison. It is interesting that Portugal is one of the most collectivistic countries in Europe according to Hofstede, but it is also the country with consistent and high significant momentum returns. When taking a closer look at Portugal’s momentum results, it becomes evident that one of the companies that is doing consistently well has a stock price of less than 20 eurocents and something similar occurred in Norway. Thus, an increase or decrease in percentages is relatively big. A value weighted approach will be tested below to take this effect into account.
Rouwenhorst (1998) also used equally weighted portfolios and found similar results, though he did not rebalance at the end of each month. To be more precise, Rouwenhorst found significant results for each country he examined except for Sweden. He found strongest momentum effects for Spain, the Netherlands, Belgium and Denmark. Although these results only partially hold in this research, I agree and disagree with the author that momentum is not due to country-specific risk. Why? Because the countries that have significant results are similar: all Scandinavian countries have significant results, so do the Iberian countries included in this research. The difference is that the Scandinavian countries all have higher t-statistics
22
compared to the Southern countries, making grouping likely. However, not all countries or groups of countries have significant results, making the significance likely dependent upon individual characteristics (as is in line with Chan, Hameed and Tong, 2000).
When focussing on BRIC, the results are not in line with the results obtained by Griffin, Ji and Martin who found significant momentum returns for each of the BRIC countries (2003), whereas this research only shows that India, Brazil and Russia are (partly) significant. China does not have significant results for the whole period, which could be explained by its market peculiarities. Russia has significant results for six months and India shows significant momentum returns for all J/K. Since India has been growing a lot since 2000 (World Bank Database), even more steadily than Russia and Brazil, evidence suggests that there might be correlation between the economic cycle in India and its momentum results. The null hypothesis is rejected in Brazil for J/K = 6 and at 10%. Chan, Hameed and Tong also showed that emerging markets have momentum profits, which can be explained by the fact that they have higher autocorrelation and are therefore more predictable. However, the emerging markets have different market conditions than back in 2000 when most of the papers were published.
[ Table 3 here ]
As a robustness check, the six countries that do not have the euro as a currency will have their momentum results transformed into euros and a t-test will be run again, see table 4. The numbers in bold are the numbers that increased compared to the results in local currency, the numbers underlined decreased. Depending on the exchange rate, whether it depreciated or appreciated, the average returns have changed. The t-statistic for most countries went up implying that the p-value became lower. A higher t-statistic and a lower p-value imply that there is more evidence against the null hypothesis (or rejecting the null hypothesis). The countries that had significant results in their local currency, have similar results when
23
transformed into euros without hedging costs taken into consideration in this paper. When taking hedging costs into account these results may differ.
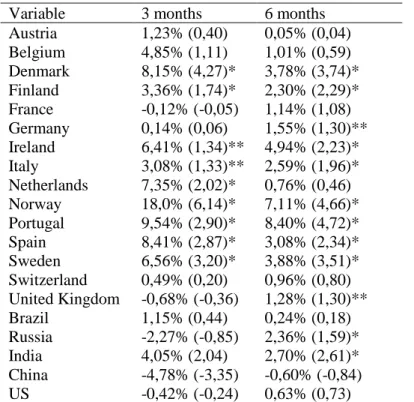
The significance results for the value weighted returns (see table 5) and the equally weighted returns are akin, except for Austria without significant values anymore, the Netherlands which became significant and Germany which became significant for 6 months at 10 percent. Ireland and Italy became significant at 10 percent for 3 months and the UK for 6 months. Switzerland and Brazil were no longer significant. The most important results are that the high average returns of Norway and Portugal went from approximately 40-50% to 10-20% due to the value weighted method. It seems that these countries had lower individual stock value. Therefore, high momentum returns are offset by the nominal value / market capitalisation of this stock. Although Denmark and Finland did not have values as high before, their average returns also decreased significantly from around 20% to less than 10%. In fact, the overall range decreased. This result is in line with Chan, Hameed and Tong (2000) who found that the profits of market capitalisation-based strategies are lower than the momentum strategies not based on the market cap. They also find that the results from value weighted strategies remain significant.
[ Tables 4 and 5 here ]
Besides looking at individual stock momentum, where each company within each country was ranked, this paper also examined whether momentum was present among all companies together and among the indices (see table 6). It turns out that momentum significance can be found for both individual stock momentum across all countries (‘all countries’) and macromomentum (country). The MSCI was not significant implying that using strategies based on countries might be more useful than strategies based on ETFs. If so, this will be confirmed by table 7. Bhojraj and Swaminathan (2006) came to similar conclusions based on developed (and thus liquid) country indices. Tse (2015) also found similar results regarding MSCI; namely no significance.
24
[ Table 6 here ]
As mentioned before, Jensen’s alpha is used to determine which strategy performs better based on formula 3.3. All countries will no longer be used as each subsection of the individual stock momentum strategy (equally weighted, value weighted, euro) will be compared with macromomentum. First, the different strategies were compared for each holding period. The upper part of table 7, panel A, shows these results. The second word is the benchmark, whereas the word that was placed first is the strategy to be compared with the benchmark. For example, when comparing the value weighted returns with the equally weighted returns, the negative alpha suggests that the former performs worse than the latter. In terms of the formula, Ri = value weighted momentum, rf = risk free rate, Rm = equally weighted momentum. Given that the range of the value weighted returns is smaller than the equally weighted, this could be a logical result. Looking at graphs 3 and 4 shown in Appendix 2, they seem to support the results, namely for both holding periods of three and six months in the long run the accumulated value weighted portfolios perform worse than the equally weighted portfolios and macromomentum portfolios (in the graph called ‘indices’), that equally weighted portfolios perform better than macromomentum and MSCI performs worse than macromomentum. Derive from the accumulated graphs that the macromomentum outperforms the value weighted returns for the holding period of 3 months. Overall, the graphs suggest that the equally weighted individual stock momentum performs significantly better than other strategies. In short, for both holding periods of three and six months, it appears that just sorting the countries’ returns is not enough. Sorting companies within countries seems to be a better strategy. The negative alpha for the MSCI implies that it would be better to sort and use country indices than ETFs.
In the lower table, panel B, a comparison was made between the 3- and 6-month holding periods starting at period 7 (necessary since the 6-month holding period only starts at t=7) to see which holding period is better. The 3-month holding period was the benchmark (Rm in
25
formula 3.3). Thus, the 6-month holding period (Ri) performed better for all strategies, since all alphas were positive, except for at country level where alpha is negative implying that in this case the short term performs better. The other results appear to be in line with previously published research which showed that from 0 – 6 months, the longer holding period performs better. After 6 months, other authors find evidence for mean reversal.
[ Table 7 here ]
4.2 Industry momentum
The eleven industries were tested for the whole period and results can be found in table 8. Energy shows the highest significant momentum return for three and six months with returns of 44,9% (t-stat: 3,61) and 53,6% (t-stat: 4,53) respectively. When looking at three months, all industries except Materials and Utilities have consistent, significant momentum returns. For six months, all sectors except Utilities show significant results at a significance level of 5 percent. The question is why all industries perform so well except for Utilities and Materials for three months. The results are partly in line with Nijman et al, who found significant results for Retail, Food & Drug retail and Pharmaceuticals (90% significance level) and Commercial Services and Supplies, Hotels and Technology Hardware & Equipment (95% significance level) as mentioned before. Notice that Food & Drug Retail and Technology are no longer significant. It is important to keep in mind that Nijman et al. used subsectors within the eleven industries used in this research, making it harder to compare.
Moskowitz and Grinblatt (1999) used the so-called ‘industry neutral’ portfolios when referring to the method of individual stock momentum used in this research. Overall, they show that industries are important in obtaining momentum profits, which is in line with the results found in table 9. Nevertheless, their focus is looking at top and bottom performing stocks among all industries. When they examine the industry neutral portfolios, they also look at the macromomentum as reason behind the results and find similar significant outcomes as this
26
study. As mentioned before, Nijman et al. found opposite results from Moskowitz and Grinblatt. The difference in methodology might be an explanation as for why they concluded the opposite. Rouwenhorst (1998) performed a similar industry based individual stock momentum research. However, he used seven industries as taken from the Financial Times Actuaries as opposed to the GICS from MSCI. Thus, his results are not completely comparable to the results below. Significant results were found for Basic Industries (comparable to Industrials), Capital Goods (part of Industrials) and Finance. He could not reject the null for Energy, Transportation and Utilities. Overall, it seems likely that momentum among industries is present both on individual stock level and macromomentum level.
No significant evidence (table 9) was found for the ETFs on these industries, in line with Tse’s (2015) non-significant results for US ETFs and not in line with Andreu’s et al. (2013) results who did find momentum among ETFs to be significant. In practice, it will be hard to compare this research with these two papers since they used US ETFs whereas this paper uses European ETFs. In summary, it is hard to compare the results from this research with other papers since there are no other papers on the MSCI GICS in Europe.
[ Tables 8 and 9 here ]
Table 10 shows the alpha for the different strategies and different holding periods, this time for the industries. It will now become clear why ‘all industries’ was used to compare individual stock momentum with macromomentum as will be determined if it is more attractive to rank all companies within the indices or to just rank the industries. The upper part of table 10, panel A, suggests that macromomentum for industries performs worse than individual stock momentum among industries, the exact opposite of what Moskowitz and Grinblatt (1999) concluded when they found that macromomentum (in the graph called indices) always subsumed individual stock momentum (in the graph called ‘equally weighted’) for every holding period. Thus, evidence suggests that only ranking industries seems to be inadequate.
27
Graphs 7 and 8 in Appendix 2 partly confirm these results. The accumulated returns for six months show that macromomentum is always subsumed by individual stock momentum. Interestingly, the accumulated returns in graph 7 show that ranking indices outperform the individual stock momentum in the short run, but have a reversed effect in the long run. This difference can also be seen in panel A of table 10 where the alpha for the 6-month holding period is almost 10% and the alpha for 3-month holding period is less than 1%. The accumulated industry graphs (7 and 8) in Appendix 2 display that the macromomentum always outperforms the ETFs although they seem to start off following a similar path in the first few months which is in line with was found in table 10; a bigger alpha for 3 months. In short, it seems insufficient to sort and rank the industries as opposed to ranking each single company, however it is sufficient compared to the ETFs.
Contrarily to the country holding period comparison that shows the 6-month holding period to perform better than the 3-month one on all levels except the macromomentum level, industries have different results (see table 10, panel B). Although the 6-month holding period outperforms the 3 month one for all industries, the 3-month holding period outperforms the longer run holding period on macromomentum and ETF level. Thus, the data suggests that a short-term holding period would be a better strategy.
[ Table 10 here ]
5. Conclusion and limitations
This paper focused on different stock momentum strategies for holding periods of three and six months: individual stock momentum of companies across countries and industries (ranking companies inside each index giving the individual results or taking an average of these ranked companies to get an overall macro strategy), macromomentum across countries and industries (ranking country or industry indices) and ETFs among the same countries and
28
industries (ranking the ETFs). The results suggest that individual momentum is present in clusters of countries with similar characteristics, especially the Northern and Iberian countries. For BRIC, only India seems to consistently show significant results. Momentum is also present in macromomentum. The results did not show momentum to be present among ETFs. Interestingly, the equally weighted individual stock momentum always subsumes the macromomentum. Value weighted individual stock momentum only outperforms macromomentum for short holding periods of 3 months. Comparing the different strategies using alpha, the results suggest that sorting the countries is not enough. Results can potentially be better by sorting the companies inside the countries. However, the alpha of ETFs compared to momentum based on ranked countries indicates using the latter. Besides, the 6-month holding period has a positive alpha in comparison to the 3-month holding period, suggesting the long-term holding period to be preferred.
For industries, it seems that momentum is present among most of the industries based on individual stock momentum and on macromomentum. Once again, no significant results were found for ETFs suggesting that the null hypothesis cannot be rejected. When comparing the two significant strategies based on alpha, it seems as if macromomentum is always subsumed by individual stock momentum; comparable to the results found for countries. The results in this study indicate that individual stock momentum is a better trading strategy than macromomentum or ETFs and is also affirmed by the graphs in Appendix 2 which play an important role in analysing the results from the tables.
However, there are some limitations to this research. This study compares the MSCI of each country and industry with the local stock index of each country and industry. In practice, the local indices and the MSCI indices may differ. Nevertheless, it is assumed that they are closely related. Moreover, hedging and transaction costs were not included. Returns that seem
29
profitable may no longer be relevant when allowing for such costs. For example, this paper suggests that individual stock momentum in most cases subsumes macromomentum. Yet, considering all the transactions involved in shorting and longing all the individual stocks instead of indices might offset these results. Furthermore, hedging costs should be included when transforming local currencies into euros as the results may now also depend on the exchange rate and not only on the specific individual momentum returns. Thirdly, this dataset is based on the whole period as of 2000 until 2018. The outcome might change if one examines subperiods to control for example for the period of the financial crisis and see how they affected. Lastly, the focus lied at finding statistical evidence for momentum returns. However, another important question is: what explains the results found in this research? The reasoning behind the evidence is an interesting topic for future research.
30
References
Abourachid, Halim, Alexander Kubo, and Sven Orbach. 2017. "Momentum strategies in European equity markets: Perspectives on the recent financial and European debt crises." Finance Research Letters 23.
Andreu, L., and L. Swinkels. "Tjong-A-Tjoe, L. 2013. Can exchange traded funds be used to exploit industry and country momentum." Financial Markets and Portfolio Management 27.2
Berk, J. and DeMarzo, P. (n.d.). Corporate finance. 3rd ed. Pearson.
Bhojraj, Sanjeev, and Bhaskaran Swaminathan. 2006. "Macromomentum: returns predictability in
international equity indices." The Journal of Business 79.1.
Brooks, Chirs. 2008. "Introductory financial econometrics."
Cakici, Nusret, Yi Tang, and An Yan. 2016. "Do the size, value, and momentum factors drive stock returns in emerging markets?" Journal of International Money and Finance 69.
Carhart, Mark M. 1997. "On persistence in mutual fund performance." The Journal of finance 52.1. Chan, Kalok, Allaudeen Hameed, and Wilson Tong. 2000. "Profitability of momentum strategies in the
international equity markets." Journal of financial and quantitative analysis 35.2.
Chan, Louis KC, Narasimhan Jegadeesh, and Josef Lakonishok. 1996. "Momentum strategies." The Journal of Finance 51.5.
Chordia, Tarun, and Lakshmanan Shivakumar. 2002. "Momentum, business cycle, and time‐varying expected returns." The Journal of Finance 57.2.
Chui, Andy CW, Sheridan Titman, and KC John Wei. 2010. "Individualism and momentum around the world." The Journal of Finance 65.1.
De Bondt, Werner FM, and Richard Thaler. 1985. "Does the stock market overreact?" The Journal of Finance 40.3.
Eid Júnior, William, and Ricardo Ratner Rochman. 2006. "Analysts’ recommendations in Brazil: do they add value?"
Fama, Eugene F., and Kenneth R. French. 2012. "Size, value, and momentum in international stock returns." Journal of financial economics 105.3.
Fama, Eugene F., and Kenneth R. French. 1993. "Common risk factors in the returns on stocks and bonds." Journal of financial economics 33.1.
Fresno, Blanca González del. 2018. “The Largest Stock Markets in the World | BBVA.” BBVA
NOTICIAS, 14 Mar. 2018, www.bbva.com/en/the-largest-stock-markets-in-the-world/.
Geczy, Christopher C., and Mikhail Samonov. 2016. "Two centuries of price-return momentum." Financial Analysts Journal 72.5.
Griffin, John M., Xiuqing Ji, and J. Spencer Martin. 2003. "Momentum investing and business cycle risk: Evidence from pole to pole." The Journal of Finance 58.6.
Grinblatt, Mark, and Tobias J. Moskowitz. 2004. "Predicting stock price movements from past returns: The role of consistency and tax-loss selling." Journal of Financial Economics 71.3.
Grundy, Bruce D., and J. Spencer Martin. 2001. "Understanding the nature of the risks and the source of the rewards to momentum investing." The Review of Financial Studies 14.1.
Hofstede, Geert. 2003. “Culture's consequences: Comparing values, behaviors, institutions and organizations across nations.” Sage publications.
Hvidkjaer, Soeren. 2006. "A trade-based analysis of momentum." The Review of Financial Studies 19.2 Hong, Harrison, and Jeremy C. Stein. 1999. "A unified theory of underreaction, momentum trading, and
overreaction in asset markets." The Journal of finance 54.6.
Jegadeesh, Narasimhan, and Sheridan Titman. 2001. "Profitability of momentum strategies: An evaluation of alternative explanations." The Journal of Finance 56.2.
Jegadeesh, Narasimhan, and Sheridan Titman. 1993. "Returns to buying winners and selling losers: Implications for stock market efficiency." The Journal of Finance 48.1.
Kość, Krzysztof, Paweł Sakowski, and Robert Ślepaczuk. 2018. “Momentum and contrarian effects on the cryptocurrency market.” University of Warsaw Working Paper 9-18
31
Lebovic, James H. 1994. "Before the Storm: momentum and the onset of the Gulf War." International Studies Quarterly 38.3.
Martin, W. 2017. “Bitcoin steadies after a roller-coaster Christmas.” Business Insider, December 17.
https://www.businessinsider.nl/bitcoin-price-december-27-2017-12/?international=true&r=UK
Morgan Stanley Capital International. 2016. “Exchange Traded Products based on MSCI Indexes.”
https://www.msci.com/documents/1296102/1360895/msci-GLOBAL-ETFB_Q4-2016_cbr-en.pdf/6aa763a6-c4c4-4e3a-9d70-d288a2c203aa
Moskowitz, Tobias J., Yao Hua Ooi, and Lasse Heje Pedersen. 2012. "Time series momentum." Journal of financial economics 104.2.
Moskowitz, Tobias J., and Mark Grinblatt. 1999. "Do industries explain momentum?." The Journal of Finance 54.4
Nijman, Theo, Laurens Swinkels, and Marno Verbeek. 2004. "Do countries or industries explain momentum in Europe?." Journal of Empirical Finance 11.4.
Rohrbach, Janick, Silvan Suremann, and Joerg Osterrieder. 2017. "Momentum and trend following
trading strategies for currencies revisited-combining academia and industry."
https://papers.ssrn.com/sol3/papers.cfm?abstract_id=2949379
Rosenbaum, E. 2018. “Vanguard group eliminates trading fees on almost all ETFs – including funds
from most of its rivals.” CNBC, July 2.
https://www.cnbc.com/2018/07/02/vanguard-slashing-costs-on-nearly-all-etfs-even-rival-schwab.html
Rouwenhorst, K. Geert. 1998. "International momentum strategies." The Journal of Finance 53.1. Sagi, Jacob S., and Mark S. Seasholes. 2007. "Firm-specific attributes and the cross-section of
momentum." Journal of Financial Economics 84.2.
The Wall Street Journal. 2018. “Market Data Center”. December 19.
http://www.wsj.com/mdc/public/page/2_3022-intlstkidx.html
Tse, Yiuman. 2015. "Momentum strategies with stock index exchange-traded funds." The North American Journal of Economics and Finance 33.
Yara, Fahiz Baba, Martijn Boons, and Andrea Tamoni. 2018. "Value Timing: Risk and Return Across Asset Classes."
32
Appendix 1 Tables
Table 1 Summary Statistics
This table summarises the results of all companies per local index for the period January 2000 – January 2018. Not all companies reported returns for each month. However, the deciles were based on the number of companies with reported returns. The number of companies is the quantity of companies per stock index, currency shows the abbreviation of each local currency, the mean is of all monthly returns for the specific index.
Variable # Companies Currency Mean Volatility Max Min
Austria 20 EUR 0,49% 9,61% 59,91% -103,28% Belgium 19 EUR 0,39% 8,84% 58,65% -158,72% Denmark 135 DKK 0,10% 11,78% 204,98% -213,39% Finland 134 EUR 0,09% 11,87% 710,04% -190,76% France 40 EUR 0,20% 9,20% 62,32% -70,98% Germany 30 EUR 0,30% 9,72% 85,15% -78,42% Ireland 44 EUR -0,18% 15,80% 160,94% -172,36% Italy 38 EUR -0,09% 9,46% 62,21% -80,47% Netherlands 25 EUR 0,31% 10,04% 59,54% -116,05% Norway 171 NOK -0,45% 16,24% 241,12% -293,12% Portugal 18 EUR 0,13% 9,74% 71,00% -71,09% Spain 34 EUR 0,25% 9,38% 68,74% -160,94% Sweden 336 SEK 0,34% 12,23% 144,92% -151,95% Switzerland 20 CHF 0,24% 8,63% 114,32% -89,19% United Kingdom 101 GBP 0,53% 9,01% 85,64% -152,10% Brazil 67 BRL 0,91% 11,85% 164,33% -114,28% Russia 45 RUB 0,91% 13,55% 88,97% -160,57% India 500 INR 0,14% 14,67% 309,24% -226,29% China 1367 CNY 0,33% 14,46% 238,61% -131,61% US 506 USD 0,73% 10,34% 144,28% -169,39%
Table 2 Summary Statistics
This table summarises the results of all companies per industry group for the period January 2000 – January 2018. However, the deciles were based on the number of companies with reported returns. The number of companies is the quantity of companies per stock index, the mean is of all monthly returns for the specific index.
Variable # Companies Mean Volatility Max Min
Energy 69 -1,34% 16,74% 241,12% -226,25% Materials 115 0,30% 13,43% 710,04% -293,12% Industrials 247 0,27% 11,81% 204,98% -213,39% Consumer Discretionary 149 0,29% 10,95% 146,02% -114,10% Consumer Staples 96 0,55% 8,95% 97,39% -159,24% Health Care 108 0,35% 12,75% 144,92% -213,76% Financials 169 0,09% 10,62% 187,93% -197,55% Information Technology 69 -0,13% 14,59% 102,59% -114,81% Telecommunication Services 39 -0,36% 11,92% 109,86% -88,44% Utilities 29 0,14% 7,65% 68,71% -105,55% Real Estate 70 0,32% 11,46% 150,41% -168,69%
33 Table 3 Individual Country Momentum
Average annualised returns per country in alphabetic order for the whole period January 2000 – January 2018. In between parentheses, the t-statistic can be found.
Variable 3 months 6 months
Austria 12,5% (1,40)** 4,73% (0,63) Belgium 10,1% (0,82) 5,62% (0,55) Denmark 19,7% (4,17)* 21,3% (4,11)* Finland 15,2% (2,95)* 21,3% (4,16)* France 3,90% (0,59) 7,07% (1,13) Germany 4,70% (0,67) 8,94% (1,14) Ireland 5,90% (0,46) 19,6% (1,66)* Italy 7,90% (1,27) 19,2% (2,70)* Netherlands 12,4% (1,27) 3,02% (0,30) Norway 47,9% (6,09)* 43,5% (5,49)* Portugal 32,0% (3,44)* 46,0% (4,39)* Spain 24,3% (3,39)* 18,7% (2,56)* Sweden 20,8% (3,81)* 25,2% (4,62)* Switzerland 5,0% (0,61) 10,6% (1,38)** United Kingdom Brazil Russia India China US 0,40% (0,08) 7,40% (1,03) 6,00% (0,83) 10,4% (2,14)* -15,6% (-4,21) 1,30% (0,26) 10,2% (1,82)* 9,81% (1,38)** 17,2% (2,19)* 13,9% (2,66)* -5,18% (-1,48) 4,43% (0,86) *significant at 0.05 ** significant at 0.10
Table 4 Individual Country Momentum in Euros
Average annualised returns per country in euros for countries which do not have the euro as local currency for the whole period January 2000 – January 2018. In between parentheses, the t-statistic can be found. In case the value is bold, the value is higher than the values in the local currency as stated above. The values underlined are the values lower than in the previous table. Most results have increased.
Variable 3 months 6 months
Denmark 19,7% (4,17)* 21,2% (4,11)* Norway 48,5% (6,09)* 43,8% (5,50)* Sweden 21,2% (3,86)* 25,6% (4,65)* Switzerland 4,18% (0,51) 10,1% (1,32)** United Kingdom Brazil Russia India China US 1,14% (0,22) 9,91% (1,33)** 9,03% (1,19) 11,8% (2,37)* -15,5% (-4,09) 1,53% (0,32) 10,7% (1,89)* 11,4% (1,60)** 19,3% (2,42)* 14,5% (2,77)* -5,10% (-1,45) 4,52% (0,88) *significant at 0.05 ** significant at 0.10
34 Table 5 Individual Country Momentum Value weighted
Average annualised returns per country in alphabetic order for the whole period January 2000 – January 2018. In between parentheses, the t-statistic can be found.
Variable 3 months 6 months
Austria 1,23% (0,40) 0,05% (0,04) Belgium 4,85% (1,11) 1,01% (0,59) Denmark 8,15% (4,27)* 3,78% (3,74)* Finland 3,36% (1,74)* 2,30% (2,29)* France -0,12% (-0,05) 1,14% (1,08) Germany 0,14% (0,06) 1,55% (1,30)** Ireland 6,41% (1,34)** 4,94% (2,23)* Italy 3,08% (1,33)** 2,59% (1,96)* Netherlands 7,35% (2,02)* 0,76% (0,46) Norway 18,0% (6,14)* 7,11% (4,66)* Portugal 9,54% (2,90)* 8,40% (4,72)* Spain 8,41% (2,87)* 3,08% (2,34)* Sweden 6,56% (3,20)* 3,88% (3,51)* Switzerland 0,49% (0,20) 0,96% (0,80) United Kingdom Brazil Russia India China US -0,68% (-0,36) 1,15% (0,44) -2,27% (-0,85) 4,05% (2,04) -4,78% (-3,35) -0,42% (-0,24) 1,28% (1,30)** 0,24% (0,18) 2,36% (1,59)* 2,70% (2,61)* -0,60% (-0,84) 0,63% (0,73) *significant at 0.05 ** significant at 0.10
Table 6 Country and MSCI momentum
Average annualised returns for all countries based on the individual stock momentum put together, for macromomentum where indices were ranked and for all ranked MSCIs for the whole period January 2000 – January 2018. In between parentheses, the t-statistic can be found. ‘All countries’ is based on the average momentum returns across companies inside countries, country is based on the ranking of the countries and MSCI shows the outcome of using ETFs as a momentum investment strategy instead of stock indices. Significant results suggest that there exists evidence for momentum among all countries and country, but not for MSCIs.
Variable 3 months 6 months
All countries 11,6% (3,35)* 15,24% (4,06)* Country 5,20% (1,77)* 1,04% (2,00)* MSCI -2,20% (-0,74) 0,54% (0,83)
*significant at 0.05 ** significant at 0.10
Table 7 Alpha
The alpha or the intercept for several comparing strategies. Matlab’s portalpha was used to derive the following results. This table shows the different trading strategies and their performance among each holding period of three and six months. The first word in the sequence (before vs) is the asset to be compared with the benchmark, Ri. The second word (after vs) is the benchmark, in formula 3.3 equal to Rm.
35 Panel A
Variable 3 months 6 months
Value weighted vs equally weighted Equally weighted vs country Value weighted vs country -1,97% 1,78% -0,2% -6,42% 7,10% 0,68% MSCI vs country -1,68% -0,25%
This part shows the alpha to determine which holding period performed better for each strategy, thus the 3-month returns is the benchmark (Rm) and the 6-month returns is the holding period to be compared. Overall, the longer-term holding periods have higher alphas implying that they are better strategies.
Panel B Variable All countries equally weighted All countries in euros All countries value weighted Country level 4,53% 4,56% 0,15% -0,76% MSCI 0,69%
Table 8 Individual Industry Momentum
Average annualised returns per industry for the period January 2000 – January 2018. In between parentheses, the t-statistic can be found.
Variable 3 months 6 months
Energy Materials Industrials Consumer Discretionary Consumer Staples Health Care Financials IT Telecom Utilities Real Estate 44,9% (3,61)* 7,56% (1,23) 22,5% (5,31)* 17,7% (3,44)* 13,0% (2,89)* 15,8% (2,71)* 11,9% (2,10)* 12,8% (1,72)* 22,0% (2,30)* -0,48% (-0,08) 20,0% (2,02)* 53,6% (4,53)* 15,6% (2,56)* 22,6% (5,65)* 20,6% (4,00)* 14,0% (2,59)* 14,6% (2,33)* 16,3% (2,91)* 15,1% (2,05)* 25,4% (2,71)* 2,05% (0,31) 37,4% (3,76)* *significant at 0.05 ** significant at 0.10