VALIDATION STUDY OF THE PORTUGUESE VERSION OF THE QLC-C30-V.3
J. Pais-Ribeiro1, C. Pinto2& C. Santos2
1Porto University;2Escola Superior de Enfermagem - I.Politécnico do Porto
_________________________________________________________________________________________________________________________________
ABSTRACT: The purpose of this research was to study the metric properties of the Portuguese translation of the European Organization for Research and Treatment of Cancer Quality of Life Questionnaire Core-30 (EORTC QLQ-C30, version 3). A heterogeneous cancer patient sample of 933 subjects, 61.5% female, mean age 54.24 years, mean school age years of 6.9 years, with a diagnosis from one month to 31 years, was used. The questionnaire seems to be sensitive to cancer sites but not to the number of years with the disease.
Mean values for the scales, and reliability are appropriate and show similar patterns to other versions from different cultures and languages. Correlations between scales show moderate correlations suggesting that they measure different and complementary constructs, which constitute important information for clinicians in the follow-up of this population. We can say that the Portuguese version of the QLQ-C30 has good metric properties, and measures the same constructs, the same way, as the versions from other languages and cultures, and it is appropriate to be applied to people with cancer disease
Key words: EORTC QLQ-C30, Cancer disease, Quality of life.
_________________________________________________________________________________________________________________________________
ESTUDO DE VALIDAÇÃO DA VERSÃO PORTUGUESA DO QLQ-C30-V.3 RESUMO: O objective da presente investigação é estudar as propriedades métricas da versão Portuguesa do questionário de qualidade de vida da European Organization for Research and Treatment of Cancer Quality of Life Questionnaire Core-30 (EORTC QLQ-C30, version 3). Participu uma amostra heterogénea de 933 indivíduos com diagnóstico de cancro, 61,5% mulheres, idade média de 54,24 anos, escolaridade média de 6,9 anos, com diagnóstico de cancro entre um mês e 31 anos. O questionário parece ser sensível à localização do cancro mas não ao número de anos com a doença. Os valores médios das escalas e a fidelidade são apropriadas e mostram um padrão semelhante a outras versões de diferentes línguas e culturas. Correlações entre escalas mostram correlações moderadas o que sugere que elas medem construtos diferentes mas complementares, o que constitui informação importante para os clínicos que seguem estes doentes. Podemos dizer que a versão portuguesa do QLQ-C30 possui boas propriedades métricas, e que mede, os mesmos constructos, do mesmo modo, que as versões noutras línguas e culturas, e que é apropriada para ser aplicada com pessoas com cancro
Palavras-chave: EORTC QLQ-C30, Doença oncológica, Qualidade de vida.
_________________________________________________________________________________________________________________________________ Recebido em 30 de Outubro de 2007 / aceite em 12 de Dezembro de 2007 Cancer is an important public health issue for many reasons: because it is the se-cond cause of death in the developed countries including Portugal; because it is an
age related disease namely because “age is also a primary risk factor for most can-cers, with about 77% of all cancers diagnosed among people aged 55 or older” (CDC, 2004, p.2); and because the population in general is worried with the possibility of developing the disease. A survey in Portugal showed that 63% of the surveyed po-pulation worried with the risk of having a cancer disease (Cabral, da Silva & Men-des, 2002).
Largely due to innovations in medical technology, there has been a remarkable reduction in deaths associated with cancer, and more people diagnosed with cancer survive each year: then cancer becomes a chronic disease, and Quality of Life beco-mes an important end point for this disease.
In an attempt to examine “quality of life” (QoL) as a specified construct, can-cer investigators have administered specific or generic instruments such as the European Organization for the Research and Treatment of Cancer (EORTC) – QLQ-C30 Questionnaire (Aaronson, Ahmedzai, & Bergman, 1993), widely-used in QoL research and have well-established norms derived from adult cancer po-pulations. The EORTC is an international non-profit organization aiming to con-duct, develop, coordinate and stimulate cancer research carried out in Europe. The group focused QoL in 1980 with the creation of the QoL Group, and initiated the research programme in 1986. They develop the first questionnaire (the EORTC QLQ-C36) designed to be a) cancer specific, b) multidimensional in structure, c) appropriate for self administration (i.e. brief and easy to complete), d) applicable across a range of cultural settings.
To use the QLQ-C30 the researcher needs to sign user’s agreement to gua-rantee a certain number of points important for the organization, namely that it is used appropriately, that no changes are made to the contents of the question-naire and the basic scoring algorithm. The QLQ-C30 is a generic module for all cancers, and they have also supplementary modules to add to the main module, to assess specific cancers or conditions (namely body image or satisfaction with treatments).
The aim of the present study is to describe the metric properties of the QLQ-C30 (version 3.0) questionnaire in a sample of Portuguese participants.
METHOD Participants
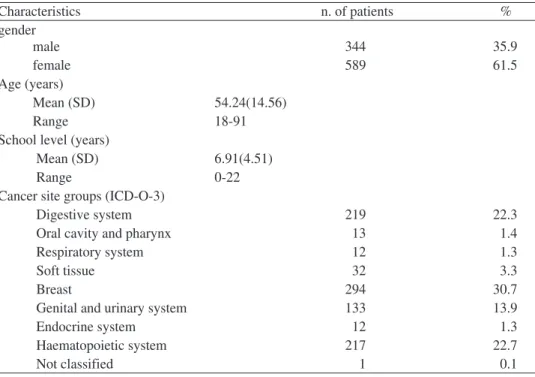
Includes 933 persons with the characteristics reported in table 1. They consti-tute a heterogeneous cancer patient sample with at least one month after diagnosis of cancer until 31 years after diagnosis. The characteristics of the sample are shown in table 1
Table 1- Demographic and clinical characteristics of the study sample (n=933) Characteristics n. of patients % gender male 344 35.9 female 589 61.5 Age (years) Mean (SD) 54.24(14.56) Range 18-91
School level (years)
Mean (SD) 6.91(4.51)
Range 0-22
Cancer site groups (ICD-O-3)
Digestive system 219 22.3
Oral cavity and pharynx 13 1.4
Respiratory system 12 1.3
Soft tissue 32 3.3
Breast 294 30.7
Genital and urinary system 133 13.9
Endocrine system 12 1.3
Haematopoietic system 217 22.7
Not classified 1 0.1
The site groups for primary cancer, according to the Portuguese Registration (RORENO), and based on the International Classification of Diseases for Oncology ICD-O-3 show that nearly 90% of the sample have cancer in four site groups, Di-gestive system, Breast, Genital and urinary system, and Haematopoietic system.
Based on time of diagnosis we divide the sample in three groups of cancer survivorship: this is a term that has come to represent the state or process of living following a diagnosis of cancer, regardless of how long a person lives. When vie-wed as a continual, dynamic, and ever-changing process that begins at the moment of diagnosis and continues for the remainder of life, cancer survivorship can be de-fined as the experience of “living with, through, or beyond cancer” (Leigh, 1992). Mullan (1985) was one of the first to discuss the experience of cancer in terms of a progression of events or stages. He proposed a model of survival that includes three stages: “acute,” “extended,” and “permanent.” The acute stage begins with diagnosis and spans the time of further diagnostic and treatment efforts. The ex-tended stage of survival begins when the survivor goes into remission or has com-pleted treatment. The permanent stage is defined as a time when the activity of the disease or likelihood of its return is sufficiently small that the cancer can now be considered permanently arrested. Bloom (2002) proposed that the first stage run from the diagnosis through the first year, and generally includes treatment; the se-cond stage extends from the end of the first year following diagnosis until appro-ximately three years later, and the third stage from three years out. Our sample includes, in the acute stage 49.7% of the persons, extended stage, 16.1%, and per-manent stage 34.2% persons.
Material
QoL was assessed using the Portuguese (European) version of the EORTC QLQ-C30 (v. 3.0) with permission by the EORCT Quality of Life Group. It is a 30-item questionnaire, twenty-four of the 30-items form nine multi-30-item scales and six 30-items are single-item symptom measures. The scales are constructed by summation of the scores on the items. Multi-item subscales and single items intent to reflect the mul-tidimensionality of the QoL construct, namely: five functional subscales (physical, role, cognitive, emotional, and social); a global health/QoL subscale; three symptom subscales (fatigue, pain, and nausea/vomiting); and single items for the assessment of additional symptoms commonly reported by cancer patients (dyspnoea, appetite loss, sleep disturbance, constipation, and diarrhoea); one more item related to the perceived financial impact of cancer and cancer treatment. All the items scales are scored on 4-point Likert type scales ranging from 1 `not at all' to 4 `very much', ex-cept the two items of the global health/QoL subscale, that uses a modified 7-point li-near analogue scales. The questionnaire takes about 12 minutes to complete. All of the scales and single item scales range in score from 0 to 100. A high score for func-tional scales and global health status/QoL represents high/healthy level of functioning and QoL. A high score for a symptom scale/item represents a high level of sympto-matology or problems.
It is a questionnaire used or considered appropriate for use with cancer patients from the moment of diagnosis to long survivorship (Fehlauer, Tribius, Mehnert,& Rades, 2005; Goodwin, Black, Bordeleau, & Ganz, 2003; Lipscomb et. al, 2004; Mandelblatt, Armetta, Yabroff, Liang,& Lawrence, 2004; Mandelblatt, et al. 2006; Parsons, & Brown, 1998; Zebrack, & Zeltzer, 2003). It has been used with general population also (Hjermstad, Fayers, Bjordal, & Kaasa, 1998). Fayers, Hand, Bjordal, e Groenvold, (1997) explain that QoL symptom items can be considered as causal in-dicators for QoL (like vomiting), others are effective inin-dicators like functional subs-cales and global health/QoL. These divisions have implications for psychometric analysis (Bolen & Lenox, 1991).
It is a status questionnaire asking how the patient feels during the last week. Patients completed the questionnaires primarily themselves, following the order of basic demographic information, and EORTC QLQ-C30: a trained assistant helped those who had difficulties in reading and answering the questions by reading ques-tions and answers without further explanation and letting the patients choose their own answers by themselves.
RESULTS
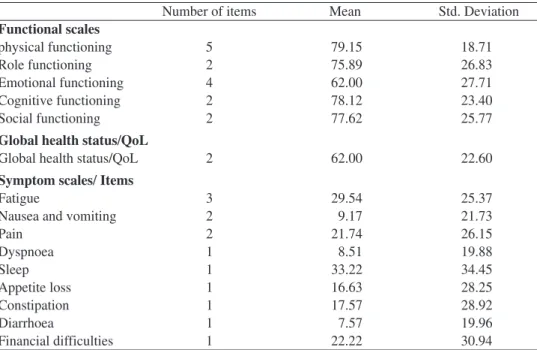
Mean values for functional scales, global health status, symptom scales and symptom items are presented in table 2
Table 2- mean and standard deviation of scales and items
Number of items Mean Std. Deviation
Functional scales physical functioning 5 79.15 18.71 Role functioning 2 75.89 26.83 Emotional functioning 4 62.00 27.71 Cognitive functioning 2 78.12 23.40 Social functioning 2 77.62 25.77
Global health status/QoL
Global health status/QoL 2 62.00 22.60
Symptom scales/ Items
Fatigue 3 29.54 25.37
Nausea and vomiting 2 9.17 21.73
Pain 2 21.74 26.15 Dyspnoea 1 8.51 19.88 Sleep 1 33.22 34.45 Appetite loss 1 16.63 28.25 Constipation 1 17.57 28.92 Diarrhoea 1 7.57 19.96 Financial difficulties 1 22.22 30.94
Inspection of functional scales shows high scores for physical functioning, Role functioning, Cognitive functioning, and Social functioning; lower scores for Emo-tional functioning and Global health status/QoL. For symptom/item scales the worst scores (more symptoms) are for Sleep, Fatigue, Pain, Constipation, and Appetite loss, and lower scores (less symptoms) for Diarrhoea, Dyspnoea and Nausea and vomiting. Standard deviation shows that the dispersion of the scores is very high suggesting that symptoms change across the sample. Standard deviation for functional scores show an appropriate value for the means. Mean values are similar to other studies (Aaronson et al. 1993; King, 1996; Kobayashi, et al.,1998; Osoba, et al., 1994; 1998).
Correlations between scales
Inspection of correlations between functional scales and symptom item/scales allows conclusions about the relations and the shared variance of the dimensions. Table 3 shows correlations between functional scales
Table 3- The correlation between scales and item-scales show
Physical Role Emotional Cognitive Social
function function function function function
Role function 0.54(**)
Emotional function 0.38(**) 0.34(**)
Cognitive function 0.39(**) 0.35(**) 0.56(**)
Social function 0.33(**) 0.47(**) 0.38(**) 0.35(**)
Global health status/QoL 0.42(**) 0.40(**) 0.34(**) 0.26(**) 0.32(**)
** Correlation is significant at the 0.01 level (2-tailed).; * Correlation is significant at the 0.05 level (2-tailed).
The inspection of correlations between functional dimensions of QLQ-C30 show moderate correlations with a small fluctuation between the magnitudes of correlations. The moderate correlations suggest that dimensions measure different constructs.
Table 4 - Correlation between symptom scales, and item symptoms
Fatigue Nausea Pain Sleep Appetite Constipation Diarrhoea Financial
and vomiting loss difficulties
Nausea and 0.46(**) vomiting Pain 0.61(**) 0.36(**) Sleep 0.44(**) 0.23(**) 0.39(**) Appetite loss 0.56(**) 0.50(**) 0.42(**) 0.35(**) Constipation 0.34(**) 0.29(**) 0.32(**) 0.20(**) 0.23(**) Diarrhoea 0.18(**) 0.22(**) 0.17(**) 0.13(**) 0.21(**) ns Financial 0.36(**) 0.20(**) 0.34(**) 0.25(**) 0.23(**) 0.13(**) 0.12(**) difficulties Dyspnoea 0.32(**) 0.18(**) 0.27(**) 0.20(**) 0.17(**) 0.18(**) ns 0.16(**) ** Correlation is significant at the 0.01 level (2-tailed).; * Correlation is significant at the 0.05 level (2-tailed); ns- non significant
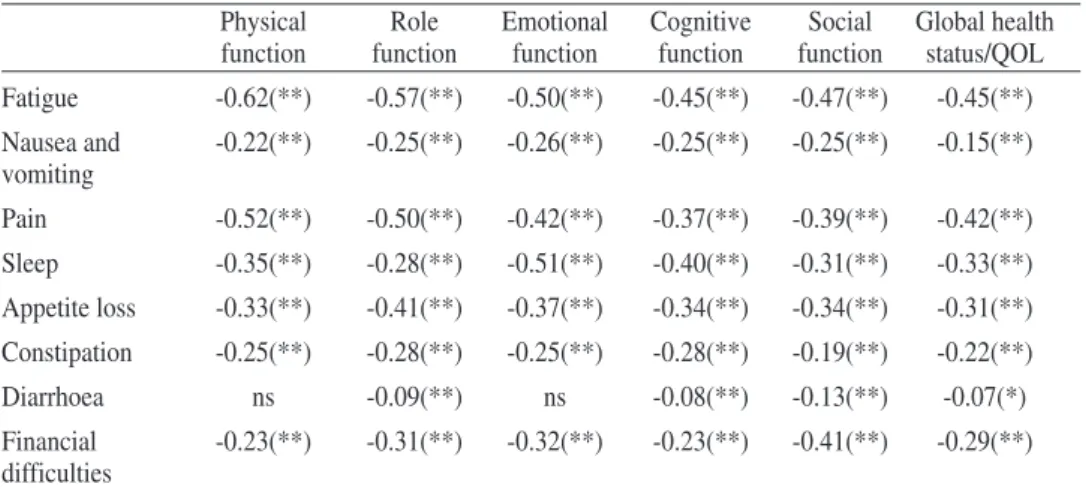
The correlations between symptom item/scales show a large variation, from 0.00 to 0.61 between symptoms suggesting that they measure different aspects. The variance is larger than functional scales, and it is in accordance with the theory. Table 5 presents correlations between functional scales and symptom item-scales.
Table 5 - Correlation between functional scales and symptom scales and item
symp-toms
Physical Role Emotional Cognitive Social Global health
function function function function function status/QOL
Fatigue -0.62(**) -0.57(**) -0.50(**) -0.45(**) -0.47(**) -0.45(**) Nausea and -0.22(**) -0.25(**) -0.26(**) -0.25(**) -0.25(**) -0.15(**) vomiting Pain -0.52(**) -0.50(**) -0.42(**) -0.37(**) -0.39(**) -0.42(**) Sleep -0.35(**) -0.28(**) -0.51(**) -0.40(**) -0.31(**) -0.33(**) Appetite loss -0.33(**) -0.41(**) -0.37(**) -0.34(**) -0.34(**) -0.31(**) Constipation -0.25(**) -0.28(**) -0.25(**) -0.28(**) -0.19(**) -0.22(**) Diarrhoea ns -0.09(**) ns -0.08(**) -0.13(**) -0.07(*) Financial -0.23(**) -0.31(**) -0.32(**) -0.23(**) -0.41(**) -0.29(**) difficulties
** Correlation is significant at the 0.01 level (2-tailed).; * Correlation is significant at the 0.05 level (2-tailed); ns-non significant
Correlations between functional scales and symptom scale/item dimensions, show a large variability, but with similar magnitude for all the functional dimen-sions.
Conclusions of correlations between dimensions of QLQ-C30 show that the distinction between functional and symptom scales are appropriate with stability between correlations of functional scales and variability between correlations of symptom scales and in consequence variability between functional and symptom scale/items. These values suggest that the theoretical option to consider the two kind of measures (functional and symptoms), functional as indicator variables, and symptoms as causal variables, are appropriate, because they express different as-pects of the disease, difference that can be captured by the wide magnitude of cor-relations, broader for the correlations between symptoms, and, in consequence, between functional scales and symptoms. The pattern of these results are similar to other studies (Aaronson et al 1993;Arraras, et al,2002; Kaasa, et al, 1995; Zhao, & Kanda, 2000)
Correlation with demographic and disease variables
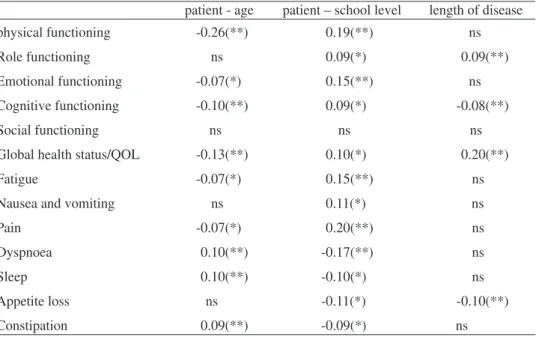
The inspection of the correlation between demographic data (age, number of school years, and years since diagnosis), and functional scales and symptoms sca-les/items, presented in table 6, show small correlations, with the higher correlation between physical functioning dimension and age (0.26), with half of the correlations below 0.10
Table 6 - Correlation of dimensions of QLQ-C30 with demographic variables
patient - age patient – school level length of disease
physical functioning -0.26(**) 0.19(**) ns
Role functioning ns 0.09(*) 0.09(**)
Emotional functioning -0.07(*) 0.15(**) ns
Cognitive functioning -0.10(**) 0.09(*) -0.08(**)
Social functioning ns ns ns
Global health status/QOL -0.13(**) 0.10(*) 0.20(**)
Fatigue -0.07(*) 0.15(**) ns
Nausea and vomiting ns 0.11(*) ns
Pain -0.07(*) 0.20(**) ns
Dyspnoea 0.10(**) -0.17(**) ns
Sleep 0.10(**) -0.10(*) ns
Appetite loss ns -0.11(*) -0.10(**)
Table 6(Cont.)- Correlation of dimensions of QLQ-C30 with demographic variables
patient - age patient – school level length of disease
Diarrhoea ns ns ns
Financial difficulties -0.10(**) -0.18(**) -0.08(*)
** Correlation is significant at the 0.01 level (2-tailed); * Correlation is significant at the 0.05 level (2-tailed); ns-non significant
The magnitude of correlations, and statistically significance, between QoL di-mensions and age, number of school years and years since diagnosis is low or non existent. The low statistically significant correlations show a trend to low values for functional and symptom scales with age, and better values with education. The non existence of correlations based on the length of disease suggests a low difference bet-ween for the sample in initial phases of disease and the ones with large years after the onset of disease.
Reliability
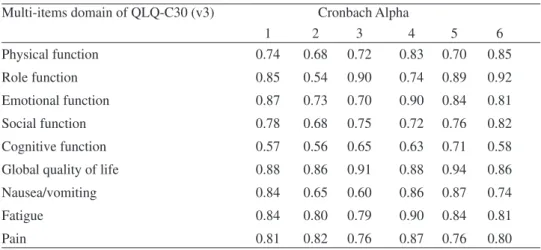
The study of reliability through Cronbach alpha shows an appropriate internal consistency for multi item functional and symptom scales. When we compare the va-lues of the Portuguese version with the ones of the original study and with others from different languages and cultures (Japanese, Turkish, Chinese), and similar languages and cultures (Spanish) we found comparable values. Table 7 shows the values for the Portuguese version and the values of other studies in different languages and cultures.
Table 7 - Internal consistency (Cronbach alpha of multi item scales); comparison
with other studies (Column 1 show values of our study)
Multi-items domain of QLQ-C30 (v3) Cronbach Alpha
1 2 3 4 5 6 Physical function 0.74 0.68 0.72 0.83 0.70 0.85 Role function 0.85 0.54 0.90 0.74 0.89 0.92 Emotional function 0.87 0.73 0.70 0.90 0.84 0.81 Social function 0.78 0.68 0.75 0.72 0.76 0.82 Cognitive function 0.57 0.56 0.65 0.63 0.71 0.58
Global quality of life 0.88 0.86 0.91 0.88 0.94 0.86
Nausea/vomiting 0.84 0.65 0.60 0.86 0.87 0.74
Fatigue 0.84 0.80 0.79 0.90 0.84 0.81
Pain 0.81 0.82 0.76 0.87 0.76 0.80
1- Portuguese study group (n= 933); 2- EORCT study group, n=535(Osoba et.al. 1994); 3-Spain study, n=201(Arraras et.al. 2002); 4- Japanese study, n=105 (Kobayashi et.al. 1998); 5-Turkish version, n=194 (Guzelant, et al., 2004); 6- Taiwan Chinese study n=99 (Chie, Yang, Hsu, & Yang, 2004)
Table 7 shows that alpha values tends to express similar magnitude for different languages, and the same pattern (higher values and lower values for the same di-mensions) suggesting an adequate functional equivalence of the questionnaire across languages and cultures. Cognitive functioning seems to be the domain with lowest va-lues of internal consistency and global QoL seems to show the highest vava-lues. Vava-lues follow the same pattern for general population (Hjermstad, et al. 1998).
Test retest
274 patients, with the diagnosis made in less than one year (M=4.6 months) with the treatment intervention made during this period were used for complemen-tary reliability analysis, namely test retest and comparison of QoL and symptoms in a six months period.
Test retest is a way to see the stability of the answers to the questionnaire. The questionnaire asks about how patient feels during the past week. It is a state (instead of trait) questionnaire and, because of that, it is assumed that the stability becomes reduced with the time-span between responses. For one to two week intervals the va-lues tend to be moderate to high (Arraras et al., 2002; Chie et al., 2004; Osoba, Aa-ronson, Zee, Sprangers, & Velde, 1997). In our study a retest for 274 patients was conducted six months after the first evaluation, and for functional dimensions the va-lues are, 0.31, 0.16, 0.28, 0.06, and 0.19, respectively for Physical functioning, Role functioning, Cognitive functioning, Social functioning, and Global health sta-tus/QOL. For symptom scales values are, 0.35, 0.21, 0.39, 0.35, 0.29, 0.38, 0.32 and 0.21, respectively for, fatigue, nausea and vomiting, pain, dyspnoea, appetite loss, sleep, constipation, diarrhoea. These are moderate values and substantially higher than functional scales. Low correlations for a six months period tend to confirm that the measures are status measures. However the values are substantially higher for the symptom scales, and it makes sense because during the first year patients are in-volved in different phases of treatment, with more stable expression on symptoms than on functional dimensions.
Comparison of results for functional scales shows that six months later the percen-tage of patients with better, the same, and lower QOL are, respectively, the following, phy-sical functioning, 32.4, 16.1%, 51.5%, Role functioning, 33.6, 27.7% ,38.7,Cognitive functioning, 50.5, 9.2, 41.3, Social functioning, 32.6, 35.9 ,31.5,and Global health sta-tus/QOL, 54.2, 16.1, and 29.7. For symptom scales the results are, respectively (more, the same, less symptoms), for fatigue, 43.9, 19.8, 36.3, nausea and vomiting, 22.3, 60.9, 16.8, pain, 30.4, 34.1, 35.5, dyspnoea, 12.7, 78.5, 8.8, appetite loss, 23, 56.6, 20.4, sleep, 28.8, 46.7, 24.5, constipation, 20.9, 61.3, 17.8, diarrhoea, 19.4, 68.2, 12.4.
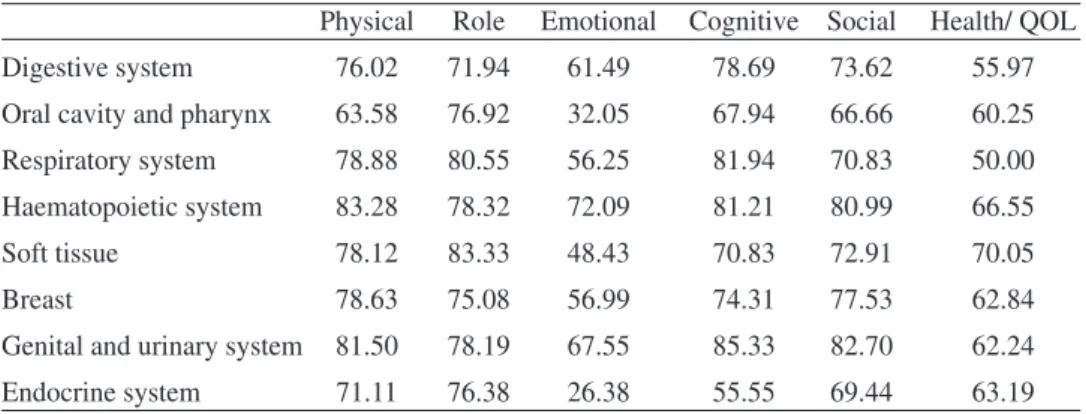
Sensitivity
Sensitivity of a measure is the propriety to express differences between groups that are different. To test the property of the questionnaire we compare the mean va-lues of dimensions between cancer sites (table 8).
Table 8 - mean values by site group of cancer for functional scales
Physical Role Emotional Cognitive Social Health/ QOL
Digestive system 76.02 71.94 61.49 78.69 73.62 55.97
Oral cavity and pharynx 63.58 76.92 32.05 67.94 66.66 60.25
Respiratory system 78.88 80.55 56.25 81.94 70.83 50.00
Haematopoietic system 83.28 78.32 72.09 81.21 80.99 66.55
Soft tissue 78.12 83.33 48.43 70.83 72.91 70.05
Breast 78.63 75.08 56.99 74.31 77.53 62.84
Genital and urinary system 81.50 78.19 67.55 85.33 82.70 62.24
Endocrine system 71.11 76.38 26.38 55.55 69.44 63.19
Variation differences in means by site group are important. If we inspected the difference between groups using Onaway ANOVAs we found statistically significant differences for all functional scales except for Role Functioning. For multi-item symptom scale we found statistically significant differences for fatigue and pain sca-les and not for nausea scale.
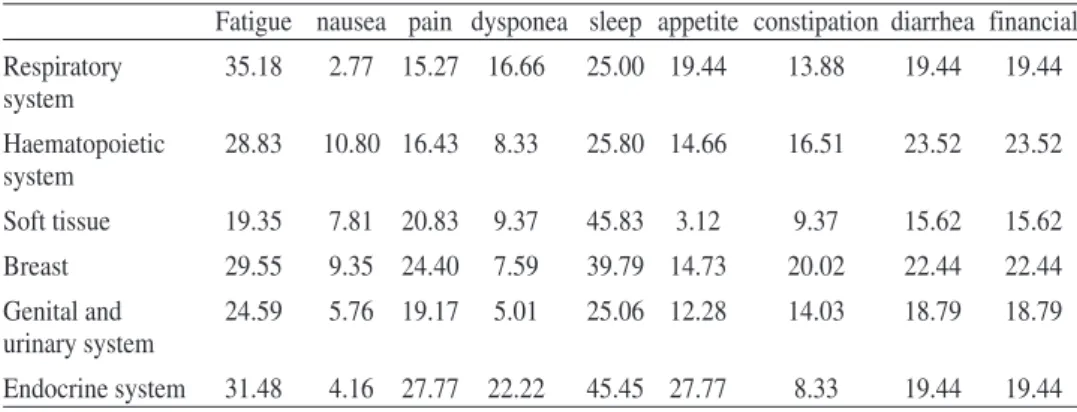
About clinical significant differences between scores, Osoba, Rodrigues, Myles, Zee, and Pater (1998) and King (1996) suggest a mean change between 5 and 10 points as little change; a difference between 10 and 20 moderate change, and a difference higher than 20 a very large change. More specifically King (1996) pro-poses for differences in multi item scales, between 5 (small difference) and 27 (large difference) points of difference for physical functioning, 5 and 25 for role functioning, 2 and 7 for emotional and for cognitive, 2 and 13 for social, 2 and 16 for global qol, 3 and 12 for nausea, 5 and 20 for pain, and 7 and 27 for fatigue. Based on King’s proposal we can identify important differences in our sample for patients with cancer in the various site groups: 20 points for physical functioning, 12 for role, 46 for emotional, 30 for cognitive, 16 for social, and 20 for global QoL (table 8). The same pattern can be seen for mean values by site group of cancer for symptom item/scale, 8 for nausea, 12 for pain, and 16 for fatigue (table 9). Diffe-rences for our sample are large for the majority of functional and symptom di-mensions, with emotional and cognitive dimensions with very large differences. Avis et al. (2005) comparing among different types of cancer found, also, impor-tant differences for domains of QoL.
Table 9 - mean values by site group of cancer for item/scales symptoms
Fatigue nausea pain dysponea sleep appetite constipation diarrhea financial
Digestive system 34.09 10.19 25.00 10.35 34.24 24.20 20.09 23.28 23.28
Oral cavity and 29.91 7.69 19.23 15.38 41.02 25.64 7.69 33.33 33.33
Table 9(Cont.)- mean values by site group of cancer for item/scales symptoms
Fatigue nausea pain dysponea sleep appetite constipation diarrhea financial
Respiratory 35.18 2.77 15.27 16.66 25.00 19.44 13.88 19.44 19.44 system Haematopoietic 28.83 10.80 16.43 8.33 25.80 14.66 16.51 23.52 23.52 system Soft tissue 19.35 7.81 20.83 9.37 45.83 3.12 9.37 15.62 15.62 Breast 29.55 9.35 24.40 7.59 39.79 14.73 20.02 22.44 22.44 Genital and 24.59 5.76 19.17 5.01 25.06 12.28 14.03 18.79 18.79 urinary system Endocrine system 31.48 4.16 27.77 22.22 45.45 27.77 8.33 19.44 19.44
Comparison between stages of survivorship
If we compared groups based on the stages of survivorship (acute, 49.7%; ex-tended, 16.1%; permanent, 34.2%) we found statistically significant differences for functional role scale , F(2,922)= 5.82, p<0.004, with better QoL for the permanent group, M=79.94, followed by the extended group M=75.16 and the acute group, M= 73.31; the functional cognitive scale, F(2,923)=7.46, p<0.002, with better results for the patients at acute group, M= 81.02, followed by the permanent group M= 75.47, and the extended group, M=74.49; and for the global health status/QoL scale, F(2,924)=32.67, p>0.001,with the permanent group expressing better QoL, M=69.48, followed by the extended group, M=62.58, and the acute group, M=56.60. For the symptom item/scales we found statistically significant differences for sleep symp-tom, F(2,927)=3.25, p<0.04, with the acute group showing lower symptoms, M=31.09, followed by the permanent group, M=33.33, and the extended group with the worst symptoms, M=39.33; the appetite symptom, F(2,927) =5.52, p<0.005, with the permanent group with lowest symptoms, M=12.89, followed by the extended group, M=15.55, and the acute group, M=19.62.
Results show small differences between stages for the majority of functional and symptom scales, and some of them show patterns against the common sense like, for example, the cognitive scale. 6 points for physical functioning, 7 for cognitive, and 14 for global QoL are small differences. Similar pattern is found for symptom dimensions. Inspections and comparison of means by stage of disease are surprising, to use the words of Ringdal and Ringdal (2000). These authors in a study where they compare cancer survivors over a 3-4 year period, with the first measure during the first months of disease, found small differences, sometimes with better scores in the first moment, sometimes better in the second moment. No significant dif-ferences or small difdif-ferences for QoL, based on time of survival, where found in other studies (Aaronson et al, 1993; Fehlauer, Tribius, Mehnert, & Rades, 2005; Grunfeld et al. 2006)
DISCUSSION
Results of our study suggest that the questionnaire for the assessment of health rela-ted quality of life QLQ-C30 is a) an appropriate instrument to measure the QoL of Portu-guese cancer patients; b) behaves in the same way in very different cultures and languages; c) is sensitive to different cancer sites; d) is not sensitive to stages of survivorship.
If we look at the sensitivity of the scales we find that mean values tend to main-tain across stages of survivorship; however the correlations in a six month period time are low, correlations with time of survival are low or non statistically significant, suggesting that there are important intra-individual variations along the time, but small variations in groups where patients maintain similar means.
Differences based on survival time are low, contradictory, and unexpected. Part of the results can be a consequence of different types of cancer that show large dif-ferences for part of the functional scales and item/symptom scales. More precise com-parisons need to be made, separating participants by site groups.
Explanations for our results can be based on the need persons have to accom-modate to their illness. Sprangers and Schwartz (1999) explain this process with the response shift defined as changes in the meanings of one self evaluations of QoL re-sulting from changes in internal standards, values and life interpretation. This expla-nation is on the continuity of adjustment processes proposed before by Taylor (1983) and Taylor and Brown, (1988).
However the Portuguese version of QLQ-C30 shows good psychometric charac-teristics, which are similar to the versions of other cultures and languages, a characte-ristic that facilitates comparisons of results between cultures. It seems also be sensitive to different cancer sites expressing the differences that are result of the impact of the different cancers, some of that differences seem to be more physiological, others more psychological, but it is recognized that the immense differences of cancer characteris-tics facilitates vast differences in symptoms and in functional capabilities.
Most scales have low to moderate correlation coefficients with the other scales, indicating that these areas are related but represent different elements of QoL. Sca-les, whose contents are more related, like role and physical functioning, have higher correlation coefficients among them and vice versa, like in the case of cognitive func-tioning and nausea and vomiting.
Results of our study firmly support the psychometric structure of the QLQ-C30. The results of the reliability analysis are satisfactory and similar to other studies in different cultures and languages.
ACKNOWLEDGEMENTS
Authors would like to acknowledge E. Sá for the data of part of Haematopoie-tic patients, and to the patients who so generously gave their time to complete the study questionnaires.
REFERENCES
Aaronson, N, Ahmedzai, S., Bergman, B., Bullinger, Cull, A, Duez, N. et al. (1993). The Eu-ropean Organization for Research and Treatment of Cancer QLQ-C30: A quality-of life-instru-ment for use in international clinical trials in oncology.Journal of the National Cancer Institute,
85(5), 365-375
Alfano, C., & Rowland, J. (2006).Recovery Issues in Cancer Survivorship: A New Chal-lenge for Supportive Care.The Cancer Journal,12(5), 432-443
Arraras, J., Arias, F., Tejedor, M., Pruja, E., Marcos,M., Martínez, E., & Valerdi, J. (2002). The EORTC QLQ-C30 (version 3.0) QoL questionnaire: Validation study for Spain with head and neck cancer patients.Psycho-Oncology, 11, 249–256
Avis, N.,Smith, K., McGraw, S., Smith, R., Petronis, V., & Carver, C. (2005). Assessing Quality of Life in Adult Cancer Survivors (QLACS).Quality of Life Research, 14, 1007–1023
Bloom, J. (2002). Surviving and Thriving?Psycho-Oncology, 11, 89–92 Bolen & Lenox, 1991)
Cabral, M.V. (Coord.), da Silva, P.A., & Mendes, H. (2002).Saúde e doença em Portugal. Lisboa: Imprensa de Ciências Sociais.
CDC. (2004).Cancer Survivorship. Atlanta: Centers for Disease Control and Prevention Centers for Disease Control and Prevention. Assessed in august 2007 in: http://www.cdc.gov/can-cer
Chie, W., Yang, C., Hsu, C., & Yang, P. (2004). Quality of life of lung cancer patients: Va-lidation of the Taiwan Chinese version of the EORTC -QLQ-C30 and QLQ-LC13,Quality of Life
Research, 13, 257–262.
Fayers, P.M., Hand, D.J., Bjordal, K., & Groenvold,M. (1997). Causal indicators in quality of life research.Quality of Life Research, 6, 393–406
Fehlauer, F., Tribius, S., Mehnert, A., & Rades, D. (2005). Health-related quality of life in long term breast cancer survivors treated with breast conserving therapy: impact of age at therapy.
Breast Cancer Research and Treatment, 92, 217–222
Goodwin, P.,Black, J.,Bordeleau, L., & Ganz, P.(2003). Health-Related Quality-of-Life Mea-surement in Randomized Clinical Trials in Breast Cancer— Taking Stock.Journal of the
Natio-nal Cancer Institute, 95, (4), 263-281
Guzelant A., Goksel T., Ozkok S., Tasbakan S., Aysan T. & Bottomley A. (2004). The Eu-ropean Organization for Research and Treatment of Cancer QLQ-C30: an examination into the cultural validity and reliability of the Turkish version of the EORTC QLQ-C30.European
Jour-nal of Cancer Care, 13, 135–144
Hjermstad, M., Fayers, P., Bjordal, K., & Kaasa, S.(1998). health-related quality of ife in ge-neral Norwegian population assessed by the European Organization for Research and Treatment of Cancer core quality-of-life questionnaire: the QLQ=C30(+3).Journal of clinical oncology,16(3), 1188-1196.
King, M. (1996). The interpretation of scores from the EORTC quality of life questionnaire QLQ-C30.Quality of Life Research, 5, 555-567
Kobayashi,K., Takeda,F., Teramukai,S., Gotoh,I., Sakai,H., Yoneda,S., Noguchi,Y., Ogasa-wara, H., & Yoshida, K. (1998). A Cross-validation of the European Organization for Research and Treatment of Cancer QLQ-C30 (EORTC QLQ-C30) for Japanese with Lung Cancer.European
Leigh, S. (1992). Myths, monsters, and magic: personal perspectives and professional chal-lenges of survival.Oncology Nursing Forum, 19(10),1475-1480
Lipscomb,J., Donaldson,M., Arora, N., Brown,M., Clauser, S., Potosky, A., Reeve, B., Row-land, J., Snyder, C., & Taplin,S.(2004) Cancer Outcomes Research.Journal of the National
Can-cer Institute Monographs, 33, 178-197
Mandelblatt, J., Armetta, C., Yabroff, K.,Liang,W., & Lawrence, W. (2004).Descriptive Re-view of the Literature on Breast Cancer Outcomes: 1990 Through 2000.Journal of the National
Cancer Institute Monographs, 33, 8-44
Mandelblatt,J., Lawrence,W., Cullen, J., Stanton, A., Krupnick,J., Kwan,L., & Ganz, P.(2006). Patterns of Care in Early-Stage Breast Cancer Survivors in the First Year After Cessa-tion of Active Treatment.Journal of clinical oncology, 24(1),77-84
Mullan, F. (1985) Seasons of survival: Reflections of a physician with cancer.New England
Journal of Medicine, 313, 270–273.
National Cancer Institute (NCI) (2003).Cancer Control and Population Sciences: Research
Findings [on-line]. Assessed on December,18, 2007 at:
http://dccps.nci.nih.gov/ocs/preva-lence/index.html
Osoba D, Rodrigues G, Myles J, Zee B, Pater J. (1998). Interpreting the significance of changes in healthrelated Quality of Life scores.Journal of Clinical Oncology, 16, 139– 144.
Osoba,D. Zee, B., Pater, J., Warr, D., Kaizer,L., & Latreille,J. (1994). Psychometric proper-ties and responsiveness of the EORTC Quality of Life in patiets with breast, ovarian and lung can-cer.Quality of Life Research, 3, 353-364
Osoba,D., Aaronson, N., Zee, B., Sprangers, M. and te Velde, A. for the Study Group on Quality of Life of the EORTC and the Symptom Control and Quality of Life Committees of the NCI of Canada Clinical Trials Group (1997). Modification of the EORTC QLQ-C30 (version 2.0) based on content validity and reliability testing in large samples of patients with cancer.Quality
of Life Research, 6, 103–108
Parsons, S.,& Brown, A. (1998). Evaluation of Quality of Life of Childhood Cancer Survi-vors: A Methodological Conundrum.Medical and Pediatric Oncology Supplement, 1, 46–53
Ringdal,G., & Ringdal, K. (2000).A follow-up of the quality of life in cancer patients with different prognoses.Quality of Life Research, 9, 65-73
Sprangers, M., & Schwartz, C. (1999). Integrating response shift into health-related quality of life research: a theoretical model.Social Science and Medicine, 48 (11), 1507-1515.
Taylor, S. E. (1983). Adjustment to threatening events: A theory of cognitive adaptation.
American Psychologist, 38, 1161-1173.
Taylor, S., & Brown, J. (1988). Illusion and Well-Being: A Social Psychological Perspective on Mental Health.Psyehologlcal Bulletin, 103 (2), 193-210
Zebrack, B., & Zeltzer, L. (2003). Quality of life issues and cancer survivorship.Current
pro-blems in cancer, 27(4), 198-211
Zhao, H., & Kanda, K. (2000). Translation and validation of the Standard Chinese version of the EORTC QLQ-C30.Quality of Life Research, 9, 129-137.