ABSTRACT:Introduction: The aging process is characterized by several changes in individuals’ life, including his or her nutritional status and food intake. To understand the trends of these changes, studies with elderly people who were born at different times are necessary. Objective: To compare the nutritional status and food intake of elderly people who participated in the Health, Well-being, and Aging study (SABE study), conducted in São Paulo, in 2000 and 2010. Methods: The nutritional status was identified by means of the body mass index (BMI) and was classified as underweight (BMI < 23 kg/m²), adequate weight (23 ≤ BMI < 28 kg/m²), or overweight (BMI ≥ 28 kg/m). Food intake was self-reported and was classified as the number of meals (≥ 3/day), frequency of intake of dairy products (≥ 1 serving/day), eggs and beans (≥ 1 serving/week), fruits and vegetables (≥ 2 servings/day), meat (≥ 3 servings/week), and liquids (≥ 5 glasses/day). The prevalence ratio was calculated to compare the variables of the cohorts, using Poisson regression. Results: A total of 755 individuals of both the genders aged 60 to 64 years and who were born between 1936 and 1940 and between 1946 and 1950 participated in this study. Elderly people who were born between 1946 and 1950 presented higher prevalence ratio of overweight (PR = 1.19), number of meals (PR = 1.34), and liquids intake (PR = 1.18), but presented lower prevalence of intake of dairy products (PR = 0.87), meats (PR = 0.93), and fruits and vegetables (PR = 0.83). Conclusion: These results showed concerning scenarios of nutritional status and food intake for the most recent cohort (1946 – 1950).
Keywords: Aged. Aging. Anthropometry. Feeding. Nutritional status. Cohort studies.
Comparison of nutritional status and
dietary intake self-reported by elderly
people of different birth cohorts
(1936 to 1940 and 1946 to 1950):
Health, Wellbeing and Aging (SABE) Study
Comparação do estado nutricional e da ingestão alimentar referida por
idosos de diferentes coortes de nascimento (1936 a 1940 e 1946 a 1950):
Estudo Saúde, Bem-Estar e Envelhecimento (SABE)
Maria de Fátima Nunes MarucciI, Manuela de Almeida RoedigerII,
Daiana Aparecida Quintiliano Scarpelli DouradoII, Denise Rodrigues BuenoII
IDepartment of Nutrition, School of Public Health, Universidade de São Paulo – São Paulo (SP), Brazil.
INTRODUCTION
Aging process is characterized by a number of psychosocial changes that may affect the nutritional status and food intake and cause disabilities and the development of chronic noncommunicable diseases (NCDs). Consequently, quality of life worsens, risk of death increases1-4, and health system costs rise. Therefore, aging process and the elderly popula-tion have aroused the interest of the scientific community and health care managers.
Nutritional panorama of the Brazilian population is characterized by a high prevalence of overweight (body mass index [BMI] ≥ 25 kg/m2) in the adult population, resulting in a high frequency of this disorder among elderly people and contributing to modify the pro-file of morbidity and mortality in this population5.
Results of the analysis of different birth cohorts (1901, 1906, 1911, 1922, and 1930) showed that Swedish elderly who were born in 1930 had higher body weight and, conse-quently, higher BMI6. A research conducted in Finland, with elderly who were born at dif-ferent times (1913 – 1917 and 1968 – 1972), identified higher average BMI among women in the most recent cohort7.
Research with this objective has been focused in other countries; however, in Brazil, this topic is still incipient. A Brazilian study, found in the literature review, analyzed two birth cohorts (1916 – 1926 and 1927 – 1937), with elderly who participated in the Bambuí Project (Minas Gerais). This study found a higher prevalence of overweight (BMI ≥ 27 kg/m2) in men in the birth cohort 1927 – 19378.
ReSUMO:Introdução: O processo de envelhecimento é caracterizado por várias alterações, incluindo do estado nutricional e da ingestão alimentar. Para compreender a tendência dessas alterações são necessários estudos com idosos de diferentes épocas de nascimento. Objetivo: Comparar o estado nutricional e a ingestão alimentar de idosos participantes do Estudo Saúde, Bem-Estar e Envelhecimento (SABE), realizado em São Paulo, em 2000 e 2010. Métodos:O estado nutricional foi identificado pelo índice de massa corporal (IMC), considerando: baixo peso (IMC < 23 kg/m²); peso adequado (23 ≤ IMC < 28 kg/m²); excesso de peso (IMC ≥ 28 kg/m²); e a ingestão alimentar referida: número de refeições (≥ 3/dia), frequência de laticínios (≥ 1 porção/dia), de ovos e leguminosas (≥ 1 porção/semana), de frutas, legumes e verduras (≥ 2 porções/dia), de carnes (≥ 3 porções/semana) e de líquidos (≥ 5 copos/dia). A comparação foi realizada por razão de prevalência, utilizando regressão de Poisson.Resultados: Participaram 755 indivíduos de ambos os sexos, de 60 a 64 anos, nascidos nos períodos de 1936 a 1940 e 1946 a 1950. Os idosos nascidos entre 1946 e 1950 apresentaram maior razão de prevalência para excesso de peso (RP = 1,19) e para número de refeições (RP = 1,34) e para líquidos (RP = 1,18), contudo menor razão de prevalência para laticínios (RP = 0,87), para carnes (RP = 0,93) e para frutas, legumes e verduras (RP = 0,83). Conclusão: Estes resultados mostram cenários alimentar e nutricional preocupantes para a coorte mais recente (1946 – 1950).
With regard to food intake, a research conducted in Sweden with different cohorts (year of birth: 1901, 1911, 1922, and 1930) found that those elderly who were born in 1901 or 1911 reported eating more fruits, vegetables, chicken, rice, and yogurt compared with those in the youngest cohorts9.
In Brazil, according to the Research on Family Budget (POF – 2002/2003 and 2008/2009), the Brazilian population, including the elderly, decreased their intake of fruits and vegeta-bles10-12. However, according to the data from these studies, the reported intake of sausage, bologna, sandwiches, and snacks was lower among the elderly subjects12.
Therefore, studies assessing the elderly from different periods of birth are extremely important to understand the trends of population aging and the changes in the nutritional status and food intake, aiming at identifying possible emerging and future problems and establishing public policies and intervention strategies in the field of food and nutrition.
Health, Well-being, and Aging (SABE) study became in this context a major research on population aging in Brazil. SABE study has analyzed the status of health and nutrition in different cohorts of elderly people. Thus, the objective of this study was to compare the nutritional status and food intake of two cohorts of elderly participants in the SABE study, according to gender.
METHODS
This is a cross-sectional study that analyzed two cohorts of elderly people (cohort A and C) who participated in the Health, Well-being, and Aging (SABE) study, in the city of São Paulo (SP), in 2000 and 2010.
In 2000, cohort A consisted of 2,143 individuals aged 60 years or older who lived in the urban area of SP. Silva13 has already published the descriptions of the sampling, the ques-tionnaire, and the data collection. In 2010, cohort C was composed of 329 individuals.
To compare the cohorts, those individuals who were born between 1936 and 1940 (aged 60 – 64 years) from the cohort A in 2000 (n = 426) and elderly people from cohort C (n = 329) who were born between 1946 and 1950 were selected. Thus, 755 elderly individuals of both the genders participated in this study.
The study variables were nutritional status and diet.
Nutritional status was evaluated by the calculation of BMI in kg/m2. For the calcula-tion, data related to the body weight (BW) and height (H), obtained from questions K05 and K11 (K section) of the questionnaire of SABE study were used. BW was measured with the elderly standing barefoot, using a portable SECA® brand scale with a capacity of 150 kg. Height was measured using a Harpender® anthropometer, wall-mounted or fixed on the doorframe to obtain right angles to the floor of the residence. The elderly was measured barefoot, in an upright posture, leaning against the wall or doorframe.
(BMI < 23 kg/m²), normal weight for the height (23 ≤ BMI < 28 kg/m²), risk for obesity (28 ≤ BMI < 30 kg/m²), and obesity (BMI ≥ 30 kg/m²). In this study, the elderly people were analyzed according to three categories: normal weight (reference), underweight, and overweight (BMI ≥ 28 kg/m²).
Diet was analyzed according to the following variables: ≥ 3 meals/day, ≥ 1 serving of dairy products/day, ≥ 1 serving of eggs and/or vegetables/week, ≥ 3 servings of meat (beef, pork, poultry, and fish)/week, ≥ 2 servings of fruits and vegetables/day, and ≥ 5 glasses of liquids (water, tea, coffee)/day, according to the dichotomous response (yes or no) given by the elderly or respondents.
Data from diet variables were obtained from C section (C22a to C22g and C22_1 to C22_7) of the SABE study questionnaire.
Statistical tests recommended for survey studies were applied because of the complex sampling process.
The description of the population was presented according to the weighted relative fre-quency of elderly population in relation to nutritional status and diet variables. The Rao-Scott χ2 test was used to verify statistically significant differences and/or similarities between the proportions of the elderly people in relation to the variables of the study. Poisson regres-sion model with robust variance was used to compare variables between study cohorts, in which cohort A was considered as reference. Prevalence ratio (PR) and confidence inter-vals (CIs) were estimated, being considered a significant difference between the cohorts a result of p < 0.05. All calculations were performed using STATA 13.1 for Windows program.
RESULTS
The study included 755 elderly people (52% women). Of these, 426 elderly were from cohort A (56% men) and 329 elderly were from cohort C (57% women).
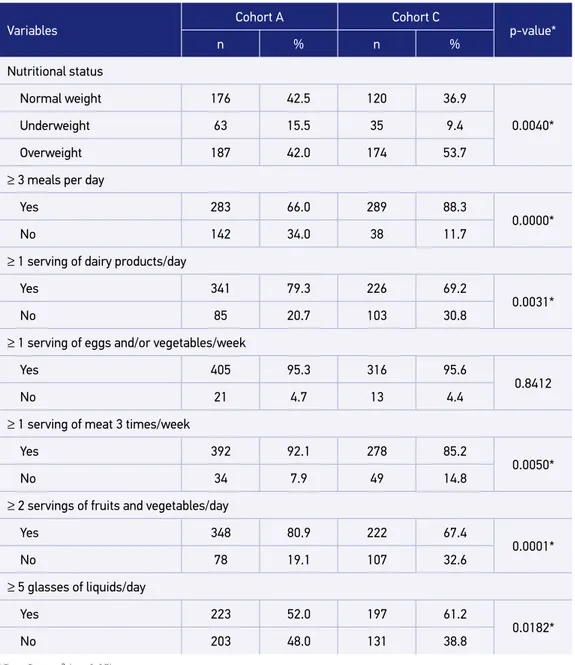
With regard to the nutritional status, a higher proportion of elderly people with normal weight (42.5%) and low weight (15.5%) was observed in cohort A, and a higher proportion (53.7%) of overweight was found in the cohort C (p = 0.004) (Table 1).
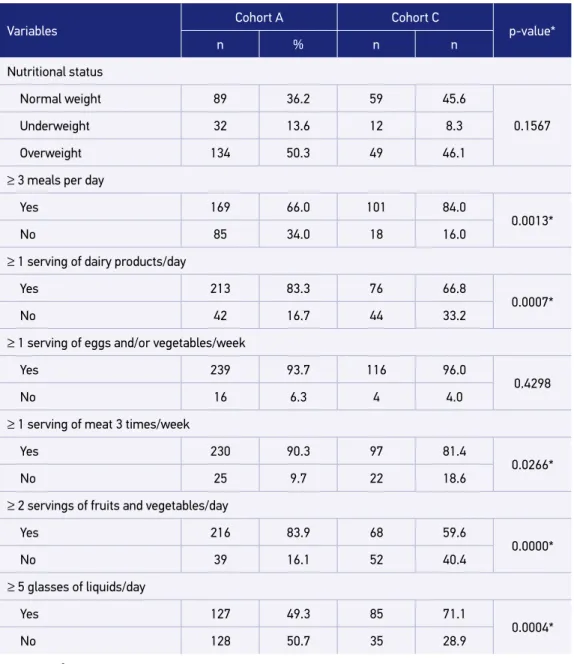
Nutritional status according to gender had similar results in cohort C, as a lower propor-tion of underweight women (10.2%) and a higher proporpropor-tion of overweight women (59.5%), with a statistically significant difference (p = 0.0000) were found (Table 2). Similarly, a lower proportion of elderly with low weight (8.3%) and a higher proportion of overweight (46.1%) were found among men; however, this was not a statistically significant difference (Table 3).
With regard to diet variables, a higher proportion of the elderly in the cohort C mentioned
In the female population, statistically significant differences (p < 0.05) between the studied cohorts were found only in the number of meals and meat intake. In cohort C, the proportion of elderly women who mentioned ≥ 3 meals/day was higher than in cohort A (91.5 and 66.1%, respectively), and the proportion of those who reported
≥ 1 serving of meat 3 times a week was lower compared with cohort A (88 and 94.3%, respectively) (Table 2).
Table 1. Distribution of the frequency of elderly according to studied cohorts, nutritional status, and diet variables. São Paulo, Health, Well-being, and Aging Study, 2000 and 2010.
Variables
Cohort A Cohort C
p-value*
n % n %
Nutritional status
Normal weight 176 42.5 120 36.9
0.0040*
Underweight 63 15.5 35 9.4
Overweight 187 42.0 174 53.7
≥ 3 meals per day
Yes 283 66.0 289 88.3
0.0000*
No 142 34.0 38 11.7
≥ 1 serving of dairy products/day
Yes 341 79.3 226 69.2
0.0031*
No 85 20.7 103 30.8
≥ 1 serving of eggs and/or vegetables/week
Yes 405 95.3 316 95.6
0.8412
No 21 4.7 13 4.4
≥ 1 serving of meat 3 times/week
Yes 392 92.1 278 85.2
0.0050*
No 34 7.9 49 14.8
≥ 2 servings of fruits and vegetables/day
Yes 348 80.9 222 67.4
0.0001*
No 78 19.1 107 32.6
≥ 5 glasses of liquids/day
Yes 223 52.0 197 61.2
0.0182*
No 203 48.0 131 38.8
Men showed significant differences (p < 0.05) between the cohorts in the following diet variables: number of meals, dairy products intake, consumption of meat, fruits and vege-tables, and liquids. Smaller proportions of elderly in the cohort C reported intake of dairy products (66.8% in cohort C; 83.3% in cohort A), meat (81.4% in cohort C; 90.3% in cohort A), and fruits and vegetables (59.6% in cohort C; 83.9% in cohort A), and a higher propor-tion of elderly reported intake of ≥ 5 glasses of liquids (71.1% in cohort C; 49.3% in cohort
Table 2. Distribution of the frequency of women, according to studied cohorts, nutritional status, and diet variables. São Paulo, Health, Well-being, and Aging Study, 2000 and 2010.
Variables
Cohort A Cohort C
p-value*
n % n n
Nutritional status
Normal weight 87 50.6 61 30.3
0.0000*
Underweight 31 18.0 23 10.2
Overweight 53 31.4 125 59.5
≥ 3 meals per day
Yes 114 66.1 188 91.5
0.0000*
No 57 33.9 20 8.5
≥ 1 serving of dairy products/day
Yes 128 74.2 150 71.0
0.5194
No 43 25.8 59 29.0
≥ 1 serving of eggs and/or vegetables/week
Yes 166 97.2 200 96.0
0.3268
No 5 2.7 9 4.0
≥ 1 serving of meat 3 times/week
Yes 162 94.3 181 88.0
0.0442*
No 9 5.7 27 12.0
≥ 2 servings of fruits and vegetables/day
Yes 132 77.1 154 73.2
0.4147
No 39 22.9 55 26.8
≥ 5 glasses of liquids/day
Yes 96 55.3 112 53.8
0.7749
No 75 44.7 96 46.2
A) and ≥ 3 meals/day (84.0% in cohort C; 66.0% in cohort A), with statistically significant difference (p < 0.05) (Table 3).
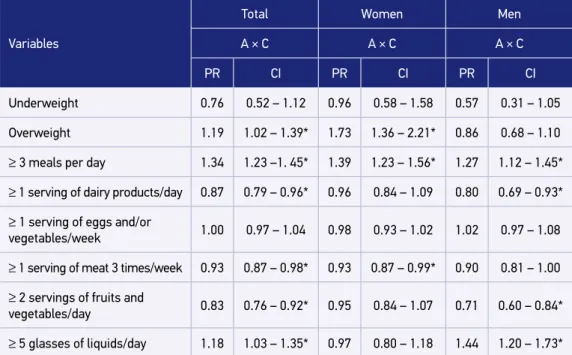
Elderly people in the cohort C showed higher PR for overweight (PR = 1.19), ≥ 3 meals/day (PR = 1.34), and ≥ 5 glasses of liquids/day (PR = 1.18), but lower PR for dairy products (PR = 0.87), meat (PR = 0.93), and fruits and vegetables (PR = -0.83), with a statistically significant difference (p < 0.05) (Table 4).
Table 3. Distribution of the frequency of men, according to studied cohorts, nutritional status, and diet variables. São Paulo, Health, Well-being, and Aging Study, 2000 and 2010.
Variables
Cohort A Cohort C
p-value*
n % n n
Nutritional status
Normal weight 89 36.2 59 45.6
0.1567
Underweight 32 13.6 12 8.3
Overweight 134 50.3 49 46.1
≥ 3 meals per day
Yes 169 66.0 101 84.0
0.0013*
No 85 34.0 18 16.0
≥ 1 serving of dairy products/day
Yes 213 83.3 76 66.8
0.0007*
No 42 16.7 44 33.2
≥ 1 serving of eggs and/or vegetables/week
Yes 239 93.7 116 96.0
0.4298
No 16 6.3 4 4.0
≥ 1 serving of meat 3 times/week
Yes 230 90.3 97 81.4
0.0266*
No 25 9.7 22 18.6
≥ 2 servings of fruits and vegetables/day
Yes 216 83.9 68 59.6
0.0000*
No 39 16.1 52 40.4
≥ 5 glasses of liquids/day
Yes 127 49.3 85 71.1
0.0004*
No 128 50.7 35 28.9
Table 4. Comparison between cohorts studied, according to nutritional status, diet variables, and gender. São Paulo, Health, Well-being, and Aging Study, 2000 and 2010.
Variables
Total Women Men
A × C A × C A × C
PR CI PR CI PR CI
Underweight 0.76 0.52 – 1.12 0.96 0.58 – 1.58 0.57 0.31 – 1.05
Overweight 1.19 1.02 – 1.39* 1.73 1.36 – 2.21* 0.86 0.68 – 1.10
≥ 3 meals per day 1.34 1.23 –1. 45* 1.39 1.23 – 1.56* 1.27 1.12 – 1.45*
≥ 1 serving of dairy products/day 0.87 0.79 – 0.96* 0.96 0.84 – 1.09 0.80 0.69 – 0.93*
≥ 1 serving of eggs and/or
vegetables/week 1.00 0.97 – 1.04 0.98 0.93 – 1.02 1.02 0.97 – 1.08
≥ 1 serving of meat 3 times/week 0.93 0.87 – 0.98* 0.93 0.87 – 0.99* 0.90 0.81 – 1.00
≥ 2 servings of fruits and
vegetables/day 0.83 0.76 – 0.92* 0.95 0.84 – 1.07 0.71 0.60 – 0.84*
≥ 5 glasses of liquids/day 1.18 1.03 – 1.35* 0.97 0.80 – 1.18 1.44 1.20 – 1.73*
Poisson regression model with robust variance; cohort A as reference category (value = 1.00); PR: prevalence ratio; CI: confidence interval.
In the cohort C, women showed higher PR values for overweight (PR = 1.73) and
≥ 3 meals/day (PR = 1.39), but lower PR (PR = 0.93) for meat consumption, with statis-tically significant difference (p < 0.05). With regard to men, PR values for ≥ 3 meals/day (PR = 1.27) and ≥ 5 glasses of liquids/day (PR = 1.44) were higher in cohort C and PR for intake of dairy products (PR = 0.80) and fruits and vegetables (PR = 0.71) were lower, with statistically significant difference (p < 0.05) (Table 4).
DISCUSSION
The most recent cohort of elderly people (cohort C, born between 1946 and 1950) showed worse nutritional status and dietary intake compared with the oldest cohort (cohort A, born between 1936 and 1940).
There was a higher proportion of elderly overweight (19%) in cohort C and this result is consistent with those of other studies in the national8,15 and international6,7 scientific liter-ature, which showed elderly of “older generations” might present better health and nutri-tion condinutri-tions.
Lahti-Koski and colleagues7 found higher prevalence of obesity and higher average BMI values, especially among the elderly who were born in the most recent cohort, when they analyzed two cohorts from Finland in the year 1972 and 1997 (1913 – 1917 and 1968 – 1972).
A study on Swedish cohorts of elderly people aged 70 years or older (in a time frame of 30 years) found changes in the prevalence of obesity, with higher overweight rates in the most recent birth cohorts6.
Brazilian study of birth cohorts (1916 – 1926 and 1927 – 1937) of the Bambuí Project (MG) also showed similar results. Firmo and colleagues15 found lower overweight preva-lence among elderly who were born in older cohorts. Sales et al.8 analyzing anthropometric differences of the elderly in different cohorts found higher overweight rates among individ-uals in the youngest cohort.
Overweight and obesity among the elderly result from changes in lifestyle, especially in eating habits and physical activity, according to the data showed in the POF held in 2008/20095.
It is worth noting that studies have shown a higher prevalence of these nutritional dis-orders in the adult population, which directly influence the higher rates among the elderly. Keyes et al.16 and Reither et al.17 analyzed the secular trends of obesity in adults and found higher prevalence in more recent birth cohorts.
Analyzing the differences in nutritional status by gender, a higher PR for overweight was observed among women in the most recent cohort (cohort C), which is a worri-some finding as this nutritional disorder can cause physiological, psychological, and social changes, such as insulin resistance, depression, and social isolation. Nutritional disorders may also contribute to the development of NCDs thus increasing the risk of premature death18.
Studies of cohorts conducted in Finland and Sweden also found higher prevalence of overweight and obesity in women who were born in more recent cohorts6,7. In contrast, a Brazilian research (1916 – 1926 and 1927 – 1937) showed that overweight was higher among men, although the years of birth differ from this study8.
calcium, whose intake recommendation is higher for elderly because of the decreased bone mineral density and consequent risk of developing osteopenia, osteoporosis, and fractures, especially in case of falls. Special attention should be given to this food group for this population19.
Fisberg and colleagues20 analyzed the national survey data from POF in 2009 on the food habits of elderly people and found that, among the minerals, calcium showed the highest prevalence of inadequate intake in all regions of the country for both men (84 – 98%) and women (94 – 98%) of the elderly population.
Eiben et al.9 analyzed, from data collected in 1971, 1981, 1992, and 2000, the trends on eating habits in cohorts of Swedish elderly aged 70 years and older, born in 1901, 1911, 1922, and 1930. They found that older cohorts reported higher intake of yogurt, cereals, fruits, vegetables, chicken, rice, and pasta. In this study, cohort C presented a lower proportion of elderly who reported intake of fruits and vegetables (67.4% in cohort C and 80.9% in cohort A) and meat (85.2% in cohort C and 92.1% in cohort A).
With regard to gender, a lower proportion of women in the cohort C reported eating meat (88% in cohort C and 94.3% in cohort A), and the same occurred for men in the intake of fruits and vegetables (59.6% in cohort C and 83.9% in cohort A). This may be due to the replacement of these foods for other types of food and/or difficulties with chewing, with acquiring food, or because of financial issues21.
Fisberg and colleagues20 also observed that the consumption of fruits and vegetables reported by the Brazilian elderly people was insufficient, as the average food intake (in grams) of such foods represented approximately one-third of the recommendations from the Food Guide for the Brazilian population (≥ 400 g/day). These results require attention and more direct actions to encourage the intake of these foods, facilitating access to this population to reverse the current situation.
Despite the limitations of dietary survey of this study, comparisons of nutritional status and food intake of different birth cohorts over time are necessary and important in under-standing changes throughout life and aging process.
CONCLUSION
1. Lang IA, Llewellyn DJ, Alexander K, Melzer D. Obesity, physical function, and mortality in older adults. J Am Geriatr Soc 2008; 56: 1474-8.
2. Saka B, Kaya O, Ozturk GB, Erten N, Karan MA. Malnutrition in the elderly and its relationship with other geriatric syndromes. Clin Nutr 2010; 29: 745-8.
3. Jensen GL, Hsiao PY. Obesity in older adults: relationship to functional limitation. Curr Opin Clin Nutr Metab Care 2010; 13: 46-51.
4. Donini LM, Savina C, Gennaro E, De Felice MR, Rosano A, Pandolfo MM, et al. A systematic review of the literature concerning the relationship between obesity and mortality in the elderly. J Nutr Health Aging 2012; 16 (1): 89-98.
5. Instituto Brasileiro de Geograf ia e Estatística (IBGE). Pesquisa de Orçamento Familiar 2008-2009: Antropometria e Estado Nutricional de crianças, adolescentes e adultos no Brasil. Rio de Janeiro; 2010.
6. Eiben G, Dey DK, Rothenberg E, Steen B, Bjorkelund C, Bengtsson C et al. . Obesity in 70-year-old Swedes: secular changes over 30 years. Int J Obes 2005; 29: 810-7.
7. Lahti-Koski M, Jousilahti P and Pietinen P. Secular trends in body mass index by birth cohort in eastern Finland from 1972 to 1997. Int J Obes 2001; 25: 727-34.
8. Sales AD, César CC, Lima-Costa MF, Caiaffa WT. Birth cohort differences in anthropometric measures in the older elderly: the Bambuí Cohort Study of Aging (1997 and 2008). Cad Saúde Pública 2011; 27: S418-26.
9. EibenG, Andersson CS, Rothenberg E, Sundh V, Steen B, Lissner L. Secular trends in diet among elderly Swedes – cohort comparisons over three decades. Public Health Nutr 2003; 7: 637-44.
10. Instituto Brasileiro de Geografia e Estatística (IBGE). Pesquisa de Orçamento Familiar 2002-2003: análise da disponibilidade domiciliar de alimentos e do estado nutricional no Brasil. Rio de Janeiro; 2004.
11. Instituto Brasileiro de Geografia e Estatística (IBGE). Pesquisa de Orçamento Familiar 2008-2009: Aquisição alimentar domiciliar per capita – Brasil e Grandes regiões. Rio de Janeiro; 2010.
12. Instituto Brasileiro de Geografia e Estatística (IBGE). Pesquisa de Orçamento Familiar 2008-2009: Análise do consumo alimentar pessoal no Brasil. Ministério do Planejamento, Orçamento e Gestão. Rio de Janeiro; 2011.
13. Silva NN. Aspectos metodológicos – processo de amostragem. In: Lebrão ML, Duarte YAO. O Projeto SABE no Município de São Paulo: uma abordagem inicial. Brasília: OPAS/MS; 2003. p. 45-57.
14. Organização Pan-Americana de Saúde (OPAS). XXXVI Reunión del Comitê Asesor de Investigaciones en Salud – Encuesta Multicêntrica – Salud, Bienestar y Envejecimiento (SABE) en América Latina y el Caribe: informe preliminar. 2001.
15. Firmo JO, Peixoto SV, Loyola Filho AI, Uchôa E, Lima-Costa MF. Birth cohort differences in hypertension control in a Brazilian population of older elderly: the Bambuí Cohort Study of Aging (1997 and 2008). Cad Saúde Pública 2011; 27: S427-34.
16. Keyes KM, Utz RL, Robinson W, Li G. What is a cohort effect? Comparison of three statistical methods for modeling cohort effects in obesity prevalence in the United States, 1971-2006. Soc Sci Med 2010; 70: 1100-8.
17. Reither EN, Hauser RM, Yang Y. Do birth cohorts matter? Age-period-cohort analyses of the obesity epidemic in the United States. Soc Sci Med 2009; 69: 1439-48.
18. Marucci MF, Almeida-Roediger M, Santos LO. Nutrição nos ciclos da vida: adultos e idosos. In: Cardoso MC. Nutrição em Saúde Coletiva. São Paulo: Atheneu; 2014 p.79-90.
19. El-Abbadi NH, Dao MC, Meydani SN. Yogurt: role in healthy and active aging. Am J Clin Nutr 2014; 99: 1263S-70S.
20. Fisberg RM, Marchioni DML, Castro, MA, Verjy Jr E, Araujo M, Bezerra IN, et al. Ingestão inadequada de nutrientes na população de idosos do Brasil: Inquérito Nacional de Alimentação 2008-2009. Rev Saúde Pública 2013; 47: 222-30.
21. Lopes ACS, Caiaffa WT, Sichieri R, Mingoti SA, Lima-Costa, MF. Consumo de nutrientes em adultos e idosos em estudo de base populacional: Projeto Bambuí. Cad Saúde Pública 2005; 21: 1201-9.
Received on: 07/01/2015
Final version presented on: 07/07/2015 Accepted on: 07/08/2015