EQUATIONS TO ESTIMATE TREE GAPS IN A PRECISION FOREST
MANAGEMENT AREA THE AMAZON BASED ON CROWN MORPHOMETRY
1Evandro Orfanó Figueiredo2*, Marcus Vinicio Neves d´Oliveira3, Philip Martin Fearnside4, Evaldo Muñoz
Braz5 and Daniel de Almeida Papa6
1 Received on 11.08.2013accepted for publication on 31.05.2017.
2 Instituto Nacional de Pesquisas da Amazônia, Doutorado em Ciências Florestas Tropicais, Amazônia, Brasil. E-mail:
3 Universidade Federal do Acre, Rio Branco, Brasil. E-mail: <marcus.oliveira.embrapa.br>.
4 Instituto Nacional de Pesquisas da Amazônia, Coodenação de Dinâmica Ambiental, Manaus, Brasil. E-mail: <[email protected]>. 5 Empresa Brasileira de Pesquisa Agropecuária, Embrapa Florestas, Colombo, Brasil. E-mail: <[email protected]>. 6 Universidade de Brasilia, Graduado em Engenharia Florestal, Distrito Federal-Brasilia, Brasil. E-mail: <[email protected]>.
*Corresponding author.
ABSTRACT –The precision forest management technique still has much to be improved with the incorporation of forest biometric techniques and forest profiling with airborne LIDAR. When planning the cutting of a tree in forest management, the volume to be produced for industry is estimated but not the area impacted by removal of the tree. The objective of the present study was to develop equations for the Amazon rainforest that are able to estimate the impact area of gaps from harvesting individual dominant and co-dominant trees based on the canopy morphology obtained through forest profiling. On two separate occasions profiles were made in an annual forest-production unit in the Antimary State Forest (FEA) in the state of Acre, Brazil. The first was done a few days before the start of logging in 2010 and the second was done after completion of harvest activities in 2011. With field measurements and processing of the cloud of LIDAR points, dendrometric and morphometric variables were obtained for the canopy in order to develop equations for estimating gap areas. After evaluation of the explanatory variables with the highest correlation with gap area, the method used considered all possible models and included 2-4 parameters. The explanatory variables that best represent the impact of clearings are volume of the crown (VCop) and crown-projection area (APC). Ten equations were selected, of which two were chosen for use; these had R2
aj> 75% and Syx <23%. The good fit of the
equations demonstrates the potential use of LIDAR to obtain information for estimating in advance the gaps in the forest cover that will be created from harvesting trees of different sizes.
Keywords: Linear regression model; Forest profiling; LIDAR.
EQUAÇÕES PARA ESTIMATIVA DE CLAREIRAS EM ÁREA DE MANEJO
FLORESTAL DE PRECISÃO NA AMAZÔNIA PELA MORFOMETRIA DAS
COPAS
com a clareira. As variáveis explicativas que melhor representam o impacto de clareiras são o volume de copa (VCop) e a área de projeção da copa (APC). Foram selecionadas dez equações e destas duas foram indicadas para uso, com R2
aj > 75% e Syx < 23%. O bom ajuste das equações demonstra o potencial do
uso do LIDAR visando obter informações para se estimar previamente as clareiras pela extração de árvores de diferentes dimensões.
Palavras-Chave: Modelo de regressão linear, Perfilamento florestal; Colheita florestal; LIDAR.
1. INTRODUCTION
Logging in forest management was considered for many years to be a precursor of inevitable impacts on the remnant forest. This view was due to the paucity of studies and due to use of inappropriate techniques and equipment.
Currently, forest management plans are licensed by Brazilian environmental agencies on the basis of criteria that mainly seek to minimize the impacts of logging on the diversity of forest species, as in maintaining a minimum number of remaining species. Therefore only about three dominant or codominant individuals are cut per hectare.
Natural forests are normally in a stable situation (Odum, 1988), with low annual increment. This situation is changed only when the forests suffer an impact, such as forest harvesting. When this occurs, a larger annual growth increment can be stimulated in the species of interest. One must therefore know the location and size of the possible new light gaps.
Until recently, damage control was only conducted by field staff (operators of chainsaws and of forestry machinery), and the forester could do little to contribute to the reduction of impacts through prior planning of forest harvest (Figueiredo, 2014). With the use of precision management techniques (Figueiredo et al., 2007), one can plan in the office with good level of accuracy in specifying the location of logging decks, roads and skid trails. The forester can also provide important information to the chainsaw operator for cutting trees that will have low impact on the remaining forest. All of this information is made available to field crews on a GPS Navigator through dynamic interactive maps.
Precision management in tropical forests has great scope for improvement with the incorporation of forest biometry and profiling techniques in large-scale forestry operations. Airborne LIDAR (Light Detection and Ranging) has wide potential application of this kind
of management, allowing application in large tracts of forest based on morphometry of tree crowns and sub-meter detail on watercourses and relief (D’Oliveira et al., 2012; Figueiredo et al., 2014). Stark et al. (2012), Sullivan et al. (2014), Palace et al. (2015) and Ferraz et al. (2016) have described the potential of LIDAR for modeling forest biometry, while Hunter et al. (2015) has proposed corrective measures to improve estimates of forest biometrics using LIDAR.
Forest profiling makes it possible to employ morphometric variables of the crown, but this technique is still little known and little used and in tropical-forest management (Hasenauer et al., 1995; Popescu et al., 2003). The difficulty of measuring morphometric variables in the field has caused these variables to be ignored, but the use of airborne LIDAR facilitates obtaining data on the crowns quickly and securely. When planning the harvest of a tree in forest management, the amount that the harvest will produce for the industry is estimated, but the area cleared by cutting the tree and its impact on the remaining population are not known and not estimated. Equations can be constructed that are able to estimate the impact of gaps generated by cutting trees. These equations use variables with values obtained with airborne LIDAR, such as the allometric equations developed by Zolkos et al. (2013), Bouvier et al. (2015), Ferraz et al. (2015), Shugart et al. (2015) and Balzotti et al. (2016).
2.MATERIALS AND METHODS 2.1. Location and characterization of the study area
The data used to test the methodology were obtained from a forest management area in the Antimary State Forest (FEA), located in the municipalities (counties) of Bujari and Sena Madureira in the state of Acre, Brazil. Forest harvesting was performed between July and September 2010 in an area of 315 ha.
According to Acre’s Ecological-Economic Zoning (Acre, 2000), the region that encompasses the FEA has mean annual rainfall of 2000 mm, mean temperature of 25oC and a dry season from June to September.
The forest consists of three main types: dense, open and open with bamboo (“taboca”). The predominant soils are dystrophic yellow latosols (Oxisols) with presence of micro-aggregates. The topography is gently undulating and the maximum elevation is approximately 300 m.
2.2. Forest profiling with airborne LIDAR
LIDAR profiling was done on two occasions: the first from 29 May to 3 June 2010 (a few days before the start of the forest harvest) and the second from 20 to 23 May 2011 (after the completion of harvest activities). For the profiling system we used an Optech 3100 ALTM attached to a twin-engine Piper Seneca II Neiva/Embraer model 810C airplane. The flight was carried out at an average speed of 210 km/h at a height of 300 m. The LIDAR beam had a diameter of 20 cm, divergence of 0.3 mrad, sweep angle of 15° and scan frequency of 58.7 Hz (D´Oliveira et al., 2012). The average intensity of profiling was 43.03 points/m2for the
pre-harvest survey and 22.92 points/m2 for the post-harvest
survey.
The LIDAR reflection data were initially structured in two files (pre- and post-harvest) forming a mosaic of 315 ha and about 135 million LIDAR pulses. The files were processed in a three-dimensional database in Quick Terrain Modeler software, which is specific for this task.
2.3. Forest Inventory and the composition of the sample of dominant and codominant trees
In order to plan harvesting in the 2010 annual-production unit of the management plan, a forest inventory census was made for all individuals of commercial interest
above 30 cm diameter at breast height (diameter measured 1.30 m above the ground) following the techniques recommended for precision management (Figueiredo et al., 2007). We identified and established the geographical location of each tree by obtaining barometric points calibrated with a high-sensitivity GPS. Botanical specimens of the species that make up the sample were deposited in the herbarium of the Federal University of Acre (UFAC/PZ).
The sample of 134 trees and gaps was structured proportionally and was stratified by diameter class for trees of commercial interest. The sample trees were felled and cubic scaling was performed using the Smalian method. Values for the dependent variable are from the measurements of the gaps as described in Section 2.5.
2.4. Preprocessing and isolation of the trees of interest
Initially, a digital terrain model (DTM) was generated from the automatic classification of laser points that reached the ground with classification values of 2. Subsequently a subtraction of the elevation values was performed in the full file of the DTM point cloud (Applied Imagery, 2010). This operation allows one to generate a normalized point cloud (i.e., without the effect of the elevation of the terrain). This allows highlighting the tree crowns of interest (the dominant and codominant trees), thus simplifying retrieval of crown-morphometry data.
The next step was the application of color filters considering the normalized height and texture of the target surface, followed by applying a control for reflection using “Voxel Autosize” feature in the Quick Terrain Modeling software. In this procedure, the control points are projected onto a surface and processed for display in different sizes based on their positions in relation to the plane of view (Applied Imagery, 2010). Points that are near the plane of view appear larger, while points farther away appear smaller. This process allows one to define the outline of dominant and codominant trees and facilitates the next step: isolating the trees of interest.
2.5. The dependent variable from the measurement of gaps
The area impacted by the falling of the harvested tree was the variable of interest to be modeled. We located the 134 sample trees and measured the gaps they created in the field using a high-sensitivity post-processed L1 GPS receiver and a rangefinder with centimeter precision. The post-processing reference database was the RIOB 93911 station of the Brazilian Network of Continuous Monitoring of Systems (GNSS).
Measurement of gaps in the field was conducted considering the gap-area concept of Runkle (1981), which uses the largest length between one edge and the other of the gap and the greatest distance perpendicular to this length measurement. This is adequate for the ellipse formula, as well as for measurement of the bole. This conceptual option follows the practice adopted in a number of studies (Brokaw, 1982; Runkle, 1982; Almeida, 1989; Barton et al., 1989), which assume that most gaps have an elliptical shape.
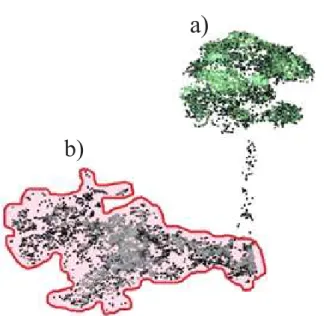
The perimeter (m) and the area (m2) of gaps were derived from processing and measuring the point cloud from the post-harvest profiling of the forest. This followed the same procedure as that for isolating the trees of interest (Figure 1).
2.6. Independent variables from morphometry of the crown and of the bole
The database for the independent variables in the models used to estimate the area of the gaps created by trees felled in forest management was structured initially with the inclusion of 17 dendrometric variables of the bole and of the crown morphometry. Stem variables were: diameter at breast height (DBH = trunk diameter measured 1.3 m above the ground or above any buttresses, in cm), basal area (G = area of the cross section of the trunk at the DBH height, in m2) and bole
volume (volume of the trunk to the first significant branch, measured by rigorous cubic scaling using the Smalian method, in m3). The remaining variables were
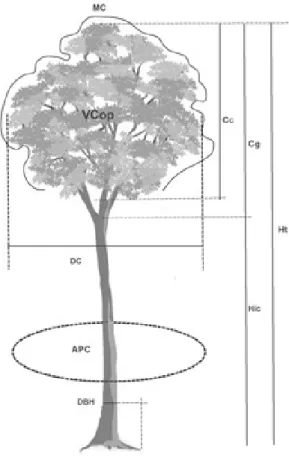
extracted from the crown morphometry (Figure 2), adapted from Burger (1939): length of the crown (Cc, in m), length of branches [limb length] (Cg, in m), mean diameter of the crown [average crown spread] (DC, in m), total height of the tree (Ht, in m), percentage of the crown (PC), degree of slenderness (GE), index of protuberance (IS), index of enclosure (IA), crown form (FC), crown insertion height (Hic, in m), crown volume by the solid of rotation that best models the crown (VCop, in m3) index of living space (IEV), crown projection area (APC, in m2) and mantle of
the crown (MC = surface area of the solid of rotation enclosing the crown, in m2).
VCop, APC and MC were obtained in digital form from LIDAR. These were obtained without field investigation due to the difficulty of measuring these variables in the forest. Values for the other 14 variables were obtained by processing the point cloud and were checked in the field.
2.7. Development of models to estimate gap areas of harvested trees
The gaps created by the 134 dominant and codominant trees were analyzed to determine the strength of the linear relationship between the dependent variable and the explanatory variables. This provides an initial indication of the most significant variables for the construction of models.
Explanatory variables with correlation coefficients lower than -0.65 and higher than 0.65 were subjected to a routine for selection of all possible models (Ryan, 2011), considering the combination of variables for
a)
b)
Figure 1– Clouds of LIDAR points: a) tree of interest Hymenaea courbaril L. var. stilbocarpa (Hayne) Lee et Lang (pre-harvest profiling), and b) gap generated by cutting the tree (post-harvest profiling) and demarcation of the area of impact.
building models that include two to four parameters (is) in a balanced way without multi-colinearity and with residuals that are normally distributed, independent and homoscedastic. The following statistical measures
were calculated: multi-colinearity matrix, standardized distribution of the error, Durbin-Watson (DW) statistic and Hartley F-max (SAS, 1990; Statgraphics, 2006). For the models proposed by the equation-building routine, estimates were obtained of gaps and statistical significance was determined by the Fisher F test for each variable added to the equation. The variables with significance levels < 0.15 were dropped from the polynomial in the interests of simplification.
2.8. Influence analysis
An influence analysis of the independent observations was performed considering individually each of the equations that had been fit for gap areas. To be classified as an influential observation, its inclusion should result in substantial changes in the calculated values of the statistics depending on the presence or absence of the observation.
The impacts of possibly influential observations for linear models were assessed with the following measures of atypical status: the elements of the principal diagonal of the H matrix, DFFITS and Cook’s distance. These measures are described by Chatterjee and Hadi (1986), Souza (1998), Figueiredo (2005) and Statgraphics (2006).
2.9. Criteria for choosing the equation with the best fit
The best equation was selected from results of the routine for generating all possible models. The selection was based on graphical analysis of the residuals (expressed as percentages), the absolute standard error (Syx), the percentage standard error (Syx%), the PRESSp criterion and the adjusted coefficient of determination (R2
aj%) (SAS, 1990; Souza, 1998).
3. RESULTS
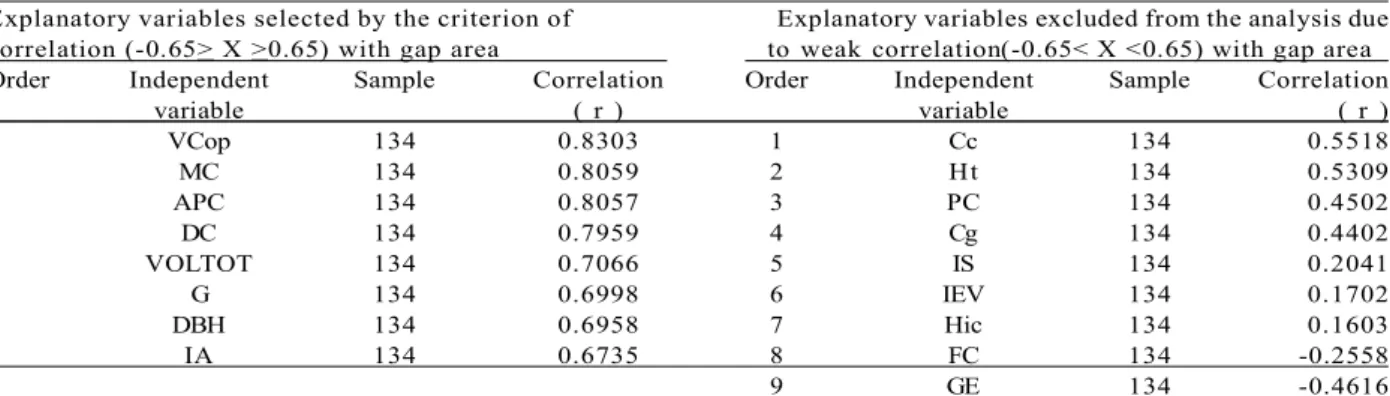
Of the 17 explanatory variables for potential inclusion in the regression models only eight showed strong positive correlations (X > 0.65) with the areas of gaps (Table 1). The four variables with the highest correlations were all for crown morphometry, and these values are easily obtained for dominant and codominant trees by processing the LIDAR point cloud.
The nine independent variables that did not meet the criterion for either positive or negative correlation (-0.65 < X < 0.65) did not show any clear trend of increase or decrease when related to gap area (Table 1). Instead
Figure 2 –Tree morphometric variables using LIDAR data
and DBH. Adapted from Burger (1939).
Figura 2 –Variáveis morfométricas da árvore empregando dados do LIDAR e DBH. Adaptado de Burger (1939).
Where:
Cc = Length of the crown (m)
Cg = Length of the branches (m)
DC = Diameter of the crown (mean in m)
Ht = Total height of the tree (m);
DBH = diameter at breast height measured in the field 1.3 m above the ground or above any buttresses (m)
Hic = Height of insertion of the crown [height above the ground of the first living branch]
APC = Crown projection area (m2)
VCop = Volume of the crown from the solid of rotation that best models the crown (m3)
MC = Mantle of the crown (surface area of the solid of rotation in m2)
PC = (Cc / Ht) × 100 - Percentage of crown (%)
GE = Ht / DBH - Degree of slenderness
IS = DC / DBH - Index of protuberance
IEV = (DC / DBH)2 - Index of living space IA = DC / Ht - Index of enclosure
there was a dispersion of values of the predictor variables, especially for gaps in the range between 600 to 900 m2.
Considering the same criterion for classification used by Jardim et al. (2007), the current study found 47 small gaps (35.1% of the sample); 50 medium gaps (37.3% of the sample) and 37 large gaps (27.6% of the sample). The sizes of the gaps ranged from 406.3 m2
to 1238.4 m2 with a mean value of 526.28 m2 ±45.89 m2
(n = 134). The mean size of the crown-projection area (APC) was 344.27 m2 ±41.86 m2 (n = 134), while the
mean volume of the crown (VCop) was 2427.21 m3 ±426.72
m3 (n = 134) and the mean diameter of the crown (DC)
was 21.29 m ±1.21 m (n = 134).
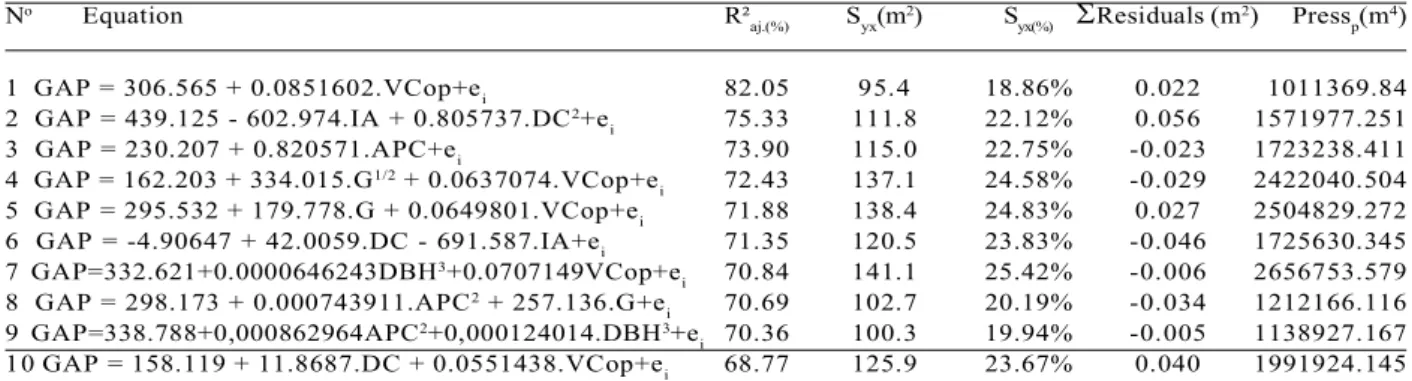
When testing the possible combinations of variables with the “all possible models” routine (Statgraphics, 2006), 21 promising equations were chosen for estimation of gap area. This methodology considers the analysis of all possible sets of submodels consisting of “p” variables indicated by the correlation matrix and identifies the best results in accord with pre-established evaluation criteria. However, 11 equations presented problems of multi-colinear variables and/or were non-significant by the Fisher F test, demanding in either case an assessment of the presence or absence of the variable in the model. In cases where the removal from the model
of a variable that had severe multi-colinearity or that was not significant (F test), it was necessary to fit a new equation and repeat the statistical analyses. The equations chosen by the routine are shown in Table 2.
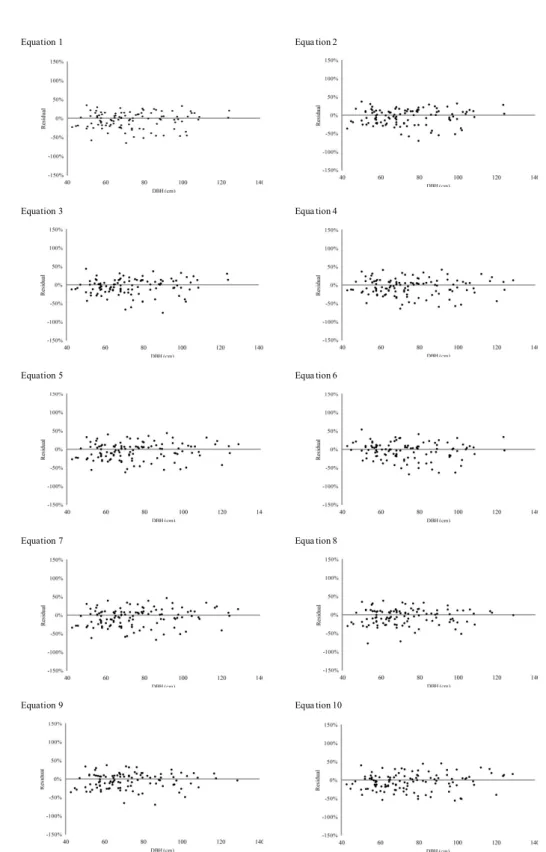
Figure 3 presents the graphical analysis of the percentage residuals of the equations for estimating the areas of individual gaps.
4.DISCUSSION
The matrix of correlations between the independent variables and the variable being modeled is an important instrument for prior selection of variables that can compose the model for the estimate. The values of VCop, MC, APC and DC tended to increase as the area of the gap increased. This is most clearly observed in the medium and large crowns with diameters exceeding 20 m. The population of trees with crowns in this size is dominated by Dipteryx odorata Wild (“cumaru ferro”), Ceiba pentandra (L.) Gaertn. (“samauma”), Apuleia leiocarpa (Vogel) J.F. Macbr. (“cumaru cetim”) and Couratari oblongifolia Ducke and R. Knuth (“tauari”). Variables with correlations -0.65 < X < 0.65 were not included in the routine for selection of all possible models (Ryan, 2011). This was because including these variables would not have contributed to improving
Explanatory variables selected by the criterion of Explanatory variables excluded from the analysis due correlation (-0.65> X >0.65) with gap area to weak correlation(-0.65< X <0.65) with gap area Order Independent Sample Correlation Order Independent Sample Correlation
variable ( r ) variable ( r )
1 VCop 134 0.8303 1 Cc 134 0.5518
2 MC 134 0.8059 2 Ht 134 0.5309
3 APC 134 0.8057 3 PC 134 0.4502
4 DC 134 0.7959 4 Cg 134 0.4402
5 VOLTOT 134 0.7066 5 IS 134 0.2041
6 G 134 0.6998 6 IEV 134 0.1702
7 DBH 134 0.6958 7 Hic 134 0.1603
8 IA 134 0.6735 8 FC 134 -0.2558
9 GE 134 -0.4616
In which: VCop = volume of the crown from the solid of rotation that best models the crown (m3); MC = mantle of the crown (surface
area of the solid of rotation in m2); APC = crown projection area (m2); DC = diameter of the crown (mean in m); VOLTOT = total volume
of the bole (m3); G = basal area (m3); DBH = diameter at breast height measured in the field 1.3 m above the ground or above any buttresses
(m); IA = DC / Ht - index of enclosure; Cc = length of the crown (m); Ht = total height of the tree (m); PC = (Cc / Ht) x 100 - percentage of crown (%); Cg = length of the branches (m); IS = DC / DBH - index of protuberance; IEV = (DC / DBH)2 - Index of living space;
Hic = height of insertion of the crown [height above the ground of the first living branch]); FC = DC / Cc - form of the crown; GE = Ht / DBH - degree of slenderness.
Table 1 – Correlation between the independent variables and the area of the gaps created by trees cut under conditions
of forest management, Antimary State Forest (FEA), Acre, Brazil.
the models, would inflate the statistical results (R2)
and would cause multi-colinearity.
One of the strategies for forest management is for trees suitable for cutting to be harvested in the manner that causes the least damage to the remaining stock that will compose future crops. This makes the area impacted by gaps an important indicator for forest harvesting.
Jardim et al. (2007) grouped gaps into three size categories: small (200 m2 < area < 400 m2), medium (400
m2 < area < 600 m2) and large (> 600 m2). Considering
this classification, the 134 gaps that make up the sample resulted in a proportionate distribution within the size classes. However, more than 60% of the gaps were classified as medium or large. This result is strongly related to the selection of trees to be cut in management, which always gives priority to dominant and codominant individuals, i.e. with greater crown-projection area (APC) and, consequently, a greater volume of the crown (VCop) and bole. Similar results were also obtained in studies of natural forests by Almeida (1989) and Martins (1999). Denslow and Hartshorn (1994) and Jardim et al. (2007) and Denslow concluded that large gaps are unfavorable sites for the growth of most species of commercial interest and that these gaps favor the development of undesirable heliophilic species. Thus, a more balanced selection of trees to be harvested that considers crown morphometric information would be beneficial to the quality of the remaining forest.
The crown-projection area (APC) (m2) and the volume of the crown (VCop) (m3) are properties that hark back to the origin of the concept of horizontal dominance, which is defined by the volumetric space that the tree occupies in the ecosystem (Scolforo, 1998). The difficulty of measuring this spatial dominance has resulted in the widespread use of basal area at the DBH height as a variable to correlate with spatial dominance. However, when considering the trees that have reached the upper canopy of the forest, it is now possible to directly use the original concept of spatial dominance because crown data can be obtained with centimeter accuracy through airborne laser profiling in large-scale forest surveys, as has been reported by Ferraz et al. (2015).
VCop and DC are strongly correlated with the area impacted by the gap and are positively related to DBH and G. Thus, as the values of DC and VCop increase, DBH also increases, indicating that large crown structures require large bole dimensions.
Discrepancies between crown size and DBH occur in less than 3% of the sample and indicate the trees with broken and incomplete crowns. These trees are clearly revealed by the LIDAR point-cloud processing and they were removed from the database for the analysis of influence when the observation was both meaningful for the statistics of the diagonal of the H matrix, DFFITS and Cook´s distance.
These results point to a new strategy for selecting trees to be harvested. The first criterion to be considered is the harvest of trees with broken crowns and large
No Equation R²
aj.(%) Syx(m2) Syx(%) Residuals (m2) Pressp(m4)
1 GAP = 306.565 + 0.0851602.VCop+ei 82.05 95.4 18.86% 0.022 1011369.84
2 GAP = 439.125 - 602.974.IA + 0.805737.DC2+e
i 75.33 111.8 22.12% 0.056 1571977.251
3 GAP = 230.207 + 0.820571.APC+ei 73.90 115.0 22.75% -0.023 1723238.411
4 GAP = 162.203 + 334.015.G1/2 + 0.0637074.VCop+e
i 72.43 137.1 24.58% -0.029 2422040.504
5 GAP = 295.532 + 179.778.G + 0.0649801.VCop+ei 71.88 138.4 24.83% 0.027 2504829.272
6 GAP = -4.90647 + 42.0059.DC - 691.587.IA+ei 71.35 120.5 23.83% -0.046 1725630.345
7 GAP=332.621+0.0000646243DBH3+0.0707149VCop+e
i 70.84 141.1 25.42% -0.006 2656753.579
8 GAP = 298.173 + 0.000743911.APC2 + 257.136.G+e
i 70.69 102.7 20.19% -0.034 1212166.116
9 GAP=338.788+0,000862964APC2+0,000124014.DBH3+e
i 70.36 100.3 19.94% -0.005 1138927.167
10 GAP = 158.119 + 11.8687.DC + 0.0551438.VCop+ei 68.77 125.9 23.67% 0.040 1991924.145
Table 2 – Equations and statistics for estimating the gap areas created by trees felled during forest management in the Antimary State Forest (FEA), Acre, Brazil.
Tabela 2 – Equações e estatísticas para estimativa da área de clareira das árvores cortadas em manejo florestal na Floresta Estadual do Antimary - FEA, Acre, Brasil.
In which: R²aj.(%) = adjusted coefficient of determination; Syx(m2) = standard error of the estimate; Syx(%) = standard error of the estimate
as a percentage; Residuals (m2) = sum of the residuals and Press
Equation 1 Equa tion 2
Equation 3 Equa tion 4
Equation 5 Equa tion 6
Equation 7 Equa tion 8
Equation 9 Equa tion 10
Figure 3 – Distribution of percentage residuals for Equations 1 to 10, Antimary State Forest, Acre, Brazil.
volumes, since cutting these trees causes little environmental impact on the remaining population. Equations 4, 5, 7, 8 and 9, which were selected by the routine for all possible models (Statgraphics, 2006), have different intensities of multi-colinearity. However, this problem is mitigated by the effect of the whole or fractional power of the independent variables.
The best statistical results can be observed in Equations 1 and 2. Equation 1 is especially good, with a mean percentage standard error (Syx%) less than 25%, a sum of residuals approaching zero and an adjusted coefficient of determination above 80%. Equation 1, which has the volume of the crown (VCop) as the only explanatory variable for estimating gaps, demonstrates the predictive potential of morphometric variables and shows that this information is directly related to the spatial dominance of the tree in the forest environment. This corroborates the results reported by Brokaw (1982) and Runkle (1990).
The volume of the crown (m3) (VCop) is obtained
by a computational procedure extracted from the LIDAR database and represents the internal space of the solid of rotation that best models the canopy. This volume includes leaves, twigs (thick and thin) and the empty spaces inside the crown. It is therefore not a measure of the volume of wood, but rather provides information on the individual’s crown architecture. This crown morphometric feature provides significant information on the horizontal and vertical structure of the forest, as has been described by Ferraz et al. (2015, 2016) Equation 2 had the second-best set of statistical results, but with a higher standard error. Independent variables in this equation represent the crown in three-dimensional space, with the incorporation of the mean diameter of the crown [average crown spread] (DC), which has a quadratic effect, and the index of enclosure (IA), which is represented by the ratio between DC and the total height of the tree (Ht). The total height of the tree alone did not meet the criteria in the correlation matrix, since this variable has a weak relationship with gap size. However, when considered in the IA, the total height also represents the concept of spatial dominance in three dimensions (X, Y, Z) in the forest environment and approaches the statistical values achieved by VCop (volume of the crown) as an explanatory variable.
Measurement of VCop in the field is impractical for dominant and codominant trees (Detto et al., 2015) and its representation without the use of laser technology is given by morphometric indices of the crown represented by: percentage of the crown (PC), crown form (FC), degree of slenderness (GE), index of enclosure (IA), index of living space (IEV) and index of protuberance (IS). These have been used in numerous studies of the crown such as Burger (1939), Dawkins (1963), Hasenauer et al. (1995), Pretzsch (1995), Durlo and Denardi (1998) and Cunha (2009).
In Equation 1, the distribution of percentage residuals along the sequence of diameter classes showed no tendency to either under or overestimate, and the standard error always remained within the limit of ± 50%. The same features of the graphical distribution of Equation 1 were also observed for Equation 2, but with more scattered errors in the diameter range between 80 and 100 cm, with errors reaching ± 69%. For Equations 4 and 5, which had some multi-colinearity, one can observe a distribution of residuals without trends. However, there is greater amplitude along the sequence of diameter classes. Equations 7, 8 and 9 had a tendency to overestimate, reaching values above 70%.
Equations 3 and 6 showed a tendency to overestimate and had lower accuracy. They also showed greater dispersion of residuals in Cartesian space (+X,-Y).
The literature on equations for estimating the areas gaps caused by individual trees is scarce. Most of the existing studies are on gaps from natural causes (Molino and Sabatier, 2001; Espírito-Santo et al., 2010; Kellner and Asner, 2014; Hunter et al., 2015). The demand for estimating gaps in future forest management areas has arisen with the adoption of precision-management techniques in planning and harvesting activities in tropical forests. It is expected that the more routine use of LIDAR in forest planning will extend the possibility of studies for prediction of negative and positive impacts of gaps in the field of forest management.
5. CONCLUSIONS
Regardless of their size, gaps from selective logging are easily identified by profiling with airborne LIDAR. Trees with damaged or broken crowns can be identified by processing the LIDAR point cloud, and these trees can be identified as outliers by means of influence analysis.
employed to generate equations for estimating the areas of gaps created by individual trees. The most accurate equations included the following explanatory variables: volume of the crown (VCop)(m3), mantle of the crown
(MC) (m2) and crown-projection of area (APC) (m2).
Based on morphological information extracted from processing the point cloud generated by airborne LIDAR, it is possible to estimate with precision the areas of gaps that will be created by trees to be cut under forest management.
6. ACKNOWLEDGMENTS
The authors’ research is supported by: Empresa Brasileira de Pesquisa Agropecuária (EMBRAPA), Conselho Nacional do Desenvolvimento Científico e Tecnológico (CNPq: Proc. 305880/2007-1; 304020/2010-9; 573810/2008-7; 575853/2008-5) and Instituto Nacional de Pesquisas da Amazônia (INPA: PRJ13.03). Reviewer comments were very helpful.
7. REFERENCES
Acre. Governo do estado do Acre. Programa Estadual de Zoneamento Ecológico-Econômico do Estado do Acre. Zoneamento
ecológico-econômico: recursos naturais e meio ambiente. Rio Branco: SECTMA; 2000. v.1. 116p.
Almeida SS. Clareiras naturais na Amazônia Central: abundancia, distribuição, estrutura e aspectos da colonização vegetal. [dissertação] Manaus: Instituto Nacional de Pesquisas da Amazônia; Universidade Federal do Amazonas; 1989.
Applied Imagery. Quick terrain modeler – LIDAR exploitation software, Version 7. User´s manual, applied imagery. Maryland: Silver Springs; 2010. 232p.
Balzotti CS, Asner GP, Taylor PG, Cole R, Osborne BB, Cleveland CC et al. Topographic distributions of emergent trees in tropical forests of the Osa Peninsula, Costa Rica. Ecography. 2016;39:1-11.
Barton AM, Fetcher N, Redhead S. The relationship between treefall gap size and light flux in a
Neotropical rain forest in Costa Rica. Journal of Tropical Ecology. 1989;5:437-9.
Bouvier M, Durrieu S, Fournier RA, Renaud
JP.Generalizing predictive models of forest inventory attributes using an area-based approach with airborne LiDAR data. Remote Sensing of
Environment. 2015;156:322-34.
Brokaw NVL. The definition of tree fall gap and its effect on measures of forest dynamics. Biotropica. 1982;14:158-60.
BurgerH.Baumkroneundzuwachsinzweihiebsreifen fichtenbeständen.MitteilungenderSchweizerischen AnstaltfürdasForstlicheVersuchswesen.
1939;21:147-76.
Chatterjee S, Hadi AS. Influential observations, high leverage points, and outliers in linear regression. Statistical Science. 1986;3:379-416.
Cunha TA. Modelagem do incremento de árvores individuais de Cedrela odorata L. na floresta amazônica [dissertação]. Santa Maria: Universidade Federal de Santa Maria, 2009.
Dawkins H.C. Crown diameters: their relationship to bole diameter in tropical trees. Commonw. Forest Review. 1963;42:318-33.
Denslow JS, Hartshorn GS. Tree-fall gap environments and forest dynamic process. In: McDade L, Bawa KS, Hespenheide HA, Hartshorn GS editors. La Selva-ecology and natural history of a neotropical rain forest. Chicago: The University of Chicago Press, 1994. p.120-7.
Detto M, Asner G, Muller-Landau H, Sonnentag O. Spatial variability in tropical forest leaf area density from multi-return lidar and modeling. Journal of Geophysical Research. 2015;120:294-309.
D´Oliveira MVN, Braz EM. Estudo da dinâmica da floresta manejada no projeto de manejo florestal comunitário do PC Peixoto na Amazônia Ocidental. Acta Amazônica. 2006;36:177-82.
D’Oliveira MVN, Reutebuch SE, Mcgaughey RJ, Andersen HE. Estimating forest biomass and identifying low-intensity logging areas using airborne scanning LIDAR in Antimary State Forest, Acre State, Western Brazilian Amazon. Remote Sensing of Environment. 2012;124:479-91.
Espírito Santo FDB, Keller M, Braswell B, Nelson BW, Frolking S, Vicente G. Storm intensity and old growth forest disturbances in the Amazon
region. Geophysical Research Letters. 2010;37: L11403.
Ferraz A, Mallet C, Jacquemoud S, Gonçalves GR, Tomé M, Soares P et al. Canopy density model: A new ALS-derived product to generate multilayer crown cover maps. Remote Sensing of
Environment. 2015;168:102-12.
Ferraz A, Saatchi S, Mallet C, Meyer V. Lidar detection of individual tree size in tropical forests. IEEE Transactions on Geoscience and Remote Sensing. 2016;183:318-33.
Figueiredo E.O. Avaliação de povoamentos de teca (Tectona grandis L.f.) na microrregião do Baixo Rio Acre [dissertation]. Lavras:
Universidade Federal de Lavras; 2005.
Figueiredo EO, Braz EM, D´Oliveira MVN. Manejo de precisão em florestas tropicais: modelo digital de exploração florestal. Rio Branco: Embrapa Acre; 2007.183p.
Figueiredo EO, D´Oliveira MVN, Fearnside PM, Papa DP. Modelos para estimativa de volume de árvores individuais pela morfometria da copa obtida com LiDAR. Cerne. 2014;20:621-8.
Figueiredo EO. Modelagem biométrica para árvores individuais a partir do LIDAR em área de manejo de precisão em florestas tropicais na Amazônia Ocidental [thesis]. Manaus: Instituto de Pesquisas da Amazônia; 2014.
HasenauerH,MoserM,EckmüllnerO.Ein ProgrammzurModellierungvon
Wachstumsreaktionen.AllgemeineForstzeitung. 1995;4:216-8.
Hunter MO, Keller M, Morton D, Cook B, Lefsky M, Ducey M et al. Structural dynamics of tropical moist forest gaps. PloS One. 2015;10: e0132144.
Jardim FCS, Serrão DR, Nemer TC. Efeito de diferentes tamanhos de clareiras, sobre o
crescimento e a mortalidade de espécies arbóreas, em Moju-PA. Acta Amazonica. 2007;37:37-48.
Kellner JR, Asner GP. Winners and losers in the
competition for space in tropical forest canopies. Ecology Letters. 2014;17:556-62.
Lopes JCA. Demografia e flutuações temporais da regeneração natural após uma exploração florestal: Flona do Tapajós-Pará [dissertação]. Piracicaba: Universidade de São Paulo; 1993.
Martins SV. Aspectos da dinâmica de clareiras em uma floresta estacional semi decidual no
município de Campinas, SP [thesis]. São Paulo: Universidade de São Paulo; 1999.
Molino JF, Sabatier D. Tree diversity in tropical rain forests: a validation of the intermediate disturbance hypothesis. Science. 2001;294:1702-4.
Odum EP. Ecologia. Rio de Janeiro; Guanabara Koogan; 1988. 434p.
Palace MW, Sullivan FB, Ducey MJ, Treuhaft RN, Herrick C, Shimbo JZ et al. Estimating forest structure in a tropical forest using field measurements, a synthetic model and discrete return LIDAR data. Remote Sensing of Environment. 2015;161:1-11.
Popescu SC, Wynne RH, Nelson RF. Measuring individual tree crown diameter with LIDAR and assessing its influence on estimating forest volume and biomass. Canadian Journal of Remote Sensing. 2003;29:564-77.
Pretzsch H. Perspektiven einer modellorientierten Waldwachstumsforschung. Forstwissenschaftliches Centralblatt. 1995;114:188-209.
Runkle JR. Gap formation in some old-growth forests of the eastern United States. Ecology. 1981;62:1041-51.
Runkle JR. Patterns of disturbance in some old growth mesic forests of eastern North America. Ecology. 1982;63:1533-46.
Runkle JR. Gap dynamics of Ohio-Fagus forest and speculations on the geography of
disturbance. Canadian Journal of Forest Research. 1990;20:632-42.
SAS Institute. SAS User’s guide: statistics. Release 6.03. Cary: 1990.
Scolforo JRS. Biometria florestal: medição e volumetria de árvores. Lavras: Fundação de Apoio ao Ensino, Pesquisa e Extensão/Universidade Federal de Lavras; 1998. 310p.
Shugart HH, Asner GP, Fischer R, Huth A, Knapp N, Le Toan T et al. Computer and remote sensing infrastructure to enhance large scale testing of individual based forest models. Frontiers in Ecology and the Environment. 2015;13:503-11.
Souza G.S. Introdução aos modelos de regressão linear e não-linear. Brasília, DF: Embrapa-SPI/ Embrapa-SEA; 1998. 505p.
Stark SC, Leitold V, Wu JL, Hunter MO, De
Castilho CV, Costa FR et al. Amazon forest carbon dynamics predicted by profiles of canopy leaf area and light environment. Ecology
Letters. 2014;15:1406-14.
Statgraphics. Statgraphics Centurion XV: User´s guide. Warrenton: 2006. 299p.
Sullivan FB, Palace M, Ducey M. Multivariate statistical analysis of asynchronous LIDAR data and vegetation models in a neotropical
forest. Remote Sensing of Environment. 2014;154:368-77.