Engineering
ISSN: 1809-4430 (on-line)
_________________________
1 Federal University of Viçosa/Viçosa-MG, Brazil. 2 PUC MINAS/Belo Horizonte-MG, Brazil.
3 Geological Survey of Brazil/Belo Horizonte-MG, Brazil. *Corresponding author. E-mail: [email protected]
EXTRAPOLATION OF REGIONALIZATION EQUATIONS FOR LONG-TERM AVERAGE FLOW
Doi:http://dx.doi.org/10.1590/1809-4430-Eng.Agric.v36n5p830-838/2016
FERNANDO F. PRUSKI1, RENATA DEL GIUDICE RODRIGUEZ1, PEDRO L. PRUSKI1,
ALINE DE A. NUNES2, FERNANDO S. REGO3*
ABSTRACT: Knowledge about long-term average flow is essential for planning and managing
water resources because it represents the potential water availability. One technique used to determine streamflow is regionalization, but because most gauge stations normally are associated with large drainage areas, the extrapolation of regionalization equations does not accurately represent the water availability; therefore, this method is not recommended. The main objective of the present paper is to propose a new method of estimating water availability that minimizes the risks of extrapolating regionalization equations for long-term average flow. The method is based on the use of a threshold value of the runoff coefficient to obtain the long-term average flow at the positions of the basin where the runoff coefficient estimated by the regionalization equation exceeds the threshold value. It was found that values of the runoff coefficient estimated average flows greater than twice those of the threshold values. The use of this method allows a reliable estimation for long-term average flows in regions of extrapolation without compromising the security of the available water supply.
KEY WORDS:water availability, planning and management of water resources, water safety.
INTRODUCTION
Potential water availability is represented by long-term average flow. Knowledge about water availability is essential for both the planning and management of water resources (MASIH et al., 2010) because it represents the highest streamflow that can be regularized without considering the losses due to evaporation and infiltration (PRUSKI & PRUSKI, 2011).
The quantification of streamflow on the hydrography helps policymakers to decide the best water use (PRUSKI & PRUSKI, 2011; FIOREZE & OLIVEIRA, 2010), but this quantification, when available, is restricted to places where the gauge stations are located. Generally, there are no measurements of streamflow in parts of the rivers in which the estimate of it is required (ARAI et al., 2012). To fix this problem, streamflow regionalization, which is a technique used to supply hydrological information about places with little or no data available, has been frequently employed (MASIH et al., 2010; MAMUN et al., 2010; SAMUEL et al., 2011).
Extrapolating regression equations beyond the limits of the sample data used to estimate the parameters of the linear regression model is not usually recommended and has been discouraged for two main reasons. First, the confidence interval on the regression line expands as the independent variable values deviate from the average. Second, the relationship between the independent and dependent variables may not be linear for extrapolated values used in the regression (NAGHETTINI & PINTO, 2007).
In a study on streamflow regionalization performed in the Ijuí River basin, which is located in the Rio Grande do Sul State (Brazil), SILVA JÚNIOR et al. (2003) observed that the behavior of extrapolation of long-term average flow for basins with drainage areas smaller than those used to obtain the regionalization models presented high uncertainty in the variables obtained with a tendency to overestimate these streamflows.
The impossibility of estimating streamflows for drainage areas smaller than the areas among the gauge stations limits the estimation of water availability to an insignificant part of the hydrography, which prevents planning and managing water resources for a large part of the hydrography. The statistical analysis of regionalization models is not enough to estimate streamflows in the hydrography (LI et al., 2009), and the use of a physical indicator in regions where an equation extrapolation was used enables a safer management of water resources in these areas (PRUSKI et al., 2012). Considering the necessity of information about water availability in areas of equation extrapolation use, the main objective of the present paper is to propose a new method that minimizes the risks of extrapolating regionalization equations for long-term average flows.
MATERIAL AND METHODS
Characterization of the study area
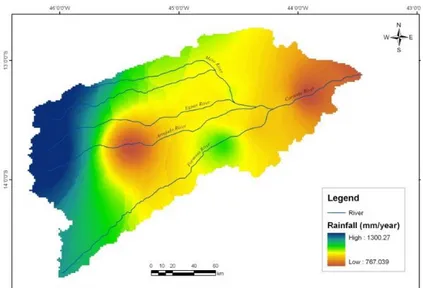
This study was performed for one sub-basin of the São Francisco basin: the Corrente River sub-basin. A previous study by RODRIGUEZ (2008) identified 15 homogeneous regions in the São Francisco basin, and the Corrente sub-basin was region 11. The Corrente sub-basin, with a drainage area of 34,253 km², is responsible for approximately 5.4% of the total area of the São Francisco River basin and is located in Western Bahia State, which is a strategic geographical position because it connects South Central and Northeastern Brazil. The climate ranges from wet in the far western region to semi-arid near the Corrente River´s mouth. The climate conditions are propitious to the development of irrigated agriculture, making this region one of the most important agricultural areas in the country.
Data used
This study uses seven stream gauge stations located in the Corrente basin. The gauge stations are part of the hydrometeorological network of the Hydrological Information System (Hidroweb) of the Brazilian National Water Agency (ANA). The stations used all had at least 20 years of data.
Streamflow regionalization
Parametric regression (mainly multiple linear regressions) is one of the most widely used regionalization methods. The relation most frequently uses statistics associated with streamflow and the characteristics of the basin (B, C, D, ..., M) as a potential function (LI et al., 2010; SAMUEL et al., 2011). The multiple regression model is expressed as:
m d
c
M D
C a
Q Bb ... (1)
where,
Q - streamflow of interest, m3 s-1;
a, b, c,…, m – constants, dimensionless.
The independent variables considered represent the physical and climatic characteristics of the basin (OLIVEIRA et al., 2013). The physical characteristic of the basin was the drainage area. The variation of rainfall in the basin directly affects the behavior of specific flow discharge. Therefore, the inclusion of rainfall as an explanatory variable of streamflow may be a significant improvement in the regionalization model (DINPASHOH et al., 2004). The climate variable used in regionalization is the average annual rainfall. This study used a single variable, instead of the drainage area and precipitation, defined by PRUSKI et al. (2013) as
31,536 A P
Peq (2)
where,
Peq - streamflow equivalent to the annual rainfall volume, m3 s-1;
P - annual average rainfall in the drainage area considered, mm year-1, and
A - drainage area, km2.
The use of a single variable allows not only a two-dimensional representation of the relationship between the dependent and independent variables but also a gain of one degree of freedom in statistical analysis. Thus, the independent variables used were the drainage area and the streamflow equivalent to the annual rainfall volume.
The spatial distribution of the regionalized hydrological variables was performed in the hydrographic base developed by the National Water Agency (ANA) for Brazil at a scale of 1:1,000,000.
The explanatory variable associated with rainfall was obtained from historical rainfall series, and the map of the average annual rainfall is shown in Figure 1.
FIGURE 1. Annual average rainfall spatial distribution in the Corrente basin.
The selection of equation that led to the best statistical adjustment was made using the absolute error estimated by the square root of the mean square error, the coefficient of determination and relative error.
Proposal to minimize the use of extrapolation of the regionalization equations
The runoff coefficient, which is the ratio of long-term average flow and the Peq, ranges from
than one, which is physically unlikely. Thus, analysis of the runoff coefficient on the hydrography may impose a real physical limit to the extrapolation of the long-term average flow equation.
After the selection of a regionalization model, possible deviations caused by the extrapolation of the regionalization equation are minimized by the use of a threshold value for the runoff coefficient. The threshold value is defined as the highest value obtained from several stream gauge stations in the hydrologically homogenous region considered. Thus, if the runoff coefficient estimated in the section of hydrography is higher than the threshold value, the long-term average flow must be estimated as
eq thr lt_adj C P
Q (3)
where,
Qlt,adj - stands for the long-term average flow adjusted according to the threshold runoff
coefficient, m3 s-1, and
Cthr -runoff coefficient used as a threshold for extrapolation of the regionalization equation,
equal to the highest C value observed among gauged stations, dimensionless.
RESULTS AND DISCUSSION
Table 1 shows drainage areas, long-term average streamflows, specific long-term average flow discharges and runoff coefficients for the seven gauge stations considered in this study.
TABLE 1. Station name, river name, drainage area, term average streamflow, specific long-term average flow discharge and runoff coefficient for the gauge stations in the Corrente basin.
Code Station name Latitude Longitude Drainage area Qlt qlt C
(km2) (m3 s-1) (L s-1 km-2)
45590000 Correntina -13.341 -44.638 3.648 33.213 9.1 0.280
45740001 Mocambo -13.278 -44.563 7.950 42.318 5.3 0.163
45770000 Arrojado -13.453 -44.569 5.465 59.204 10.8 0.334
45840000 Gatos -13.712 -44.638 7.710 82.969 10.8 0.336
45880000 Colônia do Formoso -13.712 -44.638 8.780 84.995 9.7 0.302
45910001 Sta Maria da Vit. -13.399 -44.197 28.200 215.392 7.6 0.237
45960001 Porto Novo -13.291 -43.909 29.700 219.273 7.4 0.231
The smallest drainage area among the seven gauge stations is 3,648 km2; the specific
long-term average flow discharges range from 5.3 to 10.8 L s-1 km-2, and the runoff coefficients range
from 0.163 to 0.336.
Equations 4 and 5 are the regionalization equations using area and Peq as explanatory
variables, respectively. Table 2 presents the values of the coefficient of determination (r²), root mean squared error (RMSE) and amplitude of relative error.
880 . 0 A 0254 . 0 lt Q (4) 883 . 0 eq P 5126 . 0 lt Q (5)
TABLE 2. Coefficient of determination, RMSE, amplitude of the relative error of regional regression equations considering area and Peq as independent variables.
r² RMSE relative error
Area 0.898 12.97 -19.1 to 62.9%
The explanatory variable that led to the best statistical adjustment was the drainage area, with a RMSE of 12.97, coefficient of determination of 0.893 and range of relative error of -19.1 to 62.9%. Therefore, the equation selected to estimate the long-term average flow was equation 4.
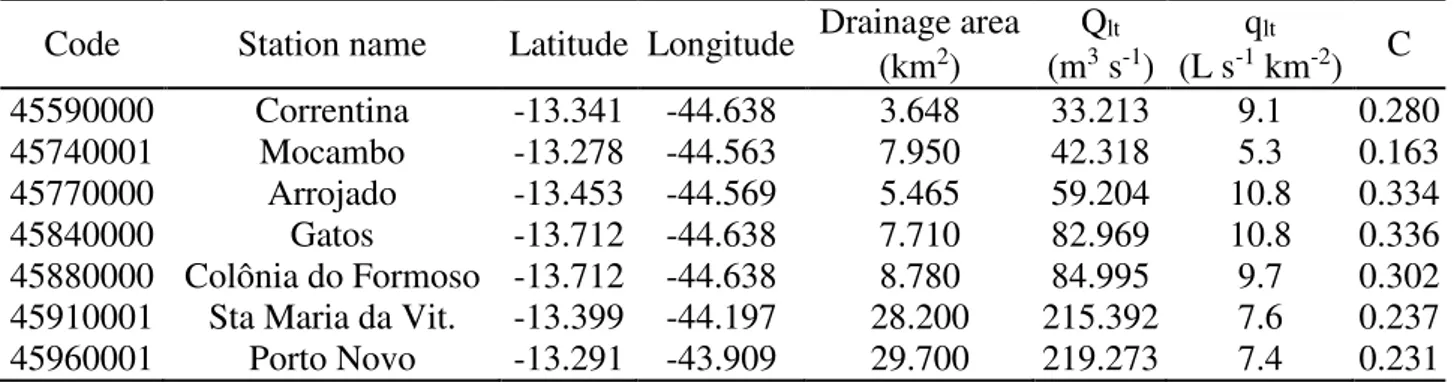
Figure 2 graphs the variation in long-term average flow and runoff coefficient according to the drainage area for one tributary of the Corrente River, the Guará River.
(a)
(b)
FIGURE 2. Runoff coefficient estimated by regionalization (C) and the threshold value (Cthr) (a) and long-term average streamflow obtained by regionalization equation 4 (estimated Qlt) and imposing the threshold value defined by equation 6 (Qlt_adj) (b) for the Guará River.
Figure 2 shows that both the runoff coefficient and the specific long-term average flow discharge, which corresponds to the slope of the curve of the long-term average streamflow (equation 6), decrease as the drainage area increases.
0.120 -mld
lt 0.0223A
dA ) Q ( d
q (6)
The rate of decrease of C and qlt is much more pronounced for small drainage areas and
value observed at the streamflow gauge stations is 0.336 (Table 1). Therefore, the estimation of C using the regionalization equation results in an estimated C value higher than twice the highest observed value at the gauge stations. This fact showed the risk associated with the use of flow regionalization equations beyond the limits of the data used to estimate the parameters of the regression model, i.e., the extrapolation of the regionalization equations.
Analysis of the behavior of qlt, as a function of drainage area, revealed a behavior similar to
that of C. Thus, for a drainage area of 1 km2, there is a q
lt equal to 22.3 Ls-1 km-2, which is a value
higher than twice the highest qlt estimated at the gauge stations and is equal to 10.8 Ls-1 km-2. Even
for a drainage area of 100 km2, the q
lt value is 12.9 Ls-1 km-2, which exceeds the highest qlt value
estimated at the gauge stations.
Therefore, for small drainage areas, some C and qlt values exceed more than twice the values
observed at the seven gauge stations considered in this study on the regionalization of streamflows in the Corrente basin. Similar results were found for low flows in RODRIGUEZ (2008), PRUSKI et al. (2012) and PRUSKI et al. (2015). Although the qlt and C values tend to increase toward the
headwaters, there is no guarantee that this trend of growth is as pronounced as that represented in the graphs of C versus drainage area (Figure 2) and in the qlt variation rate expressed by equation 6.
The fact that streamflows estimated by regionalization equations tend to be overestimated near the headwaters is not a major issue for maximum flow because the increased flow increases the safety of the project. However, for low flows and long-term average flows, an overestimation is problematic because it creates a false expectation of water availability, as showed in PRUSKI et al. (2013). Moreover, if the regulatory agencies allow withdrawals based on an extrapolation of the regularization equation, it can cause environmental problems, such as the intermittence of the river channel in dry seasons.
To reduce the risk of overestimating the long-term average flow at these hydrographic positions, i.e., in areas where the C value exceeds the Cthr value (which is the highest C value
observed among gauged stations, equal to 0.336), the long-term average flow was adjusted by a value equal to Cthr (red curves in Figure 2, C versus drainage area). The Qlt value must be adjusted
as:
Qlt_adj = 0.336 Peq (7)
The use of the restriction to a maximum value of C imposes a physical restriction for the long-term average flow, which reduces the risk of overestimating flows rates in this part of the hydrography. Therefore, streamflows were represented by red lines in the graphs of streamflow versus drainage area (Figure 2) until the areas where the red line intercepts the black line. After the intersection point, streamflows were represented by black lines.
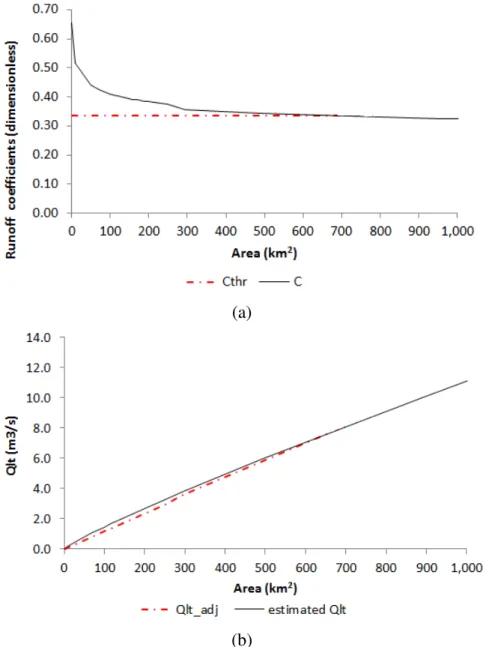
Considering various segments of the Corrente basin hydrography at the 1:1,000,000 scale, it’s observed (Figures 3a and 3b) that the C values range from 0.230 to 0.844, and the qlt value ranges
from 7.28 L s-1 km-2 to 23.90 L s-1 km-2. A significant part of the hydrography showed C values
above 0.336, which is the threshold value for the imposition of restrictions. The range of variation of the values was even more pronounced for larger scales.
Figure 3c shows segments of the hydrography of the Corrente basin, also at a 1:1,000,000 scale, where long-term average flow must be adjusted based on the Cthr value. Adjustments were
necessary for most of the basin. In this basin, 73% (25,182 km2) of the total area is submitted to the
threshold Cthr. This fact demonstrates the relevance of the procedure, not only because of the
proportion of the area affected but also because of the relevance of variations that may be higher than 100%.
the Pará river basin for low flows (a sub-basin of São Francisco basin as well), also observed that it was necessary to adjust approximately 85% of the total basin area based in a threshold value proposed by the authors.
(a)
(b)
(c)
FIGURE 3. Runoff coefficient (a), specific long-term average flow discharge (L s-1 km-2) (b), and segments of the Corrente basin (outlined in red) where it was necessary to adjust the long-term average flow rate based on the runoff coefficient used as the threshold for the extrapolation of the regionalization equation (c).
resources a very difficult task because most of the hydrography is associated with smaller drainage areas than the smallest drainage area among the gauge stations. On the other hand, the use of overestimated values for water availability will obviously create false expectations concerning the amount of water available. Therefore, the reliable estimation of water availability is essential for proper water resource planning and management.
CONCLUSIONS
The use of equation regression is not recommended for regions beyond the limits of a gauge station, and this restriction makes a difficult task for policymakers because most of the hydrography is located in extrapolation regions.
It was found that the values of runoff coefficients estimated by the regionalization equation were greater than twice the highest observed values at the gauge stations. Thus, this overestimation creates a false expectation of water availability, and the use of the regionalization equation in the extrapolation area may cause several problems for users and managers of water resources.
As the information about water availability is necessary in every segment of a river, the use of a threshold value allowed estimation of the information for regions of extrapolation because this value has imposed a physical limit to long-term average streamflow regionalization. Therefore, the proposed method allows a reliable estimation for long-term average flows in regions where the use of a regionalization equation is not recommended without compromising the security of the available water supply.
ACKNOWLEDGMENTS
We acknowledge the National Council for Technological Development (CNPq) and the Research Support Foundation of Minas Gerais State (FAPEMIG) for their financial support.
REFERENCES
ARAI, F.K.; PEREIRA, S.B.; GONÇALVES, G.G.G. Characterization of water availability in a hydrographic basin. Engenharia Agrícola, Jaboticabal, v. 32, n.3, p. 591-601, 2012.
BARRIOS, M.; FRANCÉS, F. Spatial scale effect on the upper soil effective parameters of a distributed hydrological model. Hydrological Processes, Chichesta, v. 26, n.7, p. 1022-1033, 2012.
DINPASHOH, Y.; FAKHERI-FARD, A.; MOGHADDAM, M.; JAHANBAKHSH, S.; MIRNIA, M. Selection of variables for the purpose of regionalization of Iran’s precipitation climate using multivariate methods. Journal of Hydrology, Amsterdam, v.297, p. 109-123, 2004.
FIOREZE, A. P.; OLIVEIRA, L. F. C. Usos dos recursos hídricos da Bacia Hidrográfica do Ribeirão Santa Bárbara, Goiás, Brasil. Pesquisa Agropecuária Tropical, Goiânia, v. 40, n. 1,
p. 28-35, 2010.
LI, Z. ; LIU, W. ; ZHANG, X. ; ZHENG, F. Impacts of land use change and climate variability on hydrology in an agricultural catchment on the Loess Plateau of China. Journal of Hydrology,
Amsterdam, v.377, p. 35- 42, 2009.
LI, M.; SHAO, Q.; ZHANG, L.; CHIEW, F.H.S. A new regionalization approach and its
application to predict flow duration curve in ungauged basins. Journal of Hydrology, Amsterdam, v. 389, p. 137-145, 2010.
MALEKINEZHAD, H.; NACHTNEBEL, H. P.; Klik, A. Comparing the index-flood and
multiple-regression methods using L-moments. Physics and Chemistry of the Earth, Oxford, v. 36, p.
54-60, 2011.
MAMUN, A. A.; HASHIM, A.; DAOUD, J. I. Regionalisation of low flow frequency curves for
MASIH, I.; UHLENBROOK, S.; MASKEY, S.; AHMAD, M.D. Regionalization of a conceptual rainfall–runoff model based on similarity of the flow duration curve: A case study from the semi-arid Karkheh basin, Iran. Journal of Hydrology, Amsterdam, v.391, p. 188-201, 2010.
NAGHETTINI, M.; PINTO, E.J.A. Hidrologia estatística. Belo Horizonte: CPRM, 2007. 552p.
OLIVEIRA, J.R.; PRUSKI, F.F.; NUNES, A.A. Otimização do aproveitamento da disponibilidade de águas superficiais na bacia do ribeirão Entre Ribeiros. Revista Brasileira de Recursos
Hídricos, Porto Alegre, v. 18, n. 4, p. 157-172, 2013.
PRUSKI, F.F.; PRUSKI, P.L. Tecnologia e inovação frente a gestão de recurso hídrico. In:
MEDEIROS, S.S.; GHEYI, H.R.; GALVÃO, C. O. de; PAZ, V.P. da. (Ed.). Recursos hídricos: em
regiões áridas e semiáridas. Campina Grande: Instituto Nacional do Semiárido, 2011. cap. 2, p. 27-58.
PRUSKI, F.F.; RODRIGUEZ, R. del G.; SOUZA, J.F.; NUNES, A.A.; PRUSKI, P.L.; SINGH, V.P. Low-flow estimates in regions of extrapolation of the regionalization equations: a new concept. Engenharia Agrícola, Jaboticabal, v. 35, n.5, p. 808-816, 2015.
PRUSKI, F.F.; NUNES, A.A.; PRUSKI, P.L.; RODRIGUEZ, R.G. Improved regionalization of streamflow by use of the streamflow equivalent of precipitation as an explanatory variable. Journal of Hydrology, Amsterdam, v. 476, p. 52-71, 2013.
PRUSKI, F.F.; NUNES, A.A.; REGO, F.S.; SOUZA, M.F. Extrapolação de equações de
regionalização de vazões mínimas: Alternativas para atenuar os riscos. Water Resources and
Irrigation Management, Cruz das Almas, v. 1, p. 51-59, 2012.
RODRIGUEZ, R. del G. Proposta conceitual para a regionalização de vazões. 2008. 254p. Tese
(Doutorado) - Universidade Federal de Viçosa, Viçosa, 2008.
SAMUEL, J.; COULIBALY, P.; METCALFE, R. A. Estimation of continuous streamflow in
Ontario ungauged basins: comparison of regionalization methods. Journal of Hydrologic
Engineering, New York, v.16, n.5, p. 447-459, 2011.
SILVA JÚNIOR, O.B.; BUENO, E.O.; TUCCI, C.E.M.; CASTRO, N.M.R. Extrapolação espacial na regionalização da vazão. Revista Brasileira de Recursos Hídricos, Porto Alegre, v. 8, n. 1,