Consumption of animal-based and processed food
associated with cardiovascular risk factors and
subclinical atherosclerosis biomarkers in men
Júlio César Acosta-Navarro1,3 Adriana Midori Oki1,3 Luiza Antoniazzi1,2 Maria Aparecida Carlos Bonfim1 Valeria Hong1 Maria Cristina de Almeida Gaspar2 Valeria Cristina Sandrim4 Adriana Nogueira1
1. Heart Institute (InCor) of the Hospital das Clínicas of the Faculty of Medicine, USP, São Paulo(SP), Brasil
2. Paulista University (Unip), São Paulo (SP), Brasil
3. Center of Medical Specialties (CEM), Ferraz de Vasconcelos (SP), Brasil
4. Department of Pharmacology, Institute of Biosciences of Botucatu, São Paulo State University (Unesp), Botucatu (SP), Brasil
http://dx.doi.org/10.1590/1806-9282.65.1.43
SUMMARY
OBJECTIVE: To evaluate the frequency of food consumption in apparently healthy men and their association with cardiovascular risk factors and biomarkers of subclinical atherosclerosis.
METHODS: In this observational study, 88 men had their food standard obtained through the food frequency questionnaire (FFQ). Associations of dietary patterns with cardiovascular risk factors, such as anthropometric data, laboratory and clinical evaluations, carotid-femoral arterial stiffness (IMT) and pulse wave velocity were evaluated.
RESULTS: The highest values were observed, for most of the risk factors evaluated, with the highest frequency of weekly consumption of dairy products, meats, sweets, fats, cold meats, sodas, milk and white chocolate; and lower frequency of weekly consumption of fruits, cereals, vegetables, legumes, oilseeds, and soy. There was no significant difference for coffee and dark chocolate
CONCLUSIONS: A diet with high consumption of animal products has a higher correlation with cardiovascular risk factors; the opposite is true for the consumption of plant-based food, associated with the profile of more favorable biomarkers for cardiovascular health and better biochemical and structural parameters.
KEYWORDS: Atherosclerosis. Food Consumption. Pulse Wave Analysis. Vascular Stiffness.
DATE OF SUBMISSION: 01-Feb-2018
DATE OF ACCEPTANCE: 16-Feb-2018
CORRESPONDING AUTHOR: Julio Acosta-Navarro
Avenida Dr Enéas de Carvalho Aguiar, 44 Sao Paulo, SP, Brasil – 05403-000 E-mail: [email protected]
INTRODUCTION
Chronic non-communicable diseases (CNCD) are the leading cause of disability. Among them are in-cluded cardiovascular disease, responsible for 30% of deaths worldwide. Epidemiological data suggest that individuals who follow diets rich in fruits and vegetables have a lower risk of CNCD and mortality
than those who follow diets poor in vegetables1.
Sev-eral studies have shown a connection between the consumption of meat and hypertension, risk of heart
disease, metabolic disorders, and mortality2-9. The
fo-cus was on evidencing the problems caused by the deficiency of certain nutrients; now, it is evident a tendency to study the possible health benefits of a diet completely or partially plant-based, such as the ovo-lacto vegetarian diet10.
Recent studies show the link between diet and
nutritional state with the occurrence of CNCD10,11.
Despite vast clinical and epidemiological evidence that diet has a direct effect on the onset of chronic diseases, the mechanisms of action are not yet clear-ly understood, especialclear-ly regarding cardiovascular risk12,13. Furthermore, some studies have investigated the relationship between the consumption of certain
nutrients or food and the intima-media thickness14,15
and the pulse wave velocity16.
Due to the scientific interest in food consumption, healthy diet, cardiovascular health, and the scarcity of studies that carry out that analysis, the objective of this study was to assess the frequency of food con-sumption in men who were apparently healthy and its link with cardiovascular risk.
METHODS
Study population
In this cross-sectional observational study, 745 adult volunteers were recruited in the city of São Paulo, Brazil, through social activities and internet publicity, initially between October 2012 and June 2013. The participants filled out questionnaires on family and personal medical history, diet preferenc-es, physical activity, formal education, and personal data. The exclusion criteria were: 1) female; 2) under 35 years old; 3) history of diabetes; 4) history of dys-lipidemia; 5) history of cardiovascular or cerebrovas-cular diseases; 6) history of hypertension or of use of antihypertensive medication; and 7) smoking. All individuals that declared to be smokers or “occasion-al smokers,” or who had quit smoking one month before the interview were considered smokers. The sample consisted of men who were apparently healthy in order to prevent confounding risk factors for subclinical atherosclerosis.
Healthy participants who were ≥35 years old were allocated into two groups – VEG and OMNI –, accord-ing to their diets. VEG men were defined as havaccord-ing had a vegetarian diet free of meat, fish, and poultry for at least four years; these men could be ovo-lacto vegetarian (consumption of eggs, milk and dairy), lacto-vegetarians (consumption of milk and dairy), or
vegan (no consumption of eggs, milk, or dairy). OMNI men were defined as those who consume any type of meat, at least five portions or more per week. During the period from July 2013 to January 2014, after the inclusion and exclusion criteria were applied, 88 men, ≥35 years old, apparently healthy were included in the study (44 vegetarians and 44 omnivores). The original study design had the intention of studying the link between a vegetarian and omnivore diet on cardiovascular risk factors; however, in this study, our strategy was to consider both groups as a whole. The research committee of the Heart Institute (In-Cor) of the Hospital of the Faculty of Medicine of the University of São Paulo approved the protocol of the study, and all participants signed an Informed Con-sent Form to participate in the study.
Laboratory and clinical analysis, ultrasonogra-phy of the carotid, pulse wave velocity (PWV) The methodology of these variables is described
in the previous publication of the CARVOS Study17.
Anthropometric assessment
For the anthropometric assessment, we used the Body Mass Index (BMI) and the bioelectrical imped-ance analysis (BIA). To assess the level of physical activity we used the International Physical Activity Questionnaire-Short Form (Ipaq). The methodology
is described in the CARVOS18 study on body
compo-sition.
The assessment of the frequency of food con-sumption
The individuals were interviewed, and a food fre-quency questionnaire (FFQ) was applied to assess the pattern of consumption of food groups.
Each individual was asked: Over the last seven days, in how many days did you consume the fol-lowing food or beverages? The folfol-lowing alternatives
were possible:Did not eat over the last seven days; 1
day over the last seven days; 2 days over the last sev-en days; 3 days over the last sevsev-en days; 4 days over the last seven days; 5 days over the last seven days; 6 days over the last seven days; and all seven days.
(pineap-ple, banana, ap(pineap-ple, papaya, strawberry, grape, fruit salad, etc.); 5. Legumes (beans, peas, lentils, chick-peas, soy); 6. Oilseeds (nuts, almonds, pistachios, linseed, sunflower seeds); 7. Dairy products (milk, yogurt, and cheese); 8. Meat (poultry, beef, pork, game – such as rabbit and pheasant, etc.); 9. Fish and seafood (shrimp, crab, lobster, etc.); 10. Eggs (fried, boiled, poached, etc.). 11. Cold meats (sausage, sala-mi, hamburger, bologna, ham, turkey breast, etc.); 12. Soy-based food and drinks (soy-based drinks, textured vegetable protein, etc.); 13. Fats (fried food, such as potato or manioc, croquettes, hand pies); 14. Sweets (candy, gum, candied fruit, etc.); 15. Soda (not including diet or light ones); 16. Milk Chocolate; 17. Dark chocolate; 18. White chocolate; and 19. Coffee.
The instrument of food consumption frequency used was based on Sisvan, which according to the
Ministry of Health19 is similar to versions used in
re-search for monitoring practices that pose a risk to health, such as the North-American Youth Risk Be-havior Survey - YRBS, carried out by the Center for Disease Control and Prevention - CDC. Moreover, we considered the questionnaire used in Vigitel (Vigi-lance of Chronic Diseases through Phone Survey), conducted by the Department of Health Vigilance of the Ministry of Health in Brazil.
In this study, the frequency of food consumption was categorized in 0-3 times per week and 4-7 times per week; and the tables and images were divided in plant-based, animal-based, and processed/home-made food.
Statistical analysis
The variables analyzed in this study were: sys-tolic blood pressure (SBP), diassys-tolic blood pressure (DBP), thickness of the intima-media thickness (IMT), pulse wave velocity (PWV), Framingham risk score, percentage of lean body mass (%LBM), per-centage of body fat (%BF), perper-centage of total body water (%TBW), total cholesterol (TC), low-density lipoprotein (LDL), TC/HDL ratio, triglycerides (TG), glucose (GL), measurement of glycated hemoglobin (Glyc-Hb), apolipoprotein B (ApoB), C-reactive pro-tein (CRP).
The continuous variables are presented as Stan-dard Deviation (SD) ± Means. T-tests and chi-square tests were used to test differences in numeric and nominal variables.
All the calculations were made using the Stata software, version 10.0.
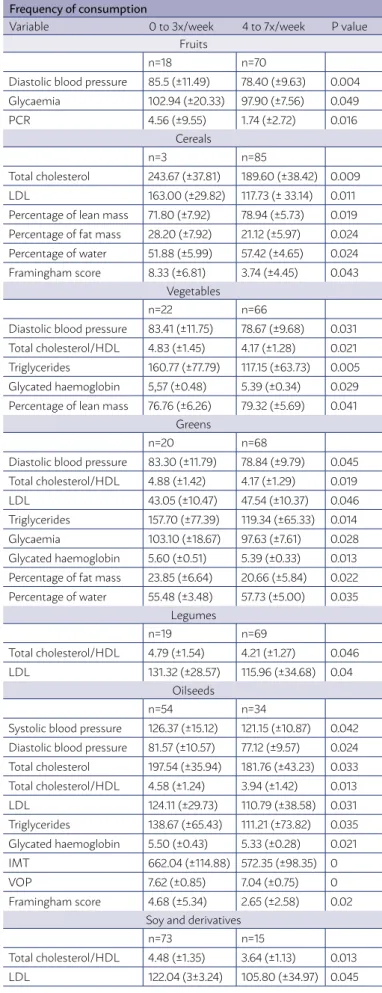
TABLE 1. Mean values of cardiovascular risk factors, according to the frequency of consumption of products of plant origin.
Frequency of consumption
Variable 0 to 3x/week 4 to 7x/week P value
Fruits
n=18 n=70
Diastolic blood pressure 85.5 (±11.49) 78.40 (±9.63) 0.004
Glycaemia 102.94 (±20.33) 97.90 (±7.56) 0.049
PCR 4.56 (±9.55) 1.74 (±2.72) 0.016
Cereals
n=3 n=85
Total cholesterol 243.67 (±37.81) 189.60 (±38.42) 0.009
LDL 163.00 (±29.82) 117.73 (± 33.14) 0.011
Percentage of lean mass 71.80 (±7.92) 78.94 (±5.73) 0.019
Percentage of fat mass 28.20 (±7.92) 21.12 (±5.97) 0.024
Percentage of water 51.88 (±5.99) 57.42 (±4.65) 0.024
Framingham score 8.33 (±6.81) 3.74 (±4.45) 0.043
Vegetables
n=22 n=66
Diastolic blood pressure 83.41 (±11.75) 78.67 (±9.68) 0.031
Total cholesterol/HDL 4.83 (±1.45) 4.17 (±1.28) 0.021
Triglycerides 160.77 (±77.79) 117.15 (±63.73) 0.005
Glycated haemoglobin 5,57 (±0.48) 5.39 (±0.34) 0.029
Percentage of lean mass 76.76 (±6.26) 79.32 (±5.69) 0.041
Greens
n=20 n=68
Diastolic blood pressure 83.30 (±11.79) 78.84 (±9.79) 0.045
Total cholesterol/HDL 4.88 (±1.42) 4.17 (±1.29) 0.019
LDL 43.05 (±10.47) 47.54 (±10.37) 0.046
Triglycerides 157.70 (±77.39) 119.34 (±65.33) 0.014
Glycaemia 103.10 (±18.67) 97.63 (±7.61) 0.028
Glycated haemoglobin 5.60 (±0.51) 5.39 (±0.33) 0.013
Percentage of fat mass 23.85 (±6.64) 20.66 (±5.84) 0.022
Percentage of water 55.48 (±3.48) 57.73 (±5.00) 0.035
Legumes
n=19 n=69
Total cholesterol/HDL 4.79 (±1.54) 4.21 (±1.27) 0.046
LDL 131.32 (±28.57) 115.96 (±34.68) 0.04
Oilseeds
n=54 n=34
Systolic blood pressure 126.37 (±15.12) 121.15 (±10.87) 0.042
Diastolic blood pressure 81.57 (±10.57) 77.12 (±9.57) 0.024
Total cholesterol 197.54 (±35.94) 181.76 (±43.23) 0.033
Total cholesterol/HDL 4.58 (±1.24) 3.94 (±1.42) 0.013
LDL 124.11 (±29.73) 110.79 (±38.58) 0.031
Triglycerides 138.67 (±65.43) 111.21 (±73.82) 0.035
Glycated haemoglobin 5.50 (±0.43) 5.33 (±0.28) 0.021
IMT 662.04 (±114.88) 572.35 (±98.35) 0
VOP 7.62 (±0.85) 7.04 (±0.75) 0
Framingham score 4.68 (±5.34) 2.65 (±2.58) 0.02
Soy and derivatives
n=73 n=15
Total cholesterol/HDL 4.48 (±1.35) 3.64 (±1.13) 0.013
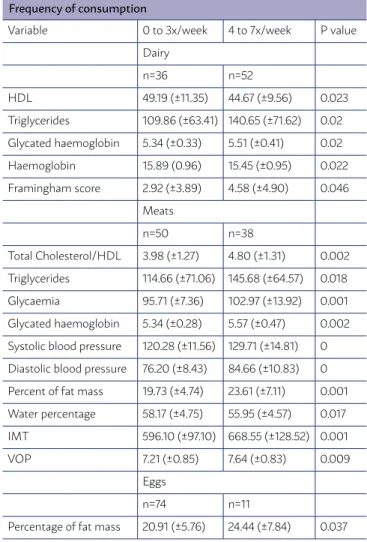
TABLE 2. Mean values of cardiovascular risk factors, according to frequency of consumption of products of animal origin.
Frequency of consumption
Variable 0 to 3x/week 4 to 7x/week P value
Dairy
n=36 n=52
HDL 49.19 (±11.35) 44.67 (±9.56) 0.023
Triglycerides 109.86 (±63.41) 140.65 (±71.62) 0.02
Glycated haemoglobin 5.34 (±0.33) 5.51 (±0.41) 0.02
Haemoglobin 15.89 (0.96) 15.45 (±0.95) 0.022
Framingham score 2.92 (±3.89) 4.58 (±4.90) 0.046
Meats
n=50 n=38
Total Cholesterol/HDL 3.98 (±1.27) 4.80 (±1.31) 0.002
Triglycerides 114.66 (±71.06) 145.68 (±64.57) 0.018
Glycaemia 95.71 (±7.36) 102.97 (±13.92) 0.001
Glycated haemoglobin 5.34 (±0.28) 5.57 (±0.47) 0.002
Systolic blood pressure 120.28 (±11.56) 129.71 (±14.81) 0
Diastolic blood pressure 76.20 (±8.43) 84.66 (±10.83) 0
Percent of fat mass 19.73 (±4.74) 23.61 (±7.11) 0.001
Water percentage 58.17 (±4.75) 55.95 (±4.57) 0.017
IMT 596.10 (±97.10) 668.55 (±128.52) 0.001
VOP 7.21 (±0.85) 7.64 (±0.83) 0.009
Eggs
n=74 n=11
Percentage of fat mass 20.91 (±5.76) 24.44 (±7.84) 0.037
RESULTS
In the present study, we analyzed 88 individuals, with a mean age of 46.1 (±8.68). According the body mass index, 54.5% (n=48) had adequate weight and 29.5% (n=26) presented risk of obesity. Regarding the level of formal education, 47.7% (n=42) had higher ed-ucation, and 33% secondary education. Most individ-uals, 69.3% (n=61) had a high level of physical activity.
In Table 1, which shows the variables with plant-based food, we can see that those who eat fruits 4-7 times a week have lower glucose, CRP, and DBP val-ues. For grains, those who consume it more times per week have lower values for LDL, TC, and Fram-ingham risk score. Individuals who eat vegetables more times per week have lower TG, glyc-Hb, TC/ HDL, DBP. Those who eat leafy greens more times per week have lower values for DBP, TC/HDL, TG, GL, glyc-Hb, and higher HDL for legumes, those who consume them more times per week have lower TC/ HDL and LDL. As for oilseeds, those who consume them more times per week have lower SBP, DBP, TC,
TC/HDL, LDL, TG, Glyc-Hb, IMT, PWV, and Framing-ham score. For soy, lower TC/HDL and LDL.
The group of individuals that indicated the highest frequency of consumption of dairy products present-ed lower values for HDL, and HB; and higher values for TG, Glyc-Hb, and Framingham score. In the cate-gory of greater frequency of consumption of meats, we found higher values for TC/HDL, TG, GL, Glyc-Hb, SBP, DBP, PWV, and IMT. It was not possible to carry out the analysis of fish consumption for only two men in the sample indicated a regular consump-tion of the item from 4-7 times per week (Table 2).
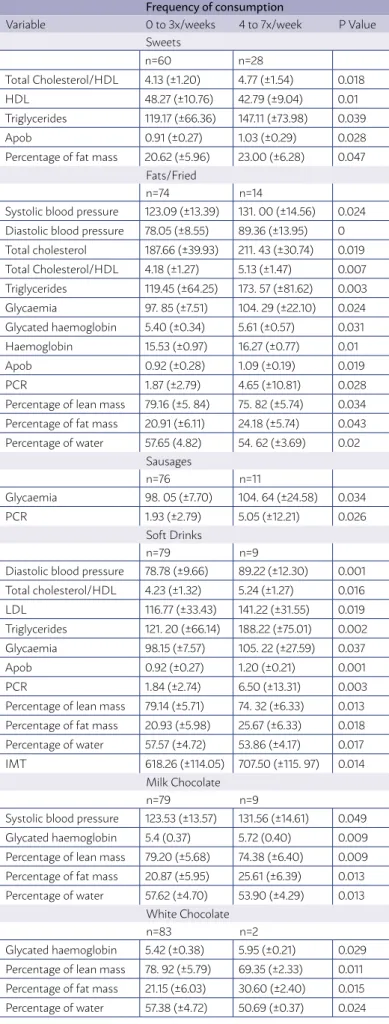
For the consumption of sweets, higher TC/HDL, TG, ApoB; and lower HDL. For fat, higher DBP, SBP, TC, TC/HDL, TG, GL, Glyc-Hb, HB, Apo B, CRP. For cold meats, higher GL and CRP. For sodas, higher DBP, TC/HDL, LDL, TG, GL, Apo B, CRP, IMT. For milk chocolate, higher SBP and Glyc-Hb. For white chocolate, higher Glyc-Hb.
The pattern observed in most risk factors assessed was of higher values for higher weekly consumption of sweets, fats/fried foods, cold meats, sodas, white and milk chocolate. There was no significant differ-ence for coffee and dark chocolate (Table 3).
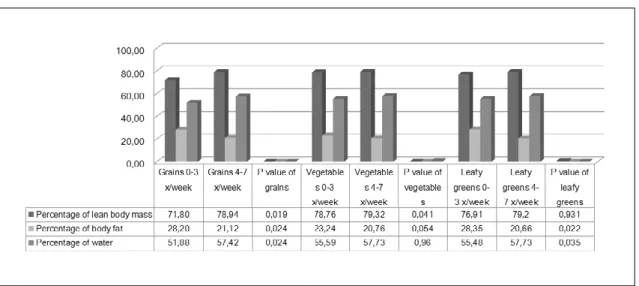
Regarding body composition, we found that those who consume more grains more times per week have lower %BF and higher %LBM and water; those who eat vegetables more often have higher %LBM; and those who consume more leafy greens have lower %BF and higher %water (Figure 1). As for ani-mal-based products, for a more often consumption of meat we found a higher %BF and lower water; for eggs, higher %BF (Figure 2). The group of individuals the indicated a higher frequency for the consumption of sweets presented higher %BF; for fats/fried food, sodas, milk, and white chocolate, we found higher %BF, and lower %LBM and water (Figure 3).
DISCUSSION/CONCLUSION
There are many clinical and epidemiological stud-ies on the influence of diet energy and nutrients over the health state and incidence of diseases. However, individuals do not consume nutrients in isolation but combined in the food that makes up their diet
pat-terns19. In the combination of macro and
consumption of food groups over cardiovascular risk factors can be considered promising.
This way, some studies have verified an associ-ation between diet patterns and chronic diseases,
such as obesity20, endothelial function, and
inflam-mation21, and some types of cancer, amongst them
oral22, gastric23, and cerebral24.
In the present study, we found significant differ-ences in the cardiovascular risk factors assessed ac-cording to the frequency of consumption of specific food items, with the exception of fish, coffee, and dark chocolate. Some studies have investigated food consumption and cardiovascular risk factors. Kerver
et al.25 found that the food pattern named “Western,”
characterized by the high consumption of processed meats, eggs, red meat, and dairy products with high fat levels, is positively associated with serum levels of insulin, C-peptide, and glycated hemoglobin. As for the pattern know as “Healthy American” (high amounts of leafy green vegetables, salad dressing, tomatoes, and other vegetables, and tea), there was no correlation found with the biomarkers analyzed.
In the study by Centritto et al.26, three patterns of
diet were categorized. The “Olive Oil and Vegetables” pattern, characterized by the high intake of olive oil, vegetables, soup, fruit, and fish, was associated with relatively low values of glucose, fats, CRP, arterial pressure, and individual cardiovascular risk scores. The “Meats and Pasta” pattern, characterized by a high intake of pasta, tomato sauce, red meat, animal fat, and alcohol, was positively associated with blood glucose, fats, CRP, and cardiovascular risk scores. The “Eggs and Sweets” pattern, characterized by positive loads of eggs, processed meats, margarine, butter, sugar, and sweets, was associated with high CRP values.
There was also a study conducted with the Bra-zilian population. Olinto et al.27 classified the food consumption into two patterns: the first one, the Av-erage Brazilian, characterized by sugar, white bread, coffee, margarine/butter, rice, and black beans. The second, the Processed Food, was characterized by red and processed meats, salty snacks, french fries, beer, soda, and other processed food. The Average Brazilian was inversely associated with values of LDL, HDL, and total cholesterol in men. Amongst women, they found tendencies of an inverse associa-tion with SBP, DBP, LDL, HDL, and TC. The patter of Processed Food was positively associated with values of LDL, HDL, and TC amongst men. Amongst wom-TABLE 3. Mean values of cardiovascular risk factors, according to
frequency of consumption of sweets, fats and ultraprocessed foods.
Frequency of consumption
Variable 0 to 3x/weeks 4 to 7x/week P Value
Sweets
n=60 n=28
Total Cholesterol/HDL 4.13 (±1.20) 4.77 (±1.54) 0.018
HDL 48.27 (±10.76) 42.79 (±9.04) 0.01
Triglycerides 119.17 (±66.36) 147.11 (±73.98) 0.039
Apob 0.91 (±0.27) 1.03 (±0.29) 0.028
Percentage of fat mass 20.62 (±5.96) 23.00 (±6.28) 0.047
Fats/Fried
n=74 n=14
Systolic blood pressure 123.09 (±13.39) 131. 00 (±14.56) 0.024
Diastolic blood pressure 78.05 (±8.55) 89.36 (±13.95) 0
Total cholesterol 187.66 (±39.93) 211. 43 (±30.74) 0.019
Total Cholesterol/HDL 4.18 (±1.27) 5.13 (±1.47) 0.007
Triglycerides 119.45 (±64.25) 173. 57 (±81.62) 0.003
Glycaemia 97. 85 (±7.51) 104. 29 (±22.10) 0.024
Glycated haemoglobin 5.40 (±0.34) 5.61 (±0.57) 0.031
Haemoglobin 15.53 (±0.97) 16.27 (±0.77) 0.01
Apob 0.92 (±0.28) 1.09 (±0.19) 0.019
PCR 1.87 (±2.79) 4.65 (±10.81) 0.028
Percentage of lean mass 79.16 (±5. 84) 75. 82 (±5.74) 0.034
Percentage of fat mass 20.91 (±6.11) 24.18 (±5.74) 0.043
Percentage of water 57.65 (4.82) 54. 62 (±3.69) 0.02
Sausages
n=76 n=11
Glycaemia 98. 05 (±7.70) 104. 64 (±24.58) 0.034
PCR 1.93 (±2.79) 5.05 (±12.21) 0.026
Soft Drinks
n=79 n=9
Diastolic blood pressure 78.78 (±9.66) 89.22 (±12.30) 0.001
Total cholesterol/HDL 4.23 (±1.32) 5.24 (±1.27) 0.016
LDL 116.77 (±33.43) 141.22 (±31.55) 0.019
Triglycerides 121. 20 (±66.14) 188.22 (±75.01) 0.002
Glycaemia 98.15 (±7.57) 105. 22 (±27.59) 0.037
Apob 0.92 (±0.27) 1.20 (±0.21) 0.001
PCR 1.84 (±2.74) 6.50 (±13.31) 0.003
Percentage of lean mass 79.14 (±5.71) 74. 32 (±6.33) 0.013
Percentage of fat mass 20.93 (±5.98) 25.67 (±6.33) 0.018
Percentage of water 57.57 (±4.72) 53.86 (±4.17) 0.017
IMT 618.26 (±114.05) 707.50 (±115. 97) 0.014
Milk Chocolate
n=79 n=9
Systolic blood pressure 123.53 (±13.57) 131.56 (±14.61) 0.049
Glycated haemoglobin 5.4 (0.37) 5.72 (0.40) 0.009
Percentage of lean mass 79.20 (±5.68) 74.38 (±6.40) 0.009
Percentage of fat mass 20.87 (±5.95) 25.61 (±6.39) 0.013
Percentage of water 57.62 (±4.70) 53.90 (±4.29) 0.013
White Chocolate
n=83 n=2
Glycated haemoglobin 5.42 (±0.38) 5.95 (±0.21) 0.029
Percentage of lean mass 78. 92 (±5.79) 69.35 (±2.33) 0.011
Percentage of fat mass 21.15 (±6.03) 30.60 (±2.40) 0.015
FIGURE 1. MEAN VALUES OF BODY COMPOSITION ACCORDING TO THE FREQUENCY OF CONSUMPTION OF PLANT-BASED FOOD.
FIGURE 2. MEAN VALUES OF BODY COMPOSITION, ACCORDING TO FREQUENCY OF CONSUMPTION OF PRODUCTS OF ANIMAL ORIGIN.
REFERENCES
1. Silva LB, Silva SS, Marcílio AG, Pierin AM. Prevalence of arterial hyper-tension among Seventh-Day Adventists of the São Paulo state capital and inner area. Arq Bras Cardiol. 2012;98(4):329-37.
2. Acosta-Navarro JC, Prado SMC, Sanchez DE, Ayala CC, Cabezas JT, Mejia ZP, et al. Pressão sanguínea, perfil lipídico e outros parâmetros bioquími-cos entre peruanos vegetarianos, semi-vegetarianos e omnívoros. O estu-do Lima. An Paul Med Cir. 1998;125(3):87-101.
3. Acosta-Navarro JC, Prado SC, Guimarães G, Martins M, Caramelli B. Veg-etarians and semi-vegVeg-etarians are less exposed to cardiovascular risk fac-tors. Int J Atheroscler. 2006;1(1):48-54.
4. Navarro JA, Caramelli B. Vegetarians from Latin America. Am J Cardiol. 2010;105(6):902.
5. Craig WJ. Nutrition concerns and health effects of vegetarian diets. Nutr Clin Pract. 2010;25(6):613-20.
6. Sticher MA, Smith CB, Davidson S. Reducing heart disease through the vegetarian diet using primary prevention. J Am Acad Nurse Pract. 2010;22(3):134-9.
en, the Processed Food pattern was not significantly associated with cardiovascular risk factors.
In the clinical practice, the assessment of food consumption has the purpose of helping with the de-velopment and implementation of nutritional
plan-ning28. There are several methods for assessing food
intake and nutrient consumption, and it is important to choose the one that aims at promoting health, pre-venting injuries, and adjusting the nutritional state of the patient. In this sense, the method of food con-sumption or food groups is the food frequency
ques-tionnaire (FFQ)28.
The FFQ is considered to be the most practical and informative method for assessment in studies that investigate the connection between diet and
clin-ical outcomes, usually associated with CNCD28.
The fact that this is a cross-sectional study com-promises its causality proof. In addition, there is a
re-RESUMO
OBJETIVO: Avaliar a frequência do consumo alimentar de indivíduos homens aparentemente saudáveis e a associação desta com fa-tores de risco cardiovascular e biomarcadores de aterosclerose subclínica.
MÉTODOS: Neste estudo observacional, 88 homens tiveram o padrão alimentar obtido por meio do questionário de frequência alimen-tar (QFA). Foram avaliadas as associações dos padrões alimenalimen-tares com os fatores de risco cardiovascular, como dados antropométri-cos, avaliações laboratoriais e clínica, rigidez arterial determinada pela carótida-femoral (IMT) e velocidade da onda de pulso (VOP).
RESULTADOS: O padrão observado para a maioria dos fatores de risco avaliados foi de valores mais altos, segundo maior frequência de consumo semanal de lácteos, carnes, doces, gorduras/frituras, embutidos, refrigerantes, chocolates ao leite e branco; e de menor fre-quência de consumo semanal de frutas, cereais, legumes, verduras, leguminosas, oleaginosas e soja. Não houve diferença significativa para café e chocolate amargo.
CONCLUSÕES: Uma dieta com alto consumo de produtos animais apresenta maior correlação com fatores de risco cardiovascular, sendo o oposto para o consumo de alimentos de origem vegetal, associado ao perfil de biomarcadores de saúde cardiovascular mais favorável e melhores parâmetros bioquímicos e estruturais.
PALAVRAS-CHAVE: Aterosclerose. Consumo de alimentos. Análise de onda de pulso. Rigidez vascular.
stricted number of individuals. However, the sample is highly homogenized in sex and age, and reproduc-ible methods were used.
The present study was conducted with a sample of apparently healthy men who make up a large por-tion of the populapor-tion and which is of great interest in terms of prevention of chronic diseases since these are associated with inadequate food consumption pa-rameters.
CONCLUSION
In the present study, higher consumption of plant-based food was less associated with cardiovascular risk factors; the contrary was found for animal-based food, sweets, fats, and ultra-processed food, with a higher association to cardiovascular risk factors, the higher the weekly frequency of their consumption.
7. Huang T, Yang B, Zheng J, Li G, Wahlqvist ML, Li D. Cardiovascular disease mortality and cancer incidence in vegetarians: a meta-analysis and sys-tematic review. Ann Nutr Metab. 2012;60(4):233-40.
8. Pettersen BJ, Anousheh R, Fan J, Jaceldo-Siegl K, Fraser GE. Vegetarian di-ets and blood pressure among white subjects: results from the Adventist Health Study-2 (AHS-2). Public Health Nutr. 2012;15(10):1909-16. 9. Navarro JC, Prado SM, Cárdenas PA, Santos RD, Caramelli B. Pre-historic
eat-ing patterns in Latin America and protective effects of plant-based diets on cardiovascular risk factors. Clinics (Sao Paulo). 2010;65(10):1049-54. 10. Brasil. Ministério da Saúde. Departamento de Atenção Básica. Guia
alimen-tar para a população brasileira. 2a ed. Brasília: Ministério da Saúde; 2014.
11. Casado L, Vianna LM, Thuler LCS. Fatores de risco para doenças crônicas não transmissíveis no Brasil: uma revisão sistemática. Rev Bras Cancerol. 2009;55(4):379-88.
13. Teixeira RCMA, Molina MCB, Zandonade E, Mill JG. Cardiovascular risk in vegetarians and omnivores: a comparative study. Arq Bras Cardiol. 2007;89(4):237-44.
14. Sala-Vila A, Romero-Mamani ES, Gilabert R, Núñez I, de la Torre R, Corella D, et al. Changes in ultrasound-assessed carotid intima-media thickness and plaque with a Mediterranean diet: a substudy of the PREDIMED trial. Arterioscler Thromb Vasc Biol. 2012;34(2):439-45.
15. Cai Y, Guo K, Chen C, Wang P, Zhang B, Zhou Q, et al. Soya isoflavone con-sumption in relation to carotid intima-media thickness in Chinese equol excretors aged 40–65 years. Br J Nutr. 2012;108(9):1698-704.
16. Chan HT, Chan YH, Yiu KH, Li SW, Tam S, Lau CP, et al. Worsened arterial stiffness in high-risk cardiovascular patients with high habitual carbohy-drate intake: a cross-sectional vascular function study. BMC Cardiovasc Disord. 2014;14:24.
17. Acosta-Navarro J, Antoniazzi L, Oki AM, Bonfim MC, Hong V, Acos-ta-Cardenas P, et al. Reduced subclinical carotid vascular disease and arterial stiffness in vegetarian men: The CARVOS Study. Int J Cardiol. 2017;230:562-6.
18. Acosta-Navarro JC, Oki AM, Gouveia LAG, Hong V, Bonfim MC, Acos-ta-Cardenas P, et al. Healthier body composition in vegetarian men com-pared to omnivorous men. J Nutr Food Sci. 2016;6:529.
19. Brasil. Ministério da Saúde. Secretaria de Atenção à Saúde. Departamento de Atenção Básica. Protocolos do Sistema de Vigilância Alimentar e Nutri-cional – SISVAN na assistência à saúde. Brasília: Ministério da Saúde; 2008. 20. Sichieri R. Dietary patterns and their associations with obesity in the
Bra-zilian city of Rio de Janeiro. Obes Res. 2002;10(1):42-8.
21. Thomazella MCD. Efeito da dieta tipo Mediterrânea na função endote-lial e inflamação da aterosclerose: estudo comparativo com a dieta TLC (Therapeutic Lifestyle Changes, no NCEP–ATPIII) [Tese de Doutorado]. São Paulo: Faculdade de Medicina, Universidade de São Paulo; 2010. 144p. 22. Marchioni DM, Fisberg RM, Góis Filho JF, Kowalski LP, Carvalho MB, Abrahão M, et al. Dietary patterns and risk of oral cancer: a case-control study in São Paulo, Brazil. Rev Saude Publica. 2007;41(1):19-26. 23. Resende ALS, Mattos IE, Koifman S. Dieta e câncer gástrico: aspectos
históricos associados ao padrão de consumo alimentar no estado do Pará. Rev Nutr. 2006;19(4):511-9.
24. Albuquerque RCR, Monteiro GTR, Pereira RA, Koifman S. Padrões di-etéticos e tumores cerebrais: estudo caso-controle no Rio de Janeiro. Cad Saúde Colet. 2012;20(3):271-9.
25. Kerver JM, Yang EJ, Bianchi L, Song WO. Dietary patterns associated with risk factors for cardiovascular disease in healthy US adults. Am J Clin Nutr. 2003;78(6):1103-10.
26. Centritto F, Iacoviello L, di Giuseppe R, De Curtis A, Costanzo S, Zito F, et al; Moli-sani Investigators. Dietary patterns, cardiovascular risk factors and C-reactive protein in a healthy Italian population. Nutr Metab Cardiovasc Dis. 2009;19(10):697-706.
27. Olinto MT, Gigante DP, Horta B, Silveira V, Oliveira I, Willett W. Major dietary patterns and cardiovascular risk factors among young Brazilian adults. Eur J Nutr. 2012;51(3):281-91.