Faculdade de Ciências
Departamento de Biologia Animal
"
Genetic Diversity of Microcebus tavaratra
(Northern-rufous-mouse-lemur) in the fragmented forests of Daraina (North of Madagascar)."
Ana Priscila Sousa
Dissertação de Mestrado
Universidade de Lisboa
Faculdade de Ciências
Departamento de Biologia Animal
"Genetic Diversity of Microcebus tavaratra
(Northern-rufous-mouse-lemur) in the fragmented forests of Daraina (North of Madagascar)."
Ana Priscila Sousa
Mestrado em Biologia Humana e Ambiente
Dissertação orientada por Prof. Dr. Lounès Chikhi (IGC) e Prof
Dr. Deodália Dias (FCUL)
Resumo
Vivemos num mundo altamente imprevisível no qual o Homem tem a capacidade de provocar alterações nas paisagens de forma cada vez mais intensa e com poucos limites. A diversidade genética atribui às espécies a capacidade de se moldarem às mudanças do seu ambiente, atribuindo-lhes um maior potencial de adaptação e sobrevivência (Reed e Frankham, 2003; Booy et
al., 2000). É assim um factor de extrema importância na sobrevivência das espécies face a tais
perturbações. Contudo hoje em dia esta tem vindo a ser comprometida, e uma das maiores causas é a perda e fragmentação dos seus habitats causada pela actividade humana (Schwitzer et al., 2013).
A ilha de Madagáscar é considerada um dos principais hot-spots de biodiversidade do planeta (Myers et al., 2000). Contudo, ao mesmo tempo, é um local com um elevado impacto ambiental. A destruição causada pela actividade humana chegou a um ponto tão extremo nesta ilha que muitas das espécies endémicas se encontram à beira da extinção (IUCN, 2014). Uma preocupação mundial é a fauna endémica de lémures de Madagáscar, sendo considerados a maior prioridade de conservação de primatas do Mundo. Estes animais necessitam das florestas para sobreviver, no entanto, estima-se que apenas entre 10 a 20% da área da ilha permanece adequada à existência destes (percentagem total da área florestal) e nela a pressão humana ainda é uma realidade (Schwitzer et al., 2013; Myers et al., 2000). Actividades como a agricultura, a produção de carvão e a extracção de produtos de uso local têm vindo a destruir habitats em grande escala. A actividade mineira que existe em Madagáscar tanto em pequena como em grande escala e o corte selectivo de árvores são também grandes causas de destruição (Schwitzer et al., 2013; Patel, 2007). Para acrescentar, a caça de lémures, apesar de ilegal, ainda acontece e compromete a sobrevivência de várias populações de lémures a nível local (Golden et al., 2011; Golden, 2009).
Os lémures-rato (género Microcebus) são animais nocturnos, omnívoros que vivem nas florestas e são os primatas mais pequenos do mundo. O género Microcebus é dos mais abundantes em Madagáscar apresentando a distribuição mais ampla pela ilha (Rasoloarison et al., 2013). Este género pertence à família Cheirogaleidae e contém pelo menos 21 espécies descritas até hoje (Rasoloarison et al., 2013; Radespiel et al., 2012; Pastorini et al., 2001). A espécie Microcebus
espécie é considerada Vulnerável de acordo com as designações da lista vermelha da IUCN (Andriaholinirina et al., 2014). Um dos locais onde esta espécie pode ser encontrada é na região Loky-Manambato no norte de Madagáscar. Loky-Manambato é uma região protegida na totalidade desde 2012, sendo que alguns dos fragmentos florestais já eram protegidos desde 2005 (Schwitzer
et al., 2013, Salmona et al., 2014). Contudo é uma região extremamente fragmentada com uma área
florestal representada por apenas 17% da área total. Não se sabe quando esta fragmentação terá acontecido, contudo os fragmentos de floresta actualmente existentes sofrem todos de algum grau de destruição causada por actividades antropogénicas. Esta área é também atravessada por uma estrada nacional e pelo rio Manankolana. Várias espécies de lémures podem ser encontradas nesta região, incluindo a espécie Microcebus tavaratra (Salmona e Zaonarivelo, 2013).
No presente estudo a diversidade genética e a estrutura populacional da espécie Microcebus
tavaratra da região Loky-Manambato foram avaliados. Mais especificamente, duas perguntas foram
consideradas: (i) de que forma a diversidade genética se encontra distribuída por entre os fragmentos florestais e (ii) poderemos identificar os factores que geram diferenciação entre as populações nos diferentes fragmentos?
Para responder a estas perguntas DNA foi extraído de 113 biopsias de orelhas, colhidas em seis zonas de amostragem: Bekaraoka, Antsakay, Solaniampilana, Binara, Ambohitsitondroina e Benanofy. Não existem microssatélites criados especificamente para a espécie Microcebus tavaratra. Assim, vinte microssatélites criados para a espécie Microcebus murinus foram amplificados neste estudo. Os indivíduos de cada local de amostragem foram considerados como representantes de uma população. Para cada população as medidas de diversidade genética (He, Ho e Fis), diferenciação (Fst), estrutura (incluindo AMOVA) e o padrão de isolamento-por-distância foram calculados, utilizando os programas Genetix 2.05.2, STRUCTURE 2.3.4., ARLEQUIN 3.11 e GenAlex 6.5. Foi ainda avaliada a qualidade de amplificação de cada microssatélite de forma a identificar possíveis loci para os quais a amplificação tivesse sido alterada pela utilização de marcadores criados para outra espécie.
Cinco loci foram considerados como possivelmente problemáticos e não sendo possível averiguar isto de forma mais profunda na extensão deste estudo decidiu-se criar dois sets de análises, um com os 16 microssatélites (AS16) e outro no qual os 5 mencionados foram excluídos (AS11). Ambos os sets foram analisados em paralelo e os resultados foram apresentados neste
trabalho. Contudo apenas o set de análises AS11 foi considerado para as medidas de diversidade genética sendo que para o resto das análises apenas o set AS16 foi tido em conta.
Os resultados obtidos neste estudo mostraram que os indivíduos da espécie Microcebus
tavaratra estudados ainda apresentam um elevado nível de diversidade genética, apesar de viverem
numa região altamente fragmentada. As populações mostraram alguma diferenciação entre si, contudo não muito pronunciada. Isto poderá indicar a existência de corredores florestais a conectarem os fragmentos de floresta preservando a troca de genes entre as populações e/ou que o tamanho efectivo das populações é ainda grande o suficiente para que estas não sejam influenciadas pela deriva genética. As análises corridas com o programa STRUCTURE e a AMOVA sugeriram um agrupamento das populações em três grupos principais: Bekaraoka com Antsakay, Solaniampilana com Benanofy e Ambohitsitondroina com Binara. Um padrão fraco de isolamento-por-distância foi detectado, contudo não explicou este agrupamento nem a diferenciação entre as populações na totalidade. Esta por sua vez parece ser influenciada por uma combinação de factores. Por um lado notou-se a influência da falta de corredores florestais ligados aos afluentes do rio Manankolana ligando a maioria dos fragmentos a Ambohitsitondroina levando a uma diferenciação mais pronunciada desta população. Por outro lado a vila de Daraina e toda a actividade humana associada pareceu influenciar a diferenciação de Bekaraoka relativamente às outras populações e especialmente em relação a Binara, uma vez que este fragmento se encontra exactamente no lado oposto da vila. Estudos feitos na mesma área demonstraram que o rio Manankolana foi actua como um importante factor de diferenciação noutras espécies de lémures, como o Propithecus tattersalli (Queméré et al, 2010). Contudo aqui o rio Manankolana e a estrada nacional não pareceram actuar como barreiras ao fluxo genético entre as populações.
No espectro deste estudo os factores que influenciam a diferenciação das populações de
Microcebus tavaratra não puderam ser examinados de forma mais detalhada. Não só o tempo foi
limitado como se encontrou uma discrepância entre os tamanhos de amostra que dificultaram a interpretação dos resultados. Contudo os resultados obtidos neste estudo serão uma base para estudos mais amplos que determinem com mais precisão os efeitos da fragmentação nesta espécie. Tais estudos incluirão mais fragmentos de florestas e incorporar um maior número de marcadores e
conclusões. Isto será importante pois permitirá providenciar a informação necessária à criação de medidas de conservação mais robustas e que permitam uma melhor protecção desta espécie.
Resumo (Abstract)
Madagáscar é um dos principais hot spots de biodiversidade do Mundo e ao mesmo tempo um local com um enorme impacto ambiental. A agricultura, corte de árvores e mineração de ouro destroem os habitats a uma velocidade tão elevada que muitas das espécies endémicas da ilha se encontram sob ameaça de extinção. Isto é uma realidade para muitas espécies de lémures da ilha. Neste estudo a diversidade genética e estrutura foram investigadas para seis populações do lémure-rato Microcebus
tavaratra. Vinte microssatélites foram amplificados para 113 indivíduos mas quatro foram excluídos
por serem monomórficos ou darem resultados duvidosos. A diversidade genética e diferenciação foram calculadas com base nas medidas He, Ho, Fis e Fst. A estrutura foi avaliada com uma inferência Byesiana (programa STRUCTURE 2.3.4) juntamente com o método de ∆K de Evanno et
al., 2005 e por uma AMOVA. O padrão de isolamento-por-distância também foi investigado. Os
resultados obtidos neste estudo mostraram que apesar de viverem num ambiente fragmentado, as populações de Microcebus tavaratra ainda mostram um elevado nível de diversidade genética e um limitado nível de diferenciação. Isto sugere que o tamanho efectivo das populações ainda é elevado e/ou que o fluxo genético ainda se mantém entre os fragmentos florestais. Um fraco sinal de isolamento-por-distância foi detectado, contudo não pareceu ser o único factor a explicar a diferenciação. Parece haver uma influência da falta de corredores florestais a ligar Ambohitsitondroina aos outros fragmentos. Ao mesmo tempo, a vila Daraina juntamente com a actividade humana relacionada parecem estar a isolar a população de Bekaraoka dos outros fragmentos. O rio e a estrada nacional que atravessam a região não pareceram ter um papel importante na diferenciação entre as populações. Contudo, no espectro deste estudo não foi possível investigar de forma mais extensa os factores que influenciam a diferenciação entre as populações.
Palavras-chave: Madagáscar; Fragmentação; Diversidade genética; Microcebus tavaratra;
Abstract
Madagascar is one of the major hot spots of biodiversity in the world and at the same time a highly ecologically impacted place. The agriculture, tree cutting and gold mining destroy habitats in such a high rate that many of the endemic species of the island are now threatened with extinction. This is true for many lemur species of the island. Here genetic diversity and structure were assessed for six populations of the mouse lemur Microcebus tavaratra. Twenty microsatellite loci were amplified for 113 individuals, but four were excluded for being either monomorphic or provided unreliable results. Genetic diversity and differentiation were calculated based on He, Ho, Fis and Fst. Structure was inferred using a Bayesian approach (program STRUCTURE 2.3.4) together with Evanno et al, 2005 ∆K method and by an AMOVA. Isolation-by-distance was also assessed. The results obtained in this study showed that despite living in a highly fragmented environment, Microcebus tavaratra populations still present a high level of genetic diversity with limited level of differentiation between them. This suggested either that effective population sizes are very large and/or that gene flow is still maintained between forest patches. A weak isolation-by-distance pattern was detected, but it didn’t seem to be the only factor influencing differentiation. There seems to be an influence from the lack of riparian forest corridors connecting Ambohitsitondroina to the other forests. At the same time the Daraina village and its related human activity appear to be isolating Bekaraoka from the other patches. The river didn’t seem to play an important role in the differentiation between populations neither did the National road that crosses the region. However, in the extent of this study it wasn’t possible to investigate to a greater extent the factors underlying the differentiation between these populations.
Table of contents
Resumo ... 3
Resumo (Abstract) ... 7
Abstract ... 8
1. Introduction ... 1
1.1. Habitat loss and fragmentation in Madagascar ... 2
1.2. Impacts of habitat loss in lemur species ... 3
1.3. Mouse lemurs (Microcebus species)... 5
1.3.1 Microcebus tavaratra ... 8
1.4. Microsatellites in the study of population genetics ... 8
1.5. The Loky-Manambato region (Daraina) ... 9
1.6. This study ... 10
2. Materials and Methods ... 12
2.1. Sample collection ... 12 2.2. DNA extraction ... 12 2.3. Microsatellite Amplification ... 12 2.4. Analysis ... 13 2.4.1. Microsatellite choice ... 14 2.4.2. Genetic diversity ... 15 2.4.3. Isolation by Distance ... 15 2.4.4. Structure ... 15 3. Results ... 17 3.1. Microsatellite choice ... 17 3.2. Genetic diversity ... 19 3.3. Isolation by Distance ... 21 3.4. Structure ... 22 4. Discussion ... 27 4.1. Microsatellite choice ... 27 4.2. Genetic diversity ... 27 4.3. Isolation by distance ... 29 4.4.1. Pairwise Fst comparisons ... 30 4.4.2. STRUCTURE ... 32
4.5. This study as an extension to Pais work (2011) ... 35
5. Conclusion ... 37
1. Introduction
We live in an unpredictable world where the human species is able to make incredibly quick and sudden changes in the natural landscapes, compromising the existence of many species (IUCN, 2014). In such a world, genetic diversity is of extreme importance to species survival. Once the loss of genetic diversity leads to heterozygosity decrease, populations will have a lower evolutionary potential (which means a lower potential to adapt to changing environments), lower fitness and thus face higher probability of extinction (Reed and Frankham, 2003; Booy et al., 2000).
Although natural landscape changes can influence genetic diversity, one of the major threats, not only to genetic diversity but to biodiversity as whole, is caused by anthropogenic activities. A well-known and worrying issue is the landscape modifications such as deforestation done either for survival reasons or for economic expansion, which leads to habitat loss and fragmentation (Schwitzer
et al., 2013). Several studies have shown how habitat fragmentation influences genetic diversity not
only in animal groups such as Fish, amphibians, birds, insects and mammals but also in plants (Balkenhol et al., 2013-for mammals; Harrison et al., 2012-for birds; Dixo et al., 2009-for amphibians; Aguilar et al., 2008-for plants; Yamamoto et al., 2004-for Fish; Joyce and Pullin, 2003-for insects). It is therefore of extreme importance to find ways to control human activities that may cause the destruction of habitats. This is possible with the implementation of conservation strategies. However, although feasible, these strategies are not possible without financial cost and being it a said reality, financial constraints pose a real difficulty in implementing conservation plans. Hence, as Myers and colleagues have suggested, it is important to find priority sites for which, as they wrote “we can protect the most species per dollar invested” (Myers et al, 2000).
Madagascar, Africa’s largest island (and the fourth largest in the world) is considered one of the major hot-spots for biodiversity in the world. Its complex topography and geographical location (south-east of the continent) generated a wide range of climates and environments, and being isolated from the continent, it created a huge diversity of mostly endemic fauna and flora in almost all taxonomic groups (Yoder and Nowak, 2006; Goodman and Benstead, 2003). According to Myers and colleagues this Island comprises 3.2% and 2.8% of all world’s plant and vertebrate species, respectively, with endemism ranging from 55-100% at the species level. It also surpasses that of any
other hotspot in the world at the genus and family level (Myers et al., 2000). All of the above confer to Madagascar such an important value that makes it one of the world’s highest priority areas for biodiversity conservation (Myers et al., 2000);
Despite its valuable endemic biodiversity and priority for conservation, Madagascar is also one of the most ecologically impacted countries worldwide, a reason why many species have already become extinct (Burney, 1999). It is estimated that between 80 and 90% of Madagascar’s primary vegetation cover has already disappeared and many of the still present forest habitats are now fragmented (Myers et al., 2000). As a consequence many of Madagascar’s endemic species are on the verge of extinction (IUCN, 2014). Standing out as a global concern is Madagascar’s primate fauna. More specifically the endemic lemur species, considered as the highest primate conservation priority in the world (Schwitzer et al., 2013). Given that only about 10 to 20 % of Madagascar’s land area remains suitable for primates survival it is of extreme importance to understand in detail the effects of habitat degradation on these primates in order to create conservation strategies to protect them.
The present study is part of a major project which aims at assessing the effects of habitat loss and fragmentation across different lemur species thriving in the same region (e.g. Salmona et al., 2014; Salmona et al., 2014b; Queméré et al, 2009, 2010, 2012; Viana et al., 2010; Pais, 2011). This study is an extension of the work of Isa Pais (Pais, 2011) where genetic diversity and structure for M.
tavaratra species will be assessed based on microsatellite markers for six forest patches of the
Loky-Manambato region of Madagascar.
1.1. Habitat loss and fragmentation in Madagascar
Evidence suggests that most of the changes that led to the habitat loss in Madagascar began with the arrival of humans about 4000 year ago (Dewar et al., 2013; Gommerv et al., 2011). It is estimated that a great part of this loss, about 40%, happened more recently, between 1950s and 2000 (Harper et al., 2007). It is therefore considered that human activity has had a great part in the habitat destruction in Madagascar in the last centuries and specially now it is for sure a great threat to many lemur species throughout the island (Schwitzer et al., 2013).
then burning it to release the nutrients to the soil. Wood charcoal production for cooking and the extraction of forest products for local use which has been happening since the human arrival in the island, are also massive drivers of habitat loss (Schwitzer et al., 2013). Other activities include small and large-scale mining and selective logging which, although illegal, still exists and it’s possibly the most spread-out activity throughout the country (Patel, 2007). To add, also illegal but driven by a survival need for food is Madagascar’s wildlife harvest which is a major concern and it has been increasingly recognized to compromise the survival of lemur populations (Golden et al., 2011; Golden, 2009).
Conservation strategies have been implemented throughout the country. By now, the island comprises more than 4.7 million ha of protected areas, which represents almost all of its remaining natural vegetation. However illegal activities still happen, like cutting trees of valuable timber species for example, still impacting the protected areas (Schwitzer et al., 2013). One important step towards controlling these illegal activities is the implementation of research projects in those areas. This will not only enable a better understanding of the effects of such disturbances in the lemur populations but also bring the presence of researchers to the protected areas and which represent a better surveillance and control of illegal activities (Salmona and Zaonarivelo, 2013).
1.2. Impacts of habitat loss in lemur species
Lemurs are forest dwelling animals and thus depend on the stability of the forests to thrive. Sadly, instead of living in healthy stable habitats, lemur populations are being hunted, suffering from indirect pressure of the sudden appearance of thousands of migrant miners in small areas where previously there was almost no human pressure, suffering from the destruction of their habitats and being forced to live in smaller, increasingly fragmented forest areas (Schwitzer et al., 2013). As a consequence, since the arrival of men many lemur species have become extinct (although the exact causes are not entirely known), including for example the entire radiation of giant lemurs, which included at least 17 species described so far (Godfrey, 2002). Furthermore, despite all conservation efforts, illegal activities such as commercial hunting still happen occasionally, leading to the extinction of local populations (Schwitzer et al., 2013). So it is not surprising that by 2012, during a workshop involving more than 60 lemur experts, out of the 99 lemur taxa for which data was available, 24 were considered Critically Endangered, 49 Endangered, 20 Vulnerable, 3 Near Threatened and 3 Least
Concern. These values were obtained using the IUCN Red List criteria (IUCN, 2014; Schwitzer et al., 2013).
As it was already mentioned, habitat loss and fragmentation are common threats to species survival. Once a barrier impedes the connection between two populations, there will be consequences at the gene level (Reed and Frankham, 2003). This has been shown for many lemur populations throughout Madagascar’s forests. Craul and colleagues collected ear biopsies for Milne-Edward’s sportive lemur (Lepilemur edwarsi) populations in a very fragmented region on North-western Madagascar. They implemented two methods of analysis, one based on mitochondrial DNA (mtDNA) and the other on nuclear DNA (microsatellites). Their results showed an overall medium to low genetic diversity within populations. They also found evidence for a population collapse in the last hundred years, even in the largest forest analysed, having this species completely disappeared from the most isolated forest fragments (Craul et al., 2009). Likewise, the effects of forest fragmentation have also been demonstrated for other species, like the red ruffed lemur (Varecia rubra) (Razakamaharavo et al., 2009). On the other hand, a study was implemented for the golden-crowned sifaka (Propithecus tattersalli) from the Loky-Manambato region (North-eastern Madagascar), the same region of this study. The results showed that despite the high level of the forest fragmentation observed in the area, the populations still presented a high level of genetic diversity (Queméré et al., 2009). However the authors noted that the high expected heterozygosity values in their samples were associated with a small number of alleles which has been suggested to happen in populations which were previously large and subjected to a demographic bottleneck (Nei et al., 1975) and it has been linked to habitat fragmentation in other primates as well (e.g. Olivieri et al., 2008).
The results of Olivieri and Queméré’s studies show that the effects of forest fragmentation are not, to some extent, consistent, demonstrating that different species may respond differently to the same habitat disturbances. This may be due to their different social, foraging and breeding behaviours. However these comparisons must be made with caution once these studies used a different sampling design, different markers and where implemented in different regions, which may lead to biased comparison conclusions.
evidence of the effects of forest fragmentation in the differentiation and genetic diversity of the studied populations. According to their results populations within smaller forest fragments had reduced or completely eliminated genetic diversity as opposed to those within bigger fragments which showed high levels of diversity (Guschanski et al., 2007). Negative effects of the decreasing size of forest habitats were also suggested for this species by Radespiel and colleagues, which also noted that not only natural but also anthropogenic barriers may compromise gene flow between social groups (Radespiel et al., 2008). Olivieri and colleagues also collected ear biopsies of Microcebus
ravelobensis and two other mouse lemur species, the Bongolava mouse lemur (M. bongolavensis)
and the Danfoss’ mouse lemur (M. danfossi) throughout their entire distribution (North-western Madagascar). Based on microsatellite data they found evidence for the influence of forest fragmentation in population decline and genetic differentiation among populations. They suggested that this may have happened in the last 500 years (Olivieri et al., 2008). On the other hand, Schad and colleagues showed only a limited effect of this disturbance on Microcebus murinus in the littoral forest fragments of South-eastern Madagascar (Schad et al., 2004). Results are also not consensual for Microcebus species and more studies inferring the effects of habitat fragmentation on this genus are necessary.
It is important to increase the number of studies in all lemur species and apply a multi-species approach in order to enable comparison between them and a better understanding of the real effects of habitat destruction loss and fragmentation in lemur species as a whole. This study comes from that need and as mentioned above it will focus in the Microcebus tavaratra lemur species.
1.3. Mouse lemurs (Microcebus species)
Mouse lemurs (Microcebus sp.) are nocturnal, omnivorous forest dwelling animals and the world’s smallest primates (<100g). They are one of the most abundant and widespread genera of lemurs, being found in all major forest habitats in Madagascar (Rasoloarison et al., 2013; Olivieri et al., 2007) (Fig.1). The genus Microcebus belongs to the family Cheirogaleidae together with the genera
Allocebus, Cheirogaleus, Mirza and Phaner and it contains 21 species described to date
(Rasoloarison et al., 2013; Radespiel et al., 2012; Pastorini et al., 2001). Some Microcebus species have a broad distribution range, such as M. murinus and others a regionally or even locally restricted distribution range, such as M. griseorufus, M. berthae, M. myoxinus, M. ravelobensis, M.
sambiranensis and M. tavaratra (Radespiel, 2006). As reviewed by Radespiel in 2006, Microcebus
individuals are considered solitary foragers presenting, however, a regular contact with conspecifics within or outside the mating context. Their home range is generally smaller than five ha and their sleeping behaviour may be represented by the formation of stable sleeping groups of related females and solitary males (e.g. M. murinus), groups consisting of females and males (e.g. M. ravelobensis), or solitary sleeping (e.g. M. berthae). However, much of what is known about Microcebus species is based on the biology of Microcebus murinus, the most widespread species, and the ecology, distribution and population sizes of the remaining species are to a large extent unknown. Hence, further research is needed in order to better understand the foraging and social patterns of each species (Meyler et al., 2012; Radespiel, 2006).
Microcebus species are sympatric with other nocturnal species and in most regions of
Madagascar they are found coexisting with other Microcebus species, however without evidence for gene flow between them (Weisrock et al., 2010). Being the most widely distributed genus in Madagascar, three main biogeographic models were designed to explain their distribution throughout Madagascar. There is no consensus between them yet, but nevertheless all three include the barrier effects of larger rivers, suggesting that these are an important factor in genetic differentiation (Olivieri
et al., 2007; Craul et al., 2007; Wilmé et al., 2006; Martin, 1995). In addition, Weisrock and colleagues
presented an extensively and detailed species delimitation study of these genera, in 2010, and suggested that although recognized as different species, some of these lineages may not yet be reproductively isolated, highlighting the fact that lineage divergence may have occurred not long ago (Weisrock et al., 2010).
Due to their short (one year) generation time which allows for demographic changes to quickly leave genetic signatures, and to their population sizes which are still large enough to have preserved some genetic diversity (essential to reconstruct those demographic changes), mouse lemurs represent a good model to study the consequences of habitat fragmentation (Olivieri et al., 2008).
Fig.1- Distribution of Microcebus species known until 2010 and studied in Weisrock et al., 2010 (Origin:
Weisrock et al., 2010).
1.3.1 Microcebus tavaratra
Microcebus tavaratra is an endemic species of Madagascar. To date it has been found to inhabit the
Loky-Manambato region (Daraina), Andavakoeira, Andrafiamena, Ankarana, Analamerana forest and up to the “Montagne des Français” in the north of Madagascar (Salmona et al., 2014; Pais, 2011; Mittermeier et al., 2010). Microcebus tavaratra can be found in different habitat types like tropical deciduous gallery forests or deep canyons sporting limestone pinnacles and cliffs (tsingy) in the Ankarana Special Reserve, lowland dry and transition humid forests of Daraina and possibly the tropical lowland montane forest in Montagne d’Ambre (Andriaholinirina et al., 2014; Pais, 2011; Mittermeier et al., 2010).
Their estimated population density ranges from 132 to 222 individuals /km2 (Salmona et al., 2014; Meyler et al., 2012). This species inhabits severely fragmented habitats which are still decreasing in area and quality due to illegal activities such as logging, uncontrolled bushfires, cutting vegetation for charcoal and mining for sapphires (Andriaholinirina et al., 2014).
All together provides this species with the conservation status of Vulnerable in the IUCN Red List. It is, however, a protected species and it is listed on Appendix I of CITES - Convention on International Trade in Endangered Species of Wild Fauna and Flora (Andriaholinirina et al., 2014).
1.4. Microsatellites in the study of population genetics
Microsatellites, also known as simple sequence repeats (SSRs) or short tandem repeats (STRs) are motifs of one to six nucleotides repeated several times throughout the genome of Eukaryote beings (Kelkar et al., 2010). Having elevated mutation rates, they are typically polymorphic conferring variation between individuals, which is manifested as different repeat numbers (Guichoux et al., 2011). For their mutational quality, they play a major role in creating the genetic variation underlying adaptive evolution (reviewed by Bhargava and Fuentes, 2010). For this reason, microsatellites are widely used for the study of fingerprinting, parentage identification, genetic mapping and conservation and population genetics (Guichoux et al., 2011; Bhargava and Fuentes, 2010). Microsatellites are thus a powerful tool for inferring population patterns as well as demographic processes (Putman et
1.5. The Loky-Manambato region (Daraina)
Loky-Manambato is a region in the north of Madagascar which, as the name indicates, is delimited by two main rivers, the Loky and the Manambato. It is a highly fragmented area with a total forest cover represented by only 17% of its total area (44,000 ha). However there is no knowledge as to when this fragmentation may have happened. What it is known is that in the present all forest patches suffer from some degree of human disturbance either for agricultural purposes and cattle grazing or hardwood harvesting and charcoal production (Salmona and Zaonarivelo, 2013; Queméré et al., 2012).
The climate is seasonal, represented by a cool dry season from May to October and a hot, rainy season from November to April. This region has been fragmented into eleven forest patches which are formed mainly of lowland dry forest with primary and secondary dry deciduous and dry evergreen vegetation. However transition and humid forests can still be found (for example in Binara). The forest patches are surrounded by grazing pastures for zebu cattle, agricultural areas, human settlements, large grasslands or dry scrubs but also by a mixture of riparian gallery forests which, evidence suggests, may serve as a connection between patches (Salmona and Zaonarivelo, 2013; Queméré et al., 2012). The Daraina region is also crossed by a large river, the Manankolana River, which flows from south to northeast, and by the RN5A unpaved national road which runs southeast to northwest (Fig.2).
In 2005 the Station Forestière à Usage Multiple – SFUM (Multiple Usage Forest Station) was implemented in the Loky-Manambato region and it only included some of the patches (as represented in fig.2) (Salmona et al., 2014). However since 2012 all the Loky-Manambato region became a protected area managed by the NGO Fanamby.
In this region several lemur species can be found. These include the Tattersall’s sifaka (Propithecus tattersalli), the Sportive lemur (Lepilemur milanoii), the Sanford’s brown lemur (Eulemur
sanfordi), the Sanford’s crowned lemurs (Eulemur coronatus), the Northern bamboo lemur
(Hapalemur occicentalis), the Fat-tailed dwarf lemur (Cheirogaleus medius) and the Northern rufous mouse lemur (Microcebus tavaratra). The Montagne d’Ambre fork-marked lemur (Phaner
electromontis) is also suspected to inhabit in this region as well as others that may remain to be
lemurs in this area are also increasingly threatened by unsustainable levels of hunting. It is thus not surprising that almost all the mentioned species are categorized as Endangered by the IUCN Red List, with the exception of M. tavaratra and E. coronatus which have the status Vulnerable and C.
medius with is currently under the status of Least concern (Salmona and Zaonarivelo, 2013).
In this study samples were collected from six of the eleven forest patches of the region. These were Bekaraoka (62.48km2), Benanofy (25.17 km2), Solaniampilana (22.23 km2), Ambohitsitondroina (38.32 km2) and Binara (45.64 km2). For analysis purpose, and for having too main separate sampling locations, Bekaraoka was considered as being two different populations: Bekaraoka south remained as Bekaraoka, and Bekaraoka north was named Antsakay. All forest patches are covered by the SFUM station (Salmona et al., 2014) (Fig.2).
1.6. This study
The aim of this study is to assess genetic diversity and structure for Microcebus tavaratra species following the work carried out by Pais (2011) who confirmed that M. tavaratra was the species present in three forests, Bekaraoka, Binara and Solaniampilana of the Loky-Manambato region (Daraina). No evidence for sympatry with other Microcebus species was found although Pais (2011) recommended further investigation into this aspect. Pais study was also the first to assess genetic diversity for
Microcebus tavaratra based on mtDNA and microsatellite markers. As an extension to Pais work, this
study aims at increasing the number of microsatellite markers used, as well as the sample sizes and number of forest patches studied in the Loky-Manambato region. It is important to note that during the laboratory phase of this study mtDNA markers were also amplified for all individuals, however due to time constraint only analysis for the microsatellite data will be presented in this thesis.
Here, therefore two main questions are addressed: (i) how is genetic diversity distributed across forest fragments? and (ii) can we identify the factors generating differences between populations in different patches?
Bekaraoka Antsakay Binara Solaniampilana Ambohitsitondroina Daraina
Fig.2- Map of the Loky-Manambato region (Daraina), with the six forest patches and sampling sites
identified. This map was created using ArcGis. Note that the layer “protected areas” is not up to date and it represents the protected areas by the time of 2005.
2.
Materials and Methods
2.1. Sample collection
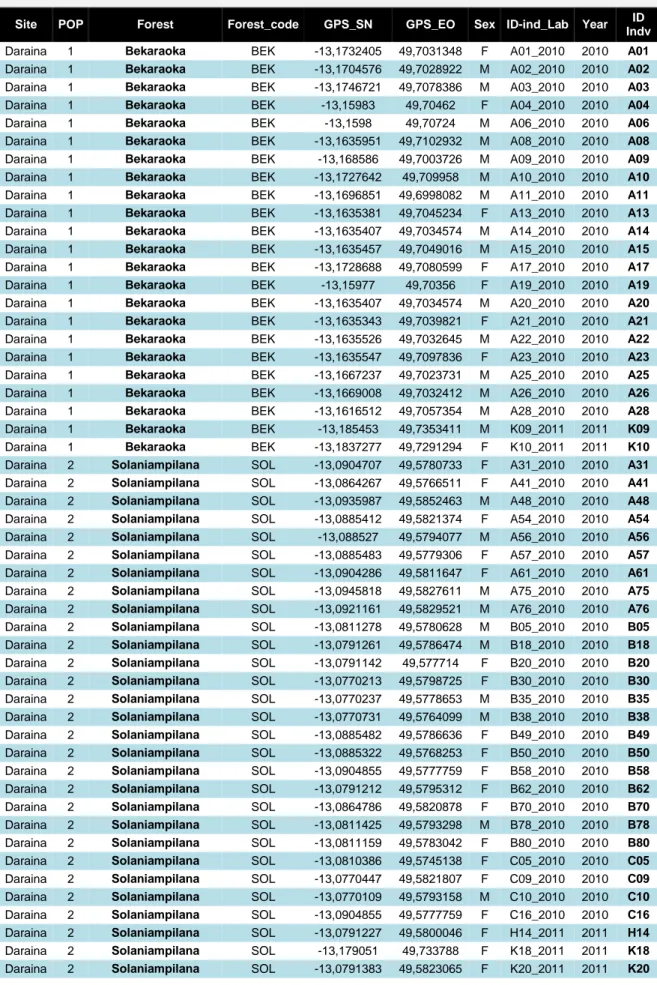
Samples were collected in 2010 and 2011 by J. Salmona and various collaborator of an FCT-funded project led by L. Chikhi, from six sampling sites (Bekaraoka, Antsakay, Solaniampilana, Binara, Ambohitsitondroina and Benanofy) of the Loky-Manambato region (Daraina) in Northern Madagascar, using Sherman traps (H.B. Sherman Traps®) (Fig.2, Annex A). A total of 113 individuals (71 and 40 for 2010 and 2011, respectively) were genotyped and analysed in this study (Annex A). One to three ear biopsies were sampled from each M. tavaratra individual and stored in Queens Lysis Buffer (QLB, Seutin et al., 1991) which allows for long term tissue and DNA preservation at room temperature.
2.2. DNA extraction
DNA extraction was performed for 113 ear biopsies. A blood and tissue Quiagen Kit was used for the extraction. Each biopsy was incubated in a solution of 300µl of digestion buffer (composed of 100mM EDTA, 100mM NaCl, 50mM Tris pH8 and 1%SDS), 20µl of Proteinase K at a concentration of 10mg/ml (Promega #V3021) and 20 µl 1M DTT (Dithiothreitol). A standard mammalian DNA isolation protocol was used as in previous studies by our group (Annex A; Annex C)
2.3. Microsatellite Amplification
In this study 20 polymorphic dinucleotide microsatellite markers were amplified (Table 1). Since there are no microsatellite loci specifically designed for Microcebus tavaratra, the microsatellites used here were originally designed for Microcebus murinus (Mm in the microsatellite labels), and had already been successfully tested in other Microcebus species (with the exception of the locus Mm58 for which no data of such experiment was found) and, more recently, also for M. tavaratra (e.g. Pais, 2011- M.
tavaratra; Olivieri et al., 2008- M. ravelobensis, M. bongolavensis and M. danfossi; Hapke et al., 2003- M.berthae, M.rufus and M. griseorufus).
Each forward primer was marked with a fluorescent dye (Table 1). Considering the colour of the dye, the size and the annealing temperature of the primer six mixes were created for the PCR
amplification occurred according to the following protocol: 10µl reaction containing 0.1µl of each primer (0.15 mM concentration), 5µl of My Taq HS Mix (Bioline-25045), 1µl of template DNA and water. The PCR cycle conditions were: initial denaturation of 4 minutes at 94 ºC, followed by 33 cycles of 30 seconds at 94ºC, 30 seconds at the primers annealing temperature (Table 1) and 30 seconds at 72ºC, and an extension of 7 minutes at 72ºC. Negative controls were used in every PCR reaction.
Genotyping was performed by the Genotyping Unit of the Instituto Gulbenkian de Ciências with ABI 3130 DNA equipment using LIZ labelled size standard ladder and the genotypes were checked and edited using GeneMapper® Software 5.
All the described methods were previously optimized by our group for their practicality and budget advantages and were chosen based on previous studies made by our group and associate groups, in order to facilitate posterior comparison (e.g. Pais, 2011).
Ta
ble 1- Primer information concerning all 20 loci used in the studyLocus Primer Sequence (5'-3') AT Dye NA GenBank
Accession Paper
Mm07 AGTACCTAAGCCTGCCATTT 50 ROX 5 AF280082 Radespiel et al., 2001
Mm43b CTA AAC TCC AAT ACA CAT ACC 58 FAM 20 AY154676 Hapke et al., 2003 Mm60 ACT GGA AAA TTT CAT TAC AAC AT 54 CY3 16 AY154679 Hapke et al., 2003 Mm03 AGCCTCACTGTTTCAGTTGTGT 55 FAM 15 AF280081 Radespiel et al., 2001
Mm08 CAGTTGGTGAATGGGCTAGG 55 CY3 29 AF280083 Radespiel et al., 2001
Mm22 GATATTTGCAGTGACGTCAAA 58 ROX 16 AY154670 Hapke et al., 2003
Mm58 GTTTGAACCCCCATAATATTCT 54 HEX 2 AY227663 Hapke et al., 2003
Mm26b TAA ATA ACC AAG TAA AGG GTT C 58 FAM 10 AY154671 Hapke et al., 2003
Mm30 GATGCTGAACCTCTGTCTG 58 CY3 15 AY154672 Hapke et al., 2003
Mm39 TAC ACT CTG GGT TAC ATA AGA 58 ROX 26 AY154673 Hapke et al., 2003 Mm51 CTT GAG GAA GTC TCT GAG G 58 HEX 12 AY154677 Hapke et al., 2003
Mm21 TCAATGCATCAATTAACCACG 58 ROX 16 AY154669 Hapke et al., 2003
Mm42 CAT GGT TTC AGG TAC TCC C 58 FAM 30 AY154675 Hapke et al., 2003
C1P3 AGCCGAACACATTTCAGAGG 50 FAM 21 AF28007 Radespiel et al., 2001
Mm02 TTAACAGGGCCTTCTCCTCAC 53 ROX 10 AF280080 Radespiel et al., 2001 Mm06 CCT GCC TCA AAA TAA AAA AGA AAT 48 FAM 16 J420848 Wimmer et al., 2002
Mm40 GAGAACAAGGATAGAATGTAAA 58 HEX 13 AY154674 Hapke et al., 2003
Mm10 GGGCTCCAATAGAGGCAATAA 50 HEX 22 AF280084 Radespiel et al., 2001 MmF3 GCC CAA CGC TGA AGT AAG GAG 48 HEX 18 AJ420849 Wimmer et al., 2002
MmF6 CAA CGG AGG GTA TTT TCA 48 ROX 16 AJ420850 Wimmer et al. 2002
AT-annealing temperature; NA-number of alleles. Mixes are identified by colour in the "Locus" row.
2.4. Analysis
For the purpose of this study the 113 M. tavaratra individuals were considered as belonging to six populations according to their sampling forest patch (each forest patch was regarded as a different
population). Genetic diversity measures and departures from Hardy-Weinberg Equilibrium (HWE) were calculated for each population. Structure and Isolation-by-Distance (IBD) also assessed. For these analyses, four different programs were used: Genetix 4.05.2, a software designed to calculate several parameters commonly used in population genetics and carry out tests by permutation analyses (Belkhir et al., 2004); ARLEQUIN 3.11, which provides similar methods but also allows to carry out additional ones such as AMOVA (Laval and Schneider, 2005); GenAlex6.5, an Excel add-in that provides a collection of Macros which allow a wide range of population genetic analyses and provides an easy way to carry out IBD analyses (Peakall and Smouse, 2012); and STRUCTURE 2.3.4, a program that implements a method that assesses population structure based on a clustering model that uses genotype data consisting of unlinked markers (Pritchard et al., 2000a).
2.4.1. Microsatellite choice
As mentioned before the microsatellite markers used in this study were not specifically designed for
M. tavaratra species but for M. murinus. Although M. tavaratra and M. murinus belong to the same
genus, it is important to identify and possibly exclude what in this study will be called “problematic loci”. At first 20 microsatellites were chosen from previous studies (Hapke et al., 2003; Wimmer et al., 2002; Radespiel et al., 2001). After amplification two were excluded for being monomorphic (Mm F6 and Mm60) and two others for showing amplification problems either for having too many missing data due to failure of PCR amplification (Mm10) or for resulting in suspicious readings which were not possible to decipher in this study (Mm06) (Table 1). Thus, the final data-set consisted of 16 loci. In order to check if there was any problematic loci (either for the presence of null alleles, allele dropout or false alleles) departures from Hardy-Weinberg Equilibrium (HWE) and FIS were calculated for each
locus. HWE departures were calculated using the observed vs expected heterozygosity with a Q-square test for significance (using GenAlex 6.5) and significance of FIS was assessed with 10.000
permutations (using Genetix 4.05.2). Multiple comparisons were made for each population with and without the loci that seemed to be problematic in order to check for any major differences in the genetic diversity measures. Micro-Checker 2.2.3 software (Oosterhout et al, 2004) was also used to check for evidence of null allele and large allele dropout for each locus. In addition, comparisons were made between genetic diversity measures calculated for each locus on this study and other studies
studies, which could indicate possible errors of amplification. Pairwise linkage disequilibrium was estimated using Weir’s correlation coefficient (Weir, 1979) and significance was assessed with 1000 permutations.
2.4.2. Genetic diversity
Genetic diversity was measured using the number of alleles per locus (NA), the mean number of alleles per population (MNA) the observed heterozygosity (Ho) and Nei’s unbiased expected
heterozygosity (HE) per population (Nei, 1978). A linear regression was made to test for correlation
between the mean number of alleles per population and the size of the population (number of individuals). FIS (intra-population fixation index) was calculated as a measure of departure from HWE
and pairwise FST as a measure of genetic differentiation between populations, both according to Weir
and Cockerham (1984) and significance was accessed with 10.000 permutations. All the above mentioned analysis were made using Genetix 4.05.2, with the exception of the linear regression applied to the MNA which was done using Excel and the pairwise FST which were calculated using
ARLEQUIN 3.11.
2.4.3. Isolation by Distance
Isolation by Distance was assessed using GenAlex 6.5. Individual geographic distances were calculated by the program, based on GPS coordinates. Individual genetic distance was also calculated by the program. A Mantel test with 9999 permutations was performed using the two previously created matrices – individual geographical distance vs individual genetic distance.
2.4.4. Structure
As mentioned before the 113 individuals were grouped by forest (six populations). To test whether this was a valid grouping or if there was any different structure, a Bayesian clustering approach was implemented using STRUCTURE 2.3.4 software. Using a Markov Chain Monte Carlo (MCMC) approach the program groups individuals into clusters. Requiring a prior minimum and maximum number of expected genetic clusters (K), based on their genotypes and with no prior information on their sampling locations the program calculates the probability of each individual to be assigned to a particular cluster. Analysis were performed for K values between 1 and 9 (three more than the real
number as suggested by Evanno et al. (2005)), and for each K, 20 runs were performed with length of burnin period equal to 60.000 and 20.000 MCMC repeats after burnin. The admixture model was used with initial alpha value of 1.0 with this value being used for all populations, a maximum value for alpha 10.0 and Standard Deviation of 0.025. Allele frequencies were set to be correlated among populations and Fst values to be different for different subpopulations. A prior mean of Fst for populations was chosen to be 0.01, the prior SD of Fst for populations 0.05 and a constant lambda of value 1.0 (adapted from Queméré et al., 2010; Olivieri et al., 2008).
To determine the most probable K value, STRUCTURE HARVESTER (Earl and vonHolds, 2012) online server was used. This server implements the Evanno ad hoc summary statistic ∆K method (Evanno et al., 2005). It calculates ∆K based on the rate of change of the estimated likelihood between successive K values (L(K)) and using ∆K it suggests the most probable K applied to the input data.
Each individual was assigned to the group to which the posterior probability (q) was the highest. Individuals were only assigned to a cluster if this value was higher than 0.6 (as in Queméré et
al., 2010). Individuals for which the posterior probability was lower than 0.6, weren’t attributed to any
cluster. All the analyses were repeated for each cluster until no further substructure was found.
AMOVA
To further infer about the structure and differences within and amongst populations an AMOVA was performed using ARLEQUIN 3.11 software. Significance of results was tested under 10000 permutations.
NOTE: As in the Lab section, in order to facilitate comparison of results, all the analyses performed were done similarly to Pais, 2011, Queméré et al., 2010 and Olivieri et al., 2008.
3. Results
3.1. Microsatellite choice
In this study 16 polymorphic dinucleotide microsatellite loci were analysed. None of the loci showed systematic deviations from Hardy-Weinberg Equilibrium (HWE). However five loci (Mm02, Mm03, Mm21, Mm22 and Mm30) showed significant departure from HWE in more than two locus-population combinations, four of which (all but Mm03) showed evidence for null alleles. These five loci were considered as possible problematic loci. Two other loci (Mm26b and Mm40) showed HWE departure in one population each but no locus or populations seemed to stand out, so they were kept for all analyses. There was no evidence for linkage disequilibrium between any pair of loci, after Bonferroni correction; hence all 16 loci were kept and used for all the analyses. Furthermore, genetic diversity measures (HE, HO and FIS) were calculated for each of the 16 loci (Table 2) and compared to other
studies that used the same markers. All values were in accordance with those from other studies with no major difference that could suggest any type of error (see comparisons in Annex B).
Running analyses with problematic loci can result in biased outputs. In order to prevent this from happening two sets of analyses were created, one with 11 loci (AS11), where the five possibly problematic loci were excluded and another set with all 16 loci (AS16). Both sets were analysed in parallel and in the end compared in order to check for any major difference, suggesting possible biased results. For some analyses, only AS11 was considered, whereas in others AS16 was used as well, as will be presented below.
Note that the names of the sampling sites were abbreviated with the following correspondence: BEK – Bekaraoka; SOL – Solaniampilana; BIN – Binara; ANTSK – Antsakay; AMBO – Ambohitsitondroina and BEN – Benanofy (see Annex A).
Table 2 - Genetic diversity per locus for each sampling site.
Site BEK SOL BIN
Locus NA Nº Indiv HE HO FIS Nº Indiv HE HO FIS Nº Indiv HE HO FIS C1P3 24 23 0.935 0.913 0.024 28 0.905 0.929 -0.026 24 0.810 0.792 0.023 Mm02 9 23 0.819 0.696 0.154 29 0.687 0.552 0.200 23 0.715 0.565 0.213 Mm03 8 23 0.800 0.696 0.133 29 0.823 0.862 -0.049 24 0.747 0.833 -0.119 Mm07 6 23 0.812 0.783 0.038 28 0.803 0.821 -0.023 24 0.750 0.667 0.113 Mm08 17 23 0.896 1.000 -0.119 29 0.884 0.931 -0.054 24 0.901 0.875 0.029 Mm21 13 20 0.844 0.750 0.114 17 0.738 0.706 0.045 17 0.809 0.412 0.499* Mm22 14 23 0.690 0.478 0.312* 29 0.849 0.621 0.273* 24 0.869 0.792 0.091 Mm26b 6 23 0.434 0.435 -0.002 28 0.138 0.143 -0.033 24 0.082 0.083 -0.011 Mm30 6 23 0.564 0.565 -0.002 28 0.642 0.429 0.337* 24 0.629 0.375 0.409* Mm39 13 23 0.895 0.957 -0.071 29 0.836 0.897 -0.074 24 0.725 0.708 0.024 Mm40 12 22 0.687 0.6812 0.008 29 0.759 0.759 0.000 23 0.808 0.739 0.087 Mm42 19 20 0.873 1.000 -0.150 29 0.837 0.759 0.095 23 0.707 0.783 -0.109 Mm43b 13 23 0.821 0.913 -0.115 29 0.578 0.517 0.107 24 0.747 0.792 -0.061 Mm51 3 23 0.608 0.609 -0.002 29 0.327 0.345 -0.055 24 0.265 0.292 -0.103 Mm58 13 23 0.810 0.870 -0.076 29 0.883 0.862 0.024 24 0.869 0.917 -0.056 MmF3 5 23 0.668 0.565 0.156 27 0.626 0.593 0.055 24 0.620 0.625 -0.009
Site ANTSK AMBO BEN
Locus NA Nº Indiv HE HO FIS Nº Indiv HE HO FIS Nº Indiv HE HO FIS C1P3 24 19 0.928 0.947 -0.022 10 0.911 0.900 0.012 10 0.8833 0.7500 0.160 Mm02 9 19 0.717 0.579 0.197 10 0.553 0.200 0.650* 8 0.767 0.500 0.364 Mm03 8 19 0.778 0.790 -0.015 10 0.668 0.800 -0.210 8 0.617 0.250 0.611 Mm07 6 19 0.791 0.790 0.002 10 0.726 0.700 0.038 10 0.7083 1.0000 -0.455* Mm08 17 19 0.903 0.947 -0.050 10 0.837 0.700 0.171 10 0.6500 0.5000 0.243 Mm21 13 17 0.838 0.706 0.162 10 0.884 0.900 -0.019 8 0.850 0.625 0.278 Mm22 14 19 0.863 0.474 0.458* 10 0.821 0.800 0.027 8 0.817 0.625 0.247 Mm26b 6 19 0.331 0.158 0.530* 10 0.337 0.400 -0.200 10 0.4417 0.3750 0.160 Mm30 6 19 0.630 0.579 0.083 10 0.653 0.600 0.085 8 0.775 0.750 0.034* Mm39 13 19 0.866 0.947 -0.096 10 0.811 0.900 -0.117 10 0.8583 0.8750 -0.021 Mm40 12 19 0.822 0.790 0.041 10 0.579 0.700 -0.223 10 0.9000 0.8750 0.030 Mm42 19 19 0.925 0.947 -0.025 10 0.874 1.000 -0.154 10 0.9250 1.0000 -0.087 Mm43b 13 19 0.788 0.632 0.203* 10 0.832 0.800 0.040 10 0.6167 0.6250 -0.014 Mm51 3 19 0.494 0.579 -0.179 10 0.268 0.300 -0.125 10 0.2333 0.2500 -0.077 Mm58 13 19 0.817 0.684 0.166 10 0.790 0.900 -0.149 8 0.8583 0.7500 0.134 MmF3 5 19 0.588 0.684 -0.170 10 0.621 0.400 0.368 10 0.6500 0.7500 -0.167
NA-Number of alleles per locus; Nº Indiv-number of individuals per locus used by Genetix 4.05.2 to calculate the genetic diversity parameters; HE -unbiased expected heterozygosity (Nei, 1978); HO -observed heterozygosity; FIS -intra-population fixation index (Weir and Cockerham, 1984). Significance of FIS was assessed with 10.000 permutations.* Values for which p<0.05.
3.2. Genetic diversity
AS11
The values for expected heterozygosity (HE) didn’t show a great variation, ranging from 0.662 for BIN
to 0.767 for BEK. Intra-population fixation (FIS) values ranged between -0.035 for BEK and 0.018 for
ANTSK, however a 10 000 permutation test showed that none of the FIS values were statistically
significant (Table 3).
The mean number of alleles ranged from 5.5 to 8.2 (Table 3), however a positive linear correlation was found between the MNA and sample size (R² = 0.7546). When AMBO and BEN (the populations with fewer individuals, 10 and 8 respectively) were excluded, no linear correlation was found (R² = 0.0315), hence only the other four patches were considered for this measure, where MNA values ranged from 7.1 for BIN and 8.2 for SOL (Table 3).
AS16
The expected heterozygosity was similar in all patches ranging from 0.691 for BIN to 0.760 for BEK. FIS values were particularly high for this set, ranging from 0.015 for AMBO to 0.097 to BEN. Statistical
significance was assessed with 10000 permutations. Values were significant for SOL, ANTSK and BEN (Table 3).
The mean number of alleles ranged from 5.6 to 7.6. As in the first set a linear regression was implemented and it showed that this values were linearly correlated to sample size (R² = 0.7712). Excluding AMBO and BEN, again, the linear correlation wasn’t detected (R² = 0.0006). Hence only the other four forest patches were considered for comparison with MNA for these ranging between 6.9 for BIN and 7.6 for SOL and for ANTSK (Table 3).
Table 3 - M. tavaratra's genetic diversity parameters for each site.
Analysis set AS11 AS16
Site Nº Indiv HE HO MNA FIS HE HO MNA FIS
BEK 23 0.767 0.793 7.7 -0.035 0.760 0.744 7.5 0.021 SOL 29 0.689 0.687 8.2 0.003 0.707 0.670 7.6 0.053* BIN 24 0.662 0.661 7.1 0.002 0.691 0.641 6.9 0.075* ANTSK 19 0.750 0.737 8.0 0.018 0.755 0.702 7.6 0.072* AMBO 10 0.690 0.700 5.5 -0.016 0.698 0.688 5.6 0.015 BEN 8 0.702 0.704 6.0 -0.003 0.722 0.656 5.7 0.097* HE-Nei's unbiased expected heterozygosity (Nei, 1978), Ho-observed heterozygosity, MNA-Mean nº
of alleles per site and FIS-intra-population fixation index (Weir and Cockerham, 1984). Significance of FIS was assessed with 10.000 permutations. *p-value<0.05
Pairwise Fst comparisons
Genetic differentiation between forest patches was measured by pairwise Fst comparisons.
AS11
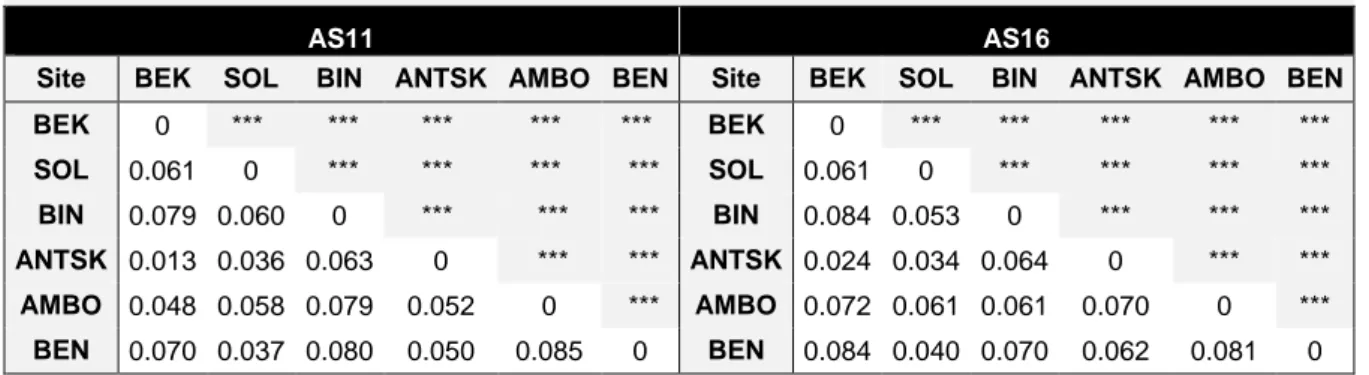
Values were significant between all sites and ranged from 0.013 to 0.085 with the average of 0.060. All pairwise Fst values are presented in the table below. Statistical significance was tested with 10 000 permutations and significance is shown in the diagonal axis of the table (Table 4).
AS16
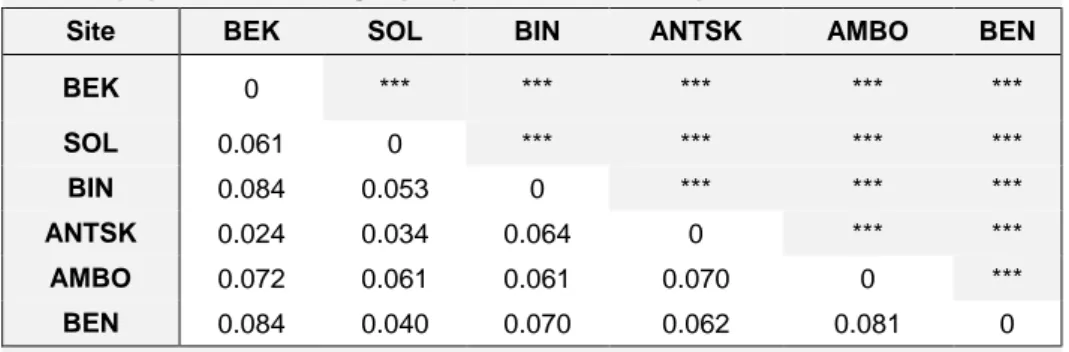
Here again all pairwise Fst values were significant and ranged from 0.024 to 0.084 with the average of 0.062. All pairwise Fst values are shown in the table below (Table 4). Significance was tested with 10 000 permutations and all values were statistically significant.
Table 4 - Estimated pairwise Fst value for all sites.
AS11 AS16
Site BEK SOL BIN ANTSK AMBO BEN Site BEK SOL BIN ANTSK AMBO BEN BEK 0 *** *** *** *** *** BEK 0 *** *** *** *** *** SOL 0.061 0 *** *** *** *** SOL 0.061 0 *** *** *** *** BIN 0.079 0.060 0 *** *** *** BIN 0.084 0.053 0 *** *** *** ANTSK 0.013 0.036 0.063 0 *** *** ANTSK 0.024 0.034 0.064 0 *** *** AMBO 0.048 0.058 0.079 0.052 0 *** AMBO 0.072 0.061 0.061 0.070 0 *** BEN 0.070 0.037 0.080 0.050 0.085 0 BEN 0.084 0.040 0.070 0.062 0.081 0 Fst calculated according to Weir and Cockerham (1984). *** p-value<0.05
3.3. Isolation by Distance
Isolation by distance was calculated based on individual genetic distances and individual sampling geographic distances.
AS11
Although statistically significant, a very week signal for isolation by distance was detected (R=0.172, p=0.000) (Fig.3).
AS16
As in the first Analysis set, a very week statistically significant signal for isolation by distance was detected (R=0.197, p=0.000) (Fig.3).
Fig.3- Isolation-by-distance using genetic and geographic, individual by individual distance matrices. AS11 - R= 0.1723 and p=0.000; AS16 - R=0.1968, p=0.000.
y = 0,0663x + 16,461 R² = 0,0297 0 5 10 15 20 25 30 0 5 10 15 20 25 30 35 40 GD GGD AS11 y = 0,1005x + 26,626 R² = 0,0387 0 5 10 15 20 25 30 35 40 45 0 5 10 15 20 25 30 35 40 GD GGD AS16
3.4. Structure
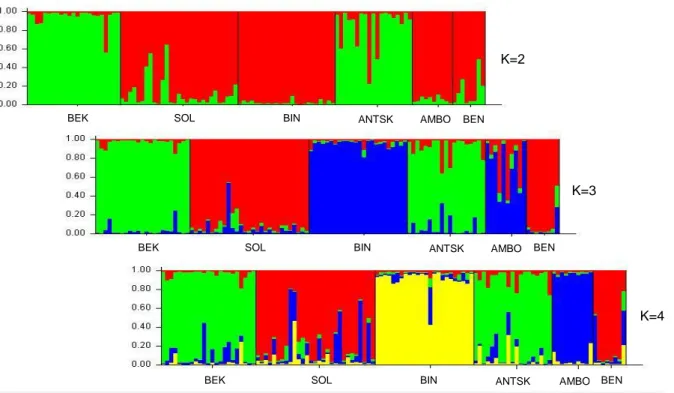
Applying the Bayesian approach in STRUCTURE 2.3.4 and Evanno ∆K method, the existence of 3 clusters was suggested for the two analysis sets since for both K=3 was associated to the highest ∆K value - (Evanno et al., 2005) (Fig.5 for AS11 and Fig.6 for AS16).
AS11
Cluster 1 consisted of individuals from BEK and ANTSK, but also included two females from AMBO; cluster 2 was composed of individuals from SOL and BEN, plus one female from ANTSK and two females from AMBO; and cluster 3 consisted of BIN elements but also included one female from AMBO and one male from SOL. AMBO individuals were thus distributed across the three clusters, with higher memberships in cluster 2 and 3, however this population only has 10 individuals, a sample size too small for this higher membership to be considered significant. As in Queméré et al., 2010, only individuals with a posterior probability (q) >0.06 were assigned to a cluster. This way, 9 individuals were not assigned to any of the three clusters (Tables 5 and 6).
AS16
Cluster 1 consisted mainly of individuals from BEK and ANTSK, with no individuals from other sampling sites assigned to it; cluster 2 consisted mainly of individuals from SOL and BEN with one female from AMBO; and cluster 3 consisted mainly of BIN and AMBO with no individuals from other sampling sites. Differing from the first set, here AMBO was fully attributed to cluster 3 whereas in AS11 it was distributed across the three clusters. A total of 6 individuals were left out for not showing a posterior probability higher than 0.6 (Tables 5 and 6).
Table 5- Proportion of membership of each population in the three clusters
suggested by STRUCTURE 2.3.4.
Analysis set AS11 AS16
Cluster Cluster Site Nº Indiv 1 2 3 1 2 3 BEK 23 0.901 0.056 0.044 0.936 0.035 0.029 SOL 29 0.070 0.854 0.076 0.034 0.910 0.055 BIN 24 0.041 0.047 0.912 0.018 0.027 0.956 ANTSK 19 0.819 0.124 0.058 0.858 0.084 0.059 AMBO 10 0.320 0.386 0.293 0.060 0.240 0.700 BEN 8 0.140 0.827 0.033 0.044 0.916 0.040 Fst - 0.037 0.036 0.085 0.045 0.038 0.067
Table 6- Total number and relative proportion of individuals of each site assigned to the
3 clusters.
AS11
Total nº of Individuals Relative proportion of individuals
Site Nº Indiv Clusters Not assigned Clusters Not assigned 1 2 3 1 2 3 BEK 23 23 - - 0 100.0 0 0 0 SOL 29 - 28 1 0 0 96.6 3.4 0 BIN 24 - - 23 1 0 0 95.8 4.2 ANTSK 19 16 1 - 2 84.2 5.3 0 10.5 AMBO 10 2 2 1 5 20.0 20.0 10.0 50.0 BEN 8 - 7 - 1 0 87.5 0 12.5 Total 113 41 38 25 9 - - - - AS16
Total nº of Individuals Relative proportion of individuals
Site Nº Indiv Clusters Not assigned Clusters Not assigned 1 2 3 1 2 3 BEK 23 23 - - 0 100 0 0 0 SOL 29 - 28 - 1 0 96.6 0 3.4 BIN 24 - - 24 0 0 0 100 0 ANTSK 19 17 - - 2 89.5 0 0 10,5 AMBO 10 - 1 7 2 0 10.0 70.0 20.0 BEN 8 - 7 - 1 0 87.5 0 12.5 Total 113 40 36 31 6 - - - - Nº Indiv-number of individuals sampled in each forest patch; Not assigned-individuals that were not assigned to any cluster with q>0.6 when K=3
Fig. 5- AS11 - STRUCTURE 2.3.4 Bar plot output for K=2; K=3 and K=4.
K=3 is the most probable number of clusters given that it is associated to the highest ∆K (Evanno et al., 2005). K=2
K=3
K=4
BEK SOL BIN ANTSK AMBO BEN
BEK SOL BIN ANTSK AMBO BEN
Evanno and colleagues have suggested that their method proposes the highest level of hierarchy so, after all individuals were assigned to one of the tree clusters the analysis was repeated for each cluster in order to check for further genetic structure. No substructure was found for any of the clusters in AS11 and AS16 (Evanno et al., 2005) (Fig.7 for AS11 and Fig.8 for AS16).
Fig. 7- AS11 - STRUCTURE 2.3.4 Bar plot output for cluster 1, 2 and 3 respectively when K=1 and K=2.
K=2 K=3 K=2 K=3 K=2 K=3 K=4
Fig. 6- AS16 - STRUCTURE 2.3.4 Bar plot output for K=2; K=3 and K=4.
K=3 is the most probable nº of clusters given that it is associated to the highest ∆K (Evanno et al., 2005).
BEK SOL BIN ANTSK AMBO BEN
BEK SOL BIN ANTSK AMBO BEN
AMOVA
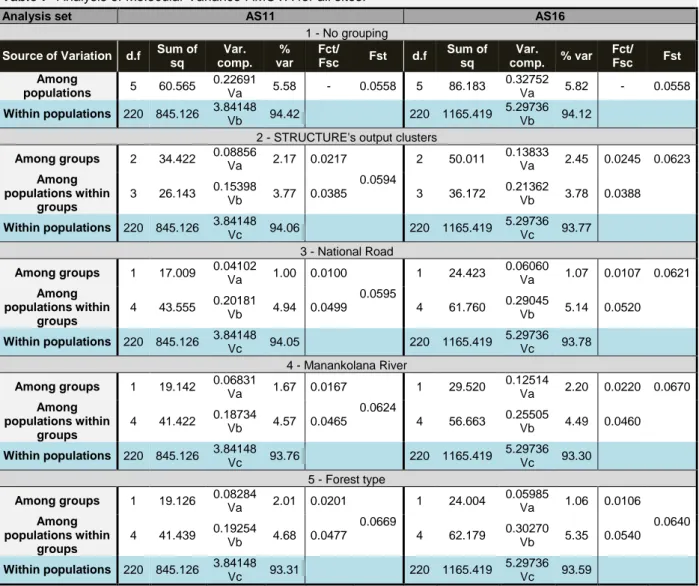
The AMOVA test is another useful tool to assess population differentiation. It allows the user to gather the populations in different groups which is useful to infer for any differentiation pattern. Five different approaches were implemented when running the AMOVA, this is, populations were grouped in five different ways, as follows: Test 1 - one group with all populations; Test 2 – three groups with two populations each as suggested by STRUCTURE 2.3.4 (Group1- BEK and ANTSK, Group2- SOL and BEN; Group3- AMBO and BIN); Test 3 - two groups considering the division made by the National road (Group1- BEK, ANTSK and BEN; Group2- SOL, BIN and AMBO); Test 4 - two groups considering the Manankolana river’s division (Group1- BEK and ANTSK; Group2- SOL, BIN, AMBO and BEN); Test 5 - two groups considering the type of habitat, i.e. dry forest vs humid forest (Group1- BIN-, Group2- SOL, AMBO, BEN, ANTSK and BEK) (Table 7).
AS11
The overall results from the AMOVA showed very little differentiation between populations given that for all tests the highest percentage of variation was attributed to “within populations”. The values ranged from 93.31% for test 5 to 94.42% for test 1. Nevertheless, Fst, Fsc and Fct fixation values showed that some differentiation exists. Fst values for the comparisons “Among groups” and “Among populations within groups” ranged from 0.056 for test 1 to 0.067 for test 5. The Fsc values for comparisons “Among populations within groups” ranged from 0.039 for test 2, to 0.050 for test 3. All Fst and Fsc values were statistically significant with p-value<0.0001 (significance assessed with 10 000 permutations). Finally, the Fct values for comparisons “Among groups” were the highest for test 2 with 0.022, and the lowest for the test 3 with 0.0100. However none of the Fct values was statistically significant. The overall results show a greater differentiation between populations when these are grouped in the three clusters suggested by STRUCTURE, confirming this pattern. The second strongest result for differentiation between groups was for test 5 which considered forest type as a differentiation factor. The Manankolana river came in third place and the National road in last (Table 7).
AS16
The overall results from the AMOVA showed very little differentiation between populations with the highest percentage of variation attributed to “within populations”. This percentage ranged from