BJRS
RADIATION SCIENCES
07-03B (2019) 01-06ISSN: 2319-0612 Accepted: 2019-06-17
Volume-dose indexes and dose prescription descriptive
review of radiosurgery planning
Piedade
aP.A., Radicchi
bL.A., Peixoto
cJ.G.P.
a Radioterapia São Sebastião, Florianópolis, Santa Catarina, Brazil, pedroargolopie@gmail.com, b Grupo RTCon, São Paulo, São Paulo, Brazil, lucas@gruportcon.com,
c Instituto de Radioproteção e Dosimetria - IRD, Rio de Janeiro, RJ, Brazil, guilherm@ird.gov.br
ABSTRACT
In Stereotactic radiosurgery (SRS), indexes are used to compare plans, comparing treatment techniques and evaluate clinical complications. However, they have some limitations and dependencies that need to be well known. Therefore, the analysis using indices is better suited for comparison of plans for the same patient (lesion). The evaluation of stereotactic plans must be undertaken with great care and criteria because there is a huge amount of information between different dose distributions of treatment plans. The objectives are to show some tools for planning analysis in SRS their limitations, some indexes descriptive review in the literature that seek to quantify the three properties mentioned and discuss the concepts involved in SRS dose prescription.
1. INTRODUCTION
Stereotaxic is the precise localization of a point in space through the use of images that are spatially related to the treatment plan with a high degree of accuracy. Stereotactic radiosurgery (SRS) uses stereotactic localization method for treating intracranial lesions with high-dose radiation in a single application. The healthy tissue or adjacent critical organ should be avoided. For this, the basic requirements are accurate localization, mechanical precision, optimal and accurate dose distribution and patient safety [1].
In conformal radiotherapy planning, the prescription isodose line should fit in the target volume (TV) periphery [2-7]. Planning and dose prescription for SRS should be optimized considering the rates dependencies of obliteration and radio-induced complications with the dose distribution, and high conformity. Therefore, two other properties are required: high dose gradient outside and distribution homogeneity of dose within the target volume. Therefore, the dosimetric analysis must be made within, and outside the periphery of the tumor.
The evaluation of stereotactic plans must be undertaken with great care and criteria because there is a huge amount of information between different dose distributions of treatment plans.
The objective is to do a descriptive review in the literature of the tools for planning analysis in SRS and their limitations, quantifying the three properties, that will be mentioned and discuss the concepts involved in SRS dose prescription.
2. TREATMENT TECHNIQUES
Historically, SRS with linear accelerators (LINAC) is considered less conformational than Gamma Knife (GK) [8]. Traditionally LINAC SRS was performed with circular collimators or cones and multiple static conformal arcs. With the introduction of micro-multileaf collimator (mMLC), new methods are being used, such as multiple dynamic conformal arcs and multiple static intensity modulated fields (IMRT), using a single isocenter treatments. With these techniques there was an improvement in dose conformity to the tumor and decreasement of irradiation in adjacent normal structures [9], similar to GK [10].
Choosing the best technique depends primarily on size, location and shape of the lesion and its relationship to critical brain structures, dose prescription and availability of the modality for the treatment planning system (TPS) calculations and the machine treatment delivery. There are several
studies comparing these treatment techniques in an attempt to propose the best technique for each situation, to optimize the conformity, and homogeneity of dose gradient [11-13].
3. EVALUATION OF SRS PLANS
The tools for evaluation of a treatment plan are the projection of isodose curves on axial, coronal and sagittal plane of Computed Tomography (CT), isodose surfaces, dose-volume histogram (DVH) and dose-volume indexes. Biological models such as tumor control probability (TCP) and the probability of normal tissue complication (NTCP) have been studied and implemented in some treatment planning systems, but there is great uncertainty associated with the parameters of these models. This makes the use of these models inappropriate for daily practice. In addition, these models currently require a large amount of input data [14-16].
3.1. Isodose Curves and Surfaces
A visual inspection of isodose curves superimposed on CT planning or isodose surfaces spatially rendered is a valuable tool for qualitative assessment of a plan because it allows to analyze each dose level in relation to the anatomy of the patient and provides comprehensive information of the spatial dose distribution. However, the accuracy depends on the dose matrix resolution and image resolution. Although this level of accuracy is within sub-millimeter, the uncertainty of a pixel in the position of the isodose can result in great uncertainty in the coverage of small intracranial lesions [17]. In addition, visual assessment is subjective.
3.2. Dose-Volume Histograms (DVH)
The dose and volume information can be summarized in the dose-volume histograms (DVH) for each structure outlined in the CT. The use of this tool is based on radiobiological concept that adverse effects of radiotherapy in the organs at risk are associated with the percentage of volume receiving a certain level of dose [18,19]. In addition, DVH provides the statistical distribution of dose, such as maximum dose, minimum dose, mean dose, median dose, mode dose, standard deviation of the dose distribution.
The disadvantages of using the DVH are loss of spatial information of the dose distribution, only outlined structures are analyzed (increasing the time and complexity of the delineation) and have a
lot of information condensed, making the analysis complex and imprecise when it has many treatment plans for be compared.
3.3. Indexes of dose-volume
The indices are numbers obtained from one or more parameters (which may be obtained from or through the DVH dose distribution) that try to summarize and quantify certain property of the treatment plan.
3.3.1 Conformality (periphery dose adjustment of the target):
There are many types of conformality indexes in the literature and a good summary is presented by Feuvret et. al. [20]. Among them, two stand out: PITV, first introduced conformality index [21], and Conformational Number (CN), firstly presented by van't Riet et. al. [22] and then applied to SRS by Paddick et. al. [23].
The RTOG first introduced the idea of quantifying the conformality and PITV2 and was defined
as:
(1) where PIV is the volume surface of the isodose prescription (PI) and TV is the target volume. Thus, an ideal conformation presents PITV = 1. The RTOG define criteria represented in Table 1, to evaluate the quality of planning at SRS. Figure 1 illustrates some parameters used in the definitions section of these indices.
2 The conformality index called “RTOG CI“ in the Iplan iPlan (Brainlab, Germany) actually is different from PITV as defined by RTOG, since
CI = 1+Vnormal/VPTV = PIV/PVTV ≠ PIV/TV! Both indexes present the same value if the minimum target dose is used to prescription (PVTV =
Table 1: RTOG protocol quality criteria.
No deviation Minor deviation Major Deviation
Conformality
(PITV – eq. 1 ) 1,0 ≤ PITV ≤ 2,0 Or 2,0 <PITV< 2,5 0,9 <PITV< 1,0 Or PITV ≥ 2,5 PITV ≤ 0,9 Inhomogeneity (MDPD – eq. 7 ) MDPD ≤ 2,0 2,0 <MDPD< 2,5 MDPD ≥ 2,5 Coverage (mPD/PD x 100% – eq. 10) mPD/PD ≥ 90% 80% ≤ mPD/PD< 90% MPD/PD< 80%
While the conformality index was first proposed by RTOG in 1993 and later described by the ICRU Report 62 in 1999, it has only been used most commonly in SRS. The main disadvantage of this index is not considering the spatial intersection between the prescription isodose and the target, requiring a well-established target coverage criterion (see Table 2). In addition, the amount of normal tissue (NT) irradiated by prescription isodose is not considered.
The PITV is an index of historical importance in radiosurgery, because many items have their values in a report series. However, an index that considers both target volume and irradiation of healthy tissue is the conformational number (CN), defined as:
(2) where PVTV is the target volume enclosed by the prescription isodose surface (Figure 1). The first ratio of the equation defines the coverage quality of the target; the second ratio considers the volume of healthy tissue receiving a dose greater than or equal to the prescription isodose. The value of CN varies between 0 and 1, and CN = 1 the optimal value. The CN value close to zero may indicate lack of conformality or large amount of normal tissue being irradiated by the prescription isodose. Therefore, although is a more general index, but still not an ideal index, because a value of CN may suggest any of the two arguments mentioned.
Since this index was introduced after the publication of RTOG 1993, there is no quality criteria defined by this publication. However, Lomax and Scheib [24] states that planning with CN ≥ 0.6 are considered to be conformational.
Although rarely used, another interesting index presented by Wu et. al. [25] is based on the measured distance of conformality, not dose-volume ratio. Most of conformality indices depend on the volume and shape of the lesion. In general, an increase of the target volume is correlated with an increase in conformality, but with increase in the absolute volume of normal tissue irradiated to the
prescription dose (PD)3 too. For small targets or irregular shapes, high values of these indices can
give a false impression of poor conformality. Lomax and Scheib [24] suggest that for TV <1cm3, the conformality index is not a good parameter for evaluating the plan, but the coverage of the target (see Table 2).
Figure 1: Relationship schematic of the target volume (TV) with the prescription isodose
volume (PIV). V%= volume of doses on the normalization point; PVTV = target volume encom-passed by the prescription isodose surface; NT = normal tissue.
Source: Paddick I. A simple scoring ratio to index the conformity of radiosurgical treatment plans. Technical note. J Neurosurg2000;93:219 –222
The conformality distance index (CDI) measures the average distance between the isodose prescription and target volume and is suitable for TV < 1 cm³ where the indexes mentioned above fail, because it is independent of the volume and shape of the lesion. It is defined mathematically as: (3) where SPIV and STV are the prescription isodose surfaces and the surface of the target volume areas, respectively. Note that the first subtraction the numerator represents the volume of normal tissue encompassed by the PI (over-coverage - dashed region in Figure 1), and second, the target volume that is not covered by PI (sub-coverage - dotted region in Figure 1).
Approaching the target surface and the PI for ellipsoids, and measuring the dimensions of TV and IP planes (axial, coronal and sagittal) of isocenter (major axis of each ellipsoid), we have that:
3 Prescription isodose (PI) e prescription dose (PD) are different nomenclatures for the same parameter. But, PI is given by relative
(4) where, b and c are the major axes and p ≈ 1.6 for scalene ellipsoid (a ≠ b ≠ c) [26]. It is worth noting that is recommended to report the three maximum dimensions of the target [21] and the maximum dimension in any plane was reported as a variable significantly associated with toxicity (p = 0.054) for the RTOG 90-05 [27].
Feuvret et. al. [20] in their review, concluded that there is no ideal conformality index, i.e., that one has 100% sensitivity and specificity. Therefore, conformality indices are important tools to compare plans when analyzed conformational specific criteria in addition to coverage of the target [20, 24].
3.3.2 GRADIENT (dose variation outside of the target):
The gradient or variation in dose outside the target volume can be characterized by the distance required to reduce the dose of the therapeutic (prescription) to a relatively low level (eg, half of the prescription) and it is an important aspect when conducting planning SRS because the volume of healthy brain receiving high doses is a factor associated with development of adverse effects. According to QUANTEC [28], the volume of brain receiving ≥ 12Gy has been correlated with the incidence of necrosis and asymptomaticsneuroradiologicals changes. For SRS, this publication suggests that <5-10cm3 of the brain receiving ≥ 12Gy. However, other authors suggest different predictors of dose / volume of the brain correlated with complications [29,30] and a fixed parameter is not yet established.
The Conformity/Gradient Index (CGI) were originally described by Bova et al. al. [31] and analyzed by Wagner et. al. [14]. CGI is composed of the average of two scores: CGIC, which represents the conformality, defined as (PITV)-1 x 100, and CGIg, which represents the gradient and is defined as:
(5) where Reff,50%Rx and Reff,Rx are the effective radius of the isodose surfaces of 50% of PI and of PI, respectively. Approaching the surfaces of spheres, we have that:
(6) where V%,Rx is the isodose volume on the percentage of PI, being easily obtained by DVH.
The CGIg is a score that takes values ≥ 100 for gradients of 3mm or less. This optimal gradient was obtained empirically from circular collimators SRS plannings and a loss of 10 points CGIg corresponds to an increase of 1mm in the gradient proposed [14]. For the authors' experience using cones, CGIg ≥ 90 are typically attainable for small lesions of simple geometry; 60 <CGIg<80, for larger lesions (multiple isocenters), for static fields and planning with IMRT. They concluded that CGI is relatively easy to obtain and correlates well the clinical examination and biological models (NTCP).
The RTOG no explicit criteria for variations in dose outside the target volume but have recommended to present levels of 100%, 90%, 80% and 50% of prescription dose [21]. Therefore, low dose levels outside the target volume are important parameters for further analysis and better definition of late effects in the brain region.
It is possible to classify the dose gradient as a case of ideal conformality, i.e. a gradient outside the target volume to zero (ideal) occurs when all levels of isodoses conform perfectly to the target volume, not just the prescription isodose. Leung et al. [32] proposed a graph of conformality indexes depending on isodose levels from 0-100% (Figure 2).
Figure 2: PITV (green curve) and CN (yellow curve) as a function of dose level relative to the
isocenter (point of normalization). This graph was calculated from the DVH of one patient treat in RSS as an example to illustrate the ideal situation (red line).
Source: The concept was adapted from Leung et al. [32].
The PITV curve (green) approaches infinity at low doses, making it useless for this analysis. The ideal value for this graph is shown in red (all values of IC unit). Therefore, as the graph of CN (yellow) provides useful information at all dose levels, the higher values of CN in all parts of the
graph associated with better planning. As CN also considers the target under dosage and over-dosing of healthy tissue, there may be exceptions in which the peak of the curve coincides with the prescription isodose line (80% isodose in this case).
3.3.3 INHOMOGENEITY (dose variation within the target):
The importance of dose conformality and sudden variations in dose at the periphery of the lesion is obvious. The dose inhomogeneity within the target volume can also be important because it may increase risk of complications, especially in lesions in which a structure is critical within the lesion, such as arteriovenous malformation and low-grade astrocytoma. But for most of the indications for radiosurgery, the lesion is composed of neoplastic cells and the need to have a mild dose heterogeneity is controversial because ablative doses are employed in the tumor and may possibly increase the efficiency against radioresistant hypoxic cells in this region [11].
Even for uniform doses within the target, the radiobiological effect of single high dose in normal tissue is much higher than in fractionated treatments. For example, in a treatment prescribed 20Gy in 80% curve encompassing the lesion, the tissue within the target receives a maximum dose which is radiobiologically equivalent to 70 and 200Gy of fractionated radiotherapy, depending on whether the tissue response is acute or late [11].
The influence of dose inhomogeneity within the tumor on local control and increased complications is not well understood yet and there are several conflicting reports in the literature. Nedzi et. al. [33] correlated increased complications with the high degree of dose inhomogeneity in treatments involving multiple isocenters with LINAC. The RTOG 90-05 [27] showed that patients treated with LINAC has 2.84 more chance of tumor progression risk compared with treatments in GK. One possible explanation is the high inherent inhomogeneity to the prescription dose in GK treatments.
However, other studies found no correlation between high dose inhomogeneity and the increased risk of complications or increase in tumor control [34,35]. In multivariate analysis conducted by Flickinger et. al. with arteriovenous malformation (AVM) [36] and acoustic neuroma [37] and by Blonigen et. al. [30] with metastasis, found that dose heterogeneity was not significantly correlated with complications. In general, it is believed that if a plan has a high degree of conformality, high dose concentrated within the target, the problem of dose inhomogeneity is not so relevant [14].
It is important to note that treatments performed with single isocenter LINAC allow greater homogeneity of the target dose than treatment with multiple isocenters and GK. The RTOG report [21] suggests that the degree of homogeneity in the lesion (see criteria in Table 1) be reported by ratio called MDPD:
3.3.4 Sigma Index for Dose Inhomogeneity
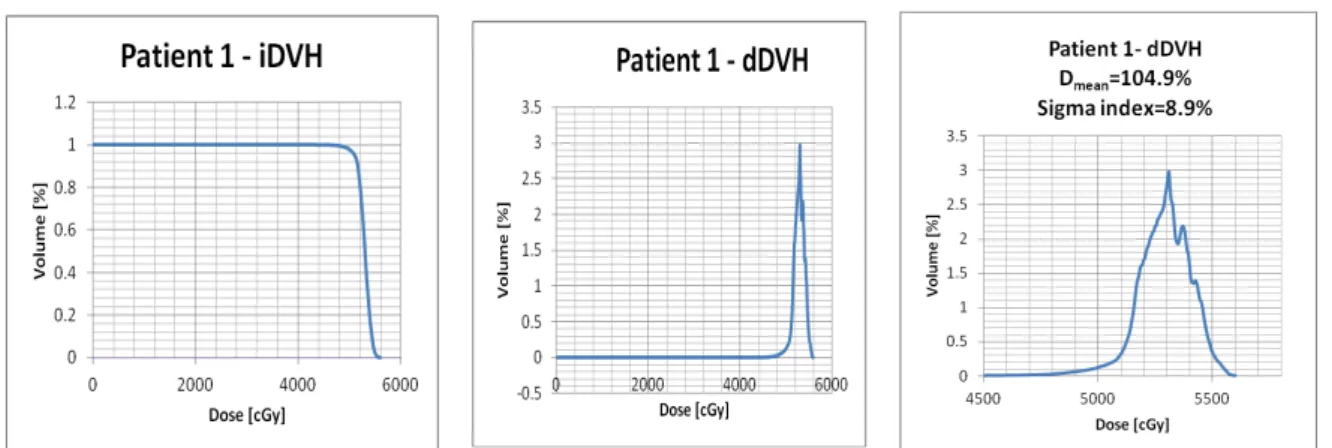
Yoon M et. Al. [45] developed based on statistical analyses of diferential DVH (dDVHs) a new index aimed to provide objective quantification of the dose homogeneity for the PTV. Differently from the integral DVH (iDVH), which consists of a plot of the volume of a structure being given at least a certain dose, the dDVH is a plot of the volume being given a dose within a specified dose range. The simplicity and friendly-usefulness of the iDVH has made it more routinely used. However, the dDVH provides information on how the dose varies within an anatomical structure. The Figure 3 shows iDVH and dDVH for a real patient, similarly to what Yoon M et al. [45] did in their paper to demonstrate the difference the information each type of histogram could display. Just with the analysis of the dDVH graphic, one may obtain the standard deviation that demonstrates the spread or dispersion of the average dose within an anatomical structure like the PTV, therefore reflecting the degree of inhomogeneity.
Figure 3: Dose-Volume Histograms in the region of the prescription dose. This graph was
calculated from the DVH of one patient treat in RSS as an example to illustrate one situation. It was chosen as an example of the smallest standard deviation of a set of treated patients with
Schwannoma vestibular.
Source: Data ploted in Excel from patient treat in RSS.
The sigma index, as it was named, quantifies the standard deviation of the doses about the mean dose.
(8) where Dmean is the mean dose to the target, Di is the dose to the ith bin having a volume vi, and V is the total volume of the target.
3.4. Dose calculation grid resolution
An important aspect that is often not considered in planning comparison is the value of the dose calculation grid, because the parameters of the indices previously mentioned and statistical values depend on the choice of this parameter.
The dose distribution is based on interpolation between doses calculated on an array of equally spaced points in the volume of interest. The grid size calculation that implies clinically acceptable uncertainties was studied by Niemierko and Goitein [38] which, considering errors of positioning and dose, with an analytical and experimental analysis, concluded that the maximum value grid should be 2.5 times the maximum acceptable positioning error (when this error is of the order of a few millimeters). For the case of SRS in general is that this error is 1 mm and thus the value of the dose calculation grid should be a maximum of 2.5 mm. In addition, the study shows that the largest error occurs in regions where the curvature of the dose profile is higher, i.e. at the higher dose range of the penumbra (10-30% and 70-90%).
It is important to remember that the choice of the calculation grid influence on the time spent by the planning system to calculate the dose distribution. Therefore, the planner must strike a balance between accuracy and computation time. Thus, some planning systems have the option to adapt the grid calculation for small structures. For example, the BrainLAB planning system, IPLAN, this option has adapted the grid and requires a minimum of 10 voxels and a grid of 1mm minimum for dose calculation in a structure [39]. The grid size for structure is determined by considering the smallest size (in voxels) of this structure. For example, consider a body that has the smallest size 8 voxels, the grid size calculation adapted to this structure is given by:
(9)
4. DOSE PRESCRIPTION
The way of dose prescription has a direct impact on the values of the indices mentioned above and, therefore, on the quality of the SRS planning. The idea is somewhat different from that used in fractionated conformal planning, because the effect of irradiation of a small part of the healthy brain tissue or other critical structures at dose levels commonly used in SRS may cause serious adverse effects.
The concept of conformality is closely related to the target volume coverage. The RTOG(21) suggested criteria for "coverage" of the target considering the percentage of prescription isodose that completely covers the lesion (see Table 1). Thus, "coverage" is defined as the ratio of the minimum dose point, or minimal peripheral dose (mPD), and the prescription dose (PD):
(10) Lomax et. al.(24) defines another index called Target Coverage (TC):
(11) Thus, coverage is defined as the percentage of the target receiving the prescribed dose, unlike the "coverage" defined by the RTOG. In the same publication, the author suggests that the purpose of planning is to achieve ≥ 95% TC, but this value can be violated, depending on the indication and target position.
A more general notation to symbolize the minimum dose (relative to the prescribed dose), D, received by a given volume, v, of any structure is outlined Dv. Thus, for example, TC ≥ 95% could be rewritten as follows: D95% ≥ 100%. The advantage of this notation is that it can be used to assess doses at different percentages of volume, both for target and organs at risk.
The ideal coverage is a controversial issue and several values can be found in the literature. For example, Hazard et. al. [10] proposes a methodology of prescribed dose at which the prescription isodose curve is the largest covering 95% of the tumor and delivers 95% of prescription dose in 99% of the target volume. The criteria can be summarized as follows: for the target volume, D95%≥100% and D99% ≥ 95%.
In conducting the prescribed dose not only coverage of the target and its conformality should be considered but also the dose gradient in the adjacent area of the lesion. The idea of SRS planning is to perform the prescription isodose curves with values between 70-90% relative to the isocenter dose [32] or the maximum dose on the target [14, 24]. The reason for that is the penumbra of the radiation fields are defined from these values and about and so can use the sharp drop off dose of intrinsic fields for optimizing the dose gradient at the periphery of the target (FIGURE 4).
FIGURE 4: Adjust margins collimation with zero margin (left) and margin of a few millimeters
(right) over the edge of the target volume.
Source: Image from phantom patient planned in RSS.
The Figure 6 illustrates two plans for a case of acoustic neuroma: the prescribing isodose of 90% (relative to the isocenter) and using 3mm leaf margins (top) over the edge of the target, and the prescribing isodose 80% (relative to the isocenter) and using 1mm leaf margin (bottom). The two plans have the same value of TC = 99% (see TV in the DVH curves in Figure 7), but it is easy to observe visually the highest dose gradient at the periphery of the second target in the planning, also decreasing irradiation of tissue normal (see NTV in DVH curves in Figure 7). It is worth noting that the dose inhomogeneity within the target is greater when using smaller leaf margins.
FIGURE 6: Dose distribution in the three planes to an anatomical design of acoustic neuroma
using 3mm leaf margins and PI = 90% (top) and using 1mm leaf margins and PI = 80% (bottom).
Axial view Sagital view Coronal
Axial view Sagital view Coronal view
Source: Image from phantom patient planned in RSS.
FIGURE 7: Dose-volume histogram comparison between the target volume (TV) and
nor-mal tissue volume
4.1. Criteria of SRS dose prescription used in Radioterapia São Sebastião
(RSS)
For cases of SRS, our dose prescription protocol is based on the three properties mentioned in the previous sections. The dose distributions are normalized at the isocenter. The prescription isodose value is fixed at 80% and the variables used in planning are number, shape, inputs and field margins for static fields or dynamic arcs. This methodology was also described by Hong and Garg [40]. The dose calculations are made with 2 mm grid and using the adaptation for small structures.
The objectives of the SRS planning for the target volume, with no "safety margin", are in the Table 2.
Table 2: Criteria of SRS dose prescription used in RSS. A. COVERAGE: D99% ≥ 100% of PI (80% isodose level)
B. MINIMUM TARGET DOSE (“coverage”, as defined by RTOG): MPD or D100% ≥
90% of PI (72% isodose level)
C. MAXIMUM TARGET DOSE (or MDPD): D0% ≤ 130% of PI (104% isodose level)
or MDPD ≤ 1,3
Criterion A is the attempt to deliver the prescribed dose in almost every lesion volume, assuming a small loss does not increase the dose to surrounding brain without losing significantly in TV coverage [10, 24, 41], criterion B is based on the same principle as the criterion A and the recommendations of the RTOG [21]; and the criterion C is based on the fact that plans to achieve more homogeneous with LINAC and the article of Hong and Garg [40], which concluded that the value of MDPD is correlated with better conformality of the target.
For healthy brain tissue, we seek to limit the dose so that it does not receive more than 12Gy in 10cm3 (D10cm3 ≤ 12Gy) [28]. The general recommendations may change depending on the shape, size and location of the lesion and the clinical indication, under the responsibility of the physician.
All indices cited in the previous sections are reported in all cases of SRS in order to develop future studies correlating these indices with other clinical and dosimetric parameters.
5. DISCUSSION
In SRS, indexes are used to compare plans, comparing treatment techniques and evaluate clinical complications. However, they have some limitations and dependencies that need to be well known. Therefore, the study of metrology of ionizing radiation could contribute to the improvement of SRS treatments using indices for comparison of plans for the same patient (lesion).
No index quoted considers the case in which a critical brain structure is very close or even adjacent to the target. Thus, deciding which property should be compromised, if necessary, to avoid the organ at risk must be made by the physician and the indexes can take unusual values.
Often, the high dose gradient and high conformality can be negative when the tumor is radiographically occult or inadvertently not delineated by not using appropriate imaging modality [42]. So it is important to bear in mind that one of the largest sources of uncertainty in the SRS process is the clinical definition of the target volume and its extension as defined by CT and/or MR images [43]. Thus, the treatment plan is very important and, despite the use of dose-volume indices are attractive, visual inspection to assess the dose distribution superimposed on the images becomes a primary tool.
Furthermore, analysis of the dose distribution in all slices is important to check dose levels in different regions of the brain, which may have different radiosensitivity and for different patients. For example, the supratentorial region is more radiosensitive for children [28].
There are studies [44] that attempted to correlate levels of conformality at risk for complications of radiosurgery but it was not possible, because although planning with large lesions are more conformal than with small lesions, the absolute volume of healthy brain irradiated with high doses to large targets is higher, increasing the risk of toxicity.
The whole discussion has been made based on cases with a single lesion. When the treatment plan involves two or more injuries to the same patient, should be careful to extract information from DVH because, as stated earlier, the spatial information is lost. Thus, alternatives to circumvent this problem are to carry out treatment plans so that the radiation fields of a lesion without interfering with the other lesion, allowing to inactivate other plans in the analysis of their injury, or create local structures accessory to the DVH analysis.
One aspect is little discussed in the literature the loss of biological efficacy of a prolonged application. Fowler et. al. (2004) suggests that fractions of treatment lasting more than 30 minutes have a significant effect of cell loss. Thus, especially in radiosurgery treatments that involve high doses in a single application, radiobiological this issue needs to be considered when optimizing a treatment plan.
6. CONCLUSIONS
The evaluation of SRS planning uses tools like 3D conformal planning, but with some different clinical and dosimetric considerations. Thus, some indices are proposed in the literature to help in the evaluation and comparison of different treatment plans. There is no ideal index to summarize all
the properties that must be analyzed in an SRS plan: conformality, homogeneity and gradient of dose.
Therefore, it is important to understand the information contained in the dose-volume indexes, which should be used in conjunction with other tools, such as visual analysis of curves and surfaces isodoses and DVH.
REFERENCES
[1] SCHELL, M. C. ; BOVA, F. J. ; LARSON D. A. Stereotactic Radiosurgery Report of Task Group 42 (Report No. 54). 1995.
[2] DEARNALEY D. P. ; KHOO V. S. ; NORMAN A. R. ; Comparison of radiation side-effects of conformal and conventional radiotherapy in prostate cancer: A randomised trial. Lancet
1999; 353:267–272.
[3] GIRAUD P. ; HELFRE S. ; LAVOLE A. Non-small-cell bronchial cancers: Improvement of survival probability by conformal radiotherapy. Cancer Radiother 2002;6:125s–134s.
[4] ARMSTRONG J. ; MCGIBNEY C. The impact of three-dimensional radiation on the treatment of non-small cell lung cancer. Radiother Oncol 2000;56:157–167.
[5] CORN B. W. ; HANKS G. E. ; SCHULTHEISS T. E. Conformal treatmentof prostate cancer with improved targeting: Superiorprostate-specific antigen response compared to standard treatment. Int J Radiat Oncol Biol Phys 1995;32:325–330.
[6] GIRAUD P. ; JAULERRY C. ; BRUNIN F. Upper aerodigestivetract cancers: Clinical benefits of conformal radiotherapy andintensity modulation. Cancer Radiother 2002;6:37s–
48s.
[7] HAYMAN J. A., MARTEL M. K., TEN HAKEN R. K. Dose escalationin non-small-cell lung cancer using three-dimensionalconformal radiation therapy: Update of a phase I trial. J
ClinOncol 2001;19:127–136.
[8] NAKAMURA J., VERHEY L. J., SMITH V. Dose conformity of gamma knife radiosurgery and risk factors for complications. Int J Radiat Oncol Biol Phys 2001;51:1313–1319.
[9] SOLBERG T., BOEDEKER K. L., FOGG R. Dynamic arc radiosurgery field shaping: A comparison with static field conformal and noncoplanar circular arcs. Int J Radiat Oncol Biol
Phys 2001; 49:1481–1491.
[10] HAZARD L., WANG B., SKIDMORE T. B., CHERN S., SALTER B. J., JENSEN R. L. AND SHRIEVE D. C., Conformity of linac-based stereotactic radiosurgery using dynamic conformal arcs and micro-multileaf collimator. Int J Radiat Oncol Biol Phys 2009;73(2):562-570
1995;5(3):175-191.
[12] HAMILTON R. J., KUCHNIR F. T., SWEENEY P. Comparison of static conformal field with multiple noncoplanar arc techniques for stereotactic radiosurgery or stereotactic radiotherapy. Int J Radiat Oncol Biol Phys 1995;33(5):1221-1228.
[13] CARDINALE R. M., BENEDICT S. H., WU Q. L. A comparison of three stereotactic radiotherapy techniques; ARCS vs. noncoplanar fixed fields vs. intensity modulation. Int J
Radiat Oncol Biol Phys 1998;42(2):431-436.
[14] WAGNER T.H., BOVA F.J., FRIEDMAN W.A. A simple and reliable índex for scoring rival stereotactic radiosurgery plans. Int J Radiat Oncol Biol Phys 2003;57(4):1141-1149
[15] BRENNER D. J. Dose, volume, and tumor-control predictions in radiotherapy. Int J
Radiat Oncol Biol Phys 1993;26:171–179.
[16] COLOMBO F., FRANCESCON P., CORA S. Evaluation of linear accelerator radiosurgical techniques using biophysical parameters (NTCP and TCP). Int J Radiat Oncol
Biol Phys 1995; 31:617– 628.
[17] KHAN FM. Treatment Planning in Radiation Oncology. 2nd ed. Philadelphia (PA):
Lippincott Williams and Wilkins; 2007. 204p.
[18] MARKS L. B., YORKE E. D., JACKSON A. Use of normal tissue complication probability models in the clinic. Int. J. Radiation Oncology Biol. Phys., 2010;76(Suppl. 3):S10–
S19.
[19] EMAMI B., LYMAN J., BROWN A. Tolerance of normal tissueto therapeutic irradiation. Int J Radiat Oncol Biol Phys 1991;21:109–122.
[20] FEUVRET L., NOEL G., MAZERON J. J. Conformity index: A review. Int J Radiat
Oncol Biol Phys 2006;64:333–342.
[21] SHAW E, KLINE R, GILLIN M. Radiation Therapy Oncology Group: Radiosurgery quality assurance guidelines. Int J Radiat Oncol Biol Phys 1993;27:1231–1239.
[22] VAN’T RIET A., MAK A. C., MOERLAND M. A. A conformation number to quantify the degree of conformality in brachytherapy and external beam irradiation: Application to the prostate. Int J Radiat Oncol Biol Phys 1997;37:731–736
[23] PADDICK I. A simple scoring ratio to index the conformity of radiosurgical treatment plans. Technical note. J Neurosurg2000;93:219 –222
[24] LOMAX N. J. AND SCHEIB S. G. Quantifying the degree of conformity in radiotherapy treatment planning. Int J Radiat Oncol Biol Phys 2003;55(5):1409-1419.
[25] JACKIE Q.R., WESSELA B.W., EINSTEIN D.B., MACIUNAS R.J., KIM E.Y. AND KINSELLA T. J. Quality of coverage: Conformity measures for stereotactic radiosurgery. J
Appl Clin Med Phys 2003;4(4):374-381
[26] F. W. J. OLVER, D. W. LOZIER, R. F. BOISVERT, AND C. W. CLARK, editors, 2010,
NIST Handbook of Mathematical Functions (Cambridge University Press).
primary brain tumors and brain metastases: final report of RTOG protocol 90-05. Int J Radiat
Oncol Biol Phys. 2000 May 1;47(2):291-8
[28] LAWRENCE Y. R., LI X. A., EL NAQA I. Radiation dose-volume effects in the brain.
Int. J. Radiation Oncology Biol. Phys., 2010;76(Suppl. 3):S20–S27.
[29] LEVEGRÜN S., HOF H., ESSIG M. Radiation-induced changes of brain tissue after radiosurgery in patients with arteriovenous malformations: correlation with dose distribution parameters. Int J Radiat Oncol Biol Phys 2004;59(3):796-808.
[30] BLONIGEN B. J., STEINMETZ R. D., LEVIN L. Irradiated Volume as a Predictor of Brain Radionecrosis After Linear Accelerator Stereotactic Radiosurgery. Int J Radiat Oncol
Biol Phys 2010;77(4):996-1001.
[31] BOVA F. J., MEEKS S. L., FRIEDMAN W. A. Stereotactic plan evaluation tool, the UF Index. Int J Radiat Oncol Biol Phys1999;45:188.
[32] LEUNG L. H. T., CHUA D. T. T., WU P.M. A new tool for dose conformity evaluation of radiosurgery treatment plans. Int J Radiat Oncol Biol Phys1999;45(1):233-241.
[33] NEDZI LA, KOOY H, ALEXANDER E, et. al. Variables associated with the development of complication from radiosurgery of intracranial tumors. Int J Radiat Oncol Biol
Phys 1991;21:591-599.
[34] LARSON D. A. ; GUTIN P. H. ; MCDERMOTT M. Multicenter trial update: Glioma, in 6th Annual Leksell Gamma Knife Society. Kyoto,Japan, 1994
[35] HORWITZ E. M.; MITRA R. K.; UZZO R. G.; DAS I. J.; PINOVER W. H. Impact of target volume coverage with Radiation Therapy Oncology Group (RTOG) 98-05 guidelines for transrectal ultrasound guided permanent Iodine-125 prostate implants. Radiother Oncol.
2003 Feb;66(2):173-9.
[36] FLICKINGERJC, LUNSFORD LD, LINSKEY ME, et al. Gamma knife radiosurgery for acoustic tumors: Multivariate analysis of four year results. RadiotherOnco 1993;127:91-98.
[37] MEHTA M. P. ; MASCIOPINTO J. ; ROZENTAL J. Stereotactic radiosurgery for glioblastoma multiforme: Report of a prospective study evaluating prognostic factors and analyzing longterm survival advantage. Int J Radiat Oncol Biol Phys 1994;30:541-549.
[38] NIEMIERKO A.; GOITEIN M. The influence of the size of the grid used for dose calculation on the accuracy os dose estimation. Med Phys 1989;16(2):239–247.
[39] Clinical User Guide Rev. 1.0, iPlan RT Dose Ver. 4.1 (2008).
[40] HONG L. X. ; GARG M. ; LASALA P. Experience of micromultileaf collimator linear accelerator based single fraction stereotactic radiosurgery: Tumor dose inomogeneity, conformity and dose fal off. Med Phys 2011;38(3):1230–1247.
[41] NEDZI L. A. ; KOOY H. M. ; ALEXANDER E. D. Dynamic field shaping for stereotactic radiosurgery: A modelling study. Int JRadiat Oncol Biol Phys 1993;25:859–869.
[42] ROOS D. E. ; BROPHY B. P. ; TAYLOR J. Lessons from a 17-year radiosurgery experience at the Royal Adelaide Hospital. Int J Radiat Oncol Biol Phys 2010;1-5.
[43] PALTA J. R. ; MACKIE T. R. Uncertainties in External Beam Radiation Therapy, WI,
Medical Physics Pub Corp.
[44] LOMAX N. J. ; SCHEIB S. G. Quantifyng the degree of conformity in radiosurgery treatment planning. Int. J. Radiat. Oncol. Biol. Phys., Vol. 55, 2003, pp. 1409-1419
[45] YOON M. ; PARK S.Y. ; SHIN D. A new homogeneity index based on statistical analysis of the dose-volume histogram. J Appl Clin Med Phys. 2007;8:9-17