Revista Livre de Sustentabilidade e Empreendedorismo, v. 5, n. 1, p. 212-231, jan-fev, 2020
MERGERS AND ACQUISITION1
Diego César Terra de Andrade2 ABSTRACT
Mergers and acquisitions are effective strategies for incorporation of complementary assets decreasing economic risk of losses in profit from innovation. We use Capital Asset Pricing Model (CAPM) to measure economic risk in a sample of big, open capital companies, listed in Sâo Paulo (Brazil) Stock Market (BOVESPA), pertaining to innovative segments of the economy, in the period 2009 to 2013, before and after the merger/acquisition. Results demonstrate that economic risk of acquiring companies did not decrease after merger or acquisition. Major conclusion implies that incorporation of complementary assets from merger/acquisition brings benefits if generating internal synergy towards increasing the ability to better position the innovation in the market.
Key-words: business innovation, complementary assets, merger and
acquisition.
RESUMO
Fusões e aquisições são estratégias eficazes para a incorporação de ativos complementares, diminuindo o risco econômico de perdas em lucro de inovação. Foi utilizado o Capital Asset Pricing Model (CAPM) para medir o risco econômico em uma amostra de grandes empresas de capital aberto, listadas em São Paulo (Brasil) Stock Market (BOVESPA), pertencentes a segmentos inovadores da economia, no período 2009-2013, antes e depois da fusão/aquisição. Os resultados demonstram que o risco econômico de empresas adquirentes não diminuiu após a fusão ou aquisição. As conclusões implicam que a incorporação de ativos complementares de fusão/aquisição traz benefícios se gerando sinergia interna no sentido de aumentar a capacidade de posicionar melhor a inovação no mercado.
Palavras-chave: inovação de negócios, ativos complementares, fusões e
aquisições.
1 Recebido em 15/03/2019. 2 [email protected]
Revista Livre de Sustentabilidade e Empreendedorismo, v. 5, n. 1, p. 212-231, jan-fev, 2020
INTRODUCTION
The belief that innovation leads necessarily to higher business profit is not correct, because nothing would guarantee a successful commercialization of innovation (Rodrigues et al., 2013; Teece, 2010; Teece, 1986; Williamson, 1992). Mergers and acquisitions are strategic advantages to complementary assets acquisition, because they allow reaching the latter quicker and in a safer way than developing assets internally, or accessing them through strategic alliances. Firms’ integration, through mergers and acquisitions, could be of vertical or horizontal nature. Horizontal integration refers to mergers and acquisitions among companies in the same market, in general, rivals. Resulting coupling targets at synergy generation, scale economy and competitive advantages that would leverage profit of the new company. Vertical integrations happen when mergers and acquisitions run between companies in distinct phases of the production chain in the same industry, aiming at production verticalization and making the company much more autonomous and independent.
In any case, integrations that strengthen the company with complementary assets reduce their exposure to opportunistic partners or commercial rivals. In addition, production verticalization, through mergers and acquisition, reduces firms’ market uncertainties. This happens because, when replacing market by internal organization, departments exchange much information and this kind of information happen to be more accurate and trustful than those gathered from commercial partners and suppliers (Helfat & Teece, 1987; Teece, Armour, & Saloner, 1981). Quality information flows constitute a major input to predict future events (Arrow, 1975; Teece et al., 1981).
Theoretically, while decreasing economic risk of the firm, determined by CAPM model (Capital Asset Pricing Model), the integration (vertical or horizontal) should reduce costs of fund raising and a firms’ total cost. A fall in
Revista Livre de Sustentabilidade e Empreendedorismo, v. 5, n. 1, p. 212-231, jan-fev, 2020 costs would be desirable, as it would guarantee greater leeway to firms establish its price policy. In this case, firms could adopt low price strategies implying many effects, such as, blocking the entrance of imitators to market, protecting both the control and the innovation profit capacity of the firm (Helfat & Teece, 1987).
Considering this scenario, in this work we apply the method used by Teece et al. (1981) in a sample of Brazilian companies listed in the Stock Market of Sâo Paulo and belonging to highly competitive market segments via innovation – IT, Telecom, Chemistry, Petrochemistry, Drugs and similar – that merged or acquired in the period ranging from 2000 to 2013. In this study, we try to answer the following research question: what would be main effects, resulting from mergers and acquisitions, on economic risk of Brazilian enterprises that run in innovative markets.
CAPM MODEL AND THE MEASURE OF ECONOMIC RISK TO THE FIRM
In finances field, the concept of economic risk refers to the possibility of occurrence of variations in returns from a specific investment (Woiler and Mathias, 1996). Therefore, as bigger it is the returns’ variance, relatively to its expected value, as bigger it will be the investment risk (Ross, Westerfield and Jaffe, 2002). Economic risk of a company’s business can be reduced through diversification of projects portfolio or products. The reason is because of distinct projects do not move within the market in the same direction, that is, do not hold the same market reaction. Therefore, they could show positive as well as negative returns. So, diversifying portfolio may assure an average positive return from market, by compensating positive and negative variances and eliminating a parcel of the total economic risk. This process is called “diversified risk” (Assaf Neto and Lima, 2011). The same rationale is applicable to market shares portfolio. Diversifying the portfolio of shares will decrease the degree of
Revista Livre de Sustentabilidade e Empreendedorismo, v. 5, n. 1, p. 212-231, jan-fev, 2020 variability on the total return of the investment, and so decreasing the level of economic risk.
The variance of returns to which a diversified company’s portfolio is exposed to a set of factors that make returns from all projects or product to move in the same direction, that is, to undergo the same stimulating or discouraging factors. These are of macro or meso economic order factors and may affect the economy in the national, or in the sectorial level as a whole. These risks are inherent to the economic context of the business (macro and meso economic order), they can not be eliminated through the diversification of the company’s portfolio strategy and are called systemic risk (Assaf Neto and Lima, 2011; Ross et al. 2002). CAPM model, from Sharpe (1964), Lintner (1965) and Mossin (1966), considers that investors are rational individuals, who diversify their portfolio of project/products (or shares) to a such level that only the systemic risk becomes relevant (Samanez, 2009; Teece et al., 1981), that is, the risk literally is out of the investor hands. The subjacent idea to the CAPM model is that the return of an asset with risk be equal to the rate free risk, plus a premium to its holder regarding the economic risk. In short: Return = rate free risk + premium for the risk
The model can be expressed mathematically as: (1).
Where:
= return rate of Asset i;
= Return rate of Assets rate free risk ( In Brazil, SELIC index)
= Profitability rate of a portfolio of shares highly diversified, representing the country economy (In Brazil, BOVESPA index);
= Market premium risk, meaning the difference between the yield of the market portfolio (stock market = Bovespa index) and the rate free risk (Selic index);
Revista Livre de Sustentabilidade e Empreendedorismo, v. 5, n. 1, p. 212-231, jan-fev, 2020 Level of sensitivity of the Asset i to the market premium risk.
Statistically. Beta of an asset is calculated as a covariance of assets returns and market profitability ( divided by market variance ( . It is represented by the following equation (Ross et al., 2002; Samanez, 2009)
Covariance ( is a combined measure of variance between returns of assets and Market profitability. Risky assets, whose returns oscilation is higher than market portfolio stock (Bovespa index) hold , giving betas greater than 1. The reciprocal is also true, since less risky assets, show less ethereal returns than the market portfolio stock, show , giving betas smaller than 1. Therefore, the greater the beta is, the greater will be the level of risk of the asset. In addition, besides to inform the risk level of the investment, beta coefficient demonstrates the sensitivity of returns of an asset to the market premium risk (Assaf Neto and Lima, 2011; Samanez, 2009). In the case of a highly risky asset, showing a 1.8 beta value, for instance, when market premium risk increases 5%, we may expect an increase in the return of the asset around 9% (1.8 x 5%). If market premium risk falls 5%, on the other hand, we may accordingly expect its reward will fall 9% (Samanez, 2009).
Although, apparently the CAPM is a simple model, expressing mechanically the relationship between returns of an asset and the associated market premium risk, the model scope is far more ampler (Helfat & Teece, 1987; Rosenberg & Guy, 1975; Teece et al., 1981). Market premium risk, that is, the difference between yield of stock market and the free risk rate originates in the expectations of investors upon macroeconomic variables, such as: inflation, interest rates, exchange and National Gross Income growth rates. In addition, meso-economic and sociopolitical variables, such as: international
Revista Livre de Sustentabilidade e Empreendedorismo, v. 5, n. 1, p. 212-231, jan-fev, 2020 commodities price, petroleum prices, electrical energy, political cycle, domestic and international conflicts, etc. must be taken in to account (Rosenberg & Guy, 1975; Sharpe, 1964). All these factors concur to market uncertainties ( swing) and it is possible to anticipate the effect of each one of them on future returns and on behavior of any share or specific project.
Let us consider, for instance, a petroleum equity fund. Petroleum shock coming from abrupt decreases in the offer of the oil will reflect proportionally higher demand. At the same time, events related to inflation will have proportionally lower effect on returns from this fund, as compared to swings in economy as a whole. In other words, fluctuations in returns from this fund, in response to an oil shock, will probably be higher than fluctuations caused by macroeconomic and sociopolitical factors. Additionally, these factors would cause fluctuations in return from this fund more intense than those that inflation would. Therefore, before the forecasting of an oil crisis, estimation for this fund should be higher than the estimation before forecasting of increases in the inflation (Helfat & Teece, 1987; Rosenberg & Guy, 1975; Teece et al., 1981). One can notice, from this example, that three distinct parameters determine the level of systemic risk ( ):
a) The response coefficient of share j to the event i, which means the contribution to the event i to variance in returns of the share (represented by
b) The contribution of the event i to market variance (represented by ); and
c) The probability of occurrence of event i (represented by ).
Since and represent, respectively, measures of the share and market variances, then means the combined variance, or covariance between the returns of the share and of the market. The result of
Revista Livre de Sustentabilidade e Empreendedorismo, v. 5, n. 1, p. 212-231, jan-fev, 2020 means the expected covariance measured between the returns of the share and of the market. Therefore, we can rewrite the traditional beta equation:
as follows: , according (Rosenberg &
Guy, 1975).
Mergers and acquisitions supplementing inexistent complementary assets to a company, help increase the competitive capacity of the company, adding up to the appropriation of profits from innovations and decreasing the risk of rival’s appropriation. Besides, complementary assets make a company less dependent on commercial partners who cooperate in sales of innovation, but compete for profit (Teece, 1986, 2006, 2013). The company then can protect herself from opportunistic attitudes such as demands, before antagonistic market contexts, to renegotiate commercial contracts (Teece, 1986, 2006, 2013). In addition, in cases of vertical integration, the flow of information before exchanged straight with market begins to be replaced by intra-depatment communications, turning then information more complete, precise and trustful (Helfat& Teece, 1987). The quality of information will assure to the company higher levels of forecasting on future events and be prepared against adverse effects, decrease bad fluctuation effects on economic returns from investments (Helfat & Teece, 1987; Teece et al., 1981). Because of the ability to make available complementary assets and improve the company capacity to forecast future events, mergers and acquisitions are useful tools to protect companies against bad economic events that would reflect negative swings on profits and on shares return. In terms of the mathematical model of Rosenberg and Guy (1975), this fact is represented by a decrease in the company’s response coefficient to the event i (represented by . Being all things constant, mergers and acquisitions lower the and decrease the beta coefficient.
Revista Livre de Sustentabilidade e Empreendedorismo, v. 5, n. 1, p. 212-231, jan-fev, 2020
METHOD AND RESULTS
Directly calculating the beta coefficient, before and after merger and acquisitions, becomes an inefficient measuring methodology to assure the economic risk variation of a company. The reason remains in the dynamic nature of the economy and the ever-changing market conditions. In terms of Rosenberg and Guy (1975) model, ), even if merger or acquisition help incorporate vertical integration, lowering the response coefficient ( ) of a company, the beta of the company will remain unchanged or could even increase, obliterating the real effect of the integration over the company’s systemic risk. The same is true if new market economic conditions induce variances in the market return ( ) to lower, at the same rate and direction, or above proportionality. To solve this problem, Teece et al. (1981) propose the following method:
a) Select pairs of companies (A – acquirer); (B – acquired).
b) To each one pair, select a pair of companies that did not undergo merger or acquisition, to integrate a control group.
c) All the researched companies should be open capital operating in the investment financial market – Stock Market – of São Paulo (BOVESPA). Pairs of companies similar to I, are called “control companies”.
d) Beta estimation is calculated using Minimum Ordinary Square, through SPSS statistical software, observing the following relationship (Helfat and Teece, 1987):
Where: represents the return rate of the company’s share j in date t; represents the return rate of BOVESPA index, in the period t; and represents the stochastic disturbance of the model.
Revista Livre de Sustentabilidade e Empreendedorismo, v. 5, n. 1, p. 212-231, jan-fev, 2020 e) The risk coefficients (betas) expected for the acquiring and acquired companies before merger or acquisition take place, are estimated by means of the return on shares in the 6 months before the event. The average of betas, pondered by total asset, generates a measure called , that represents the average of the risk, estimated for companies from item I, before merger/acquisition. is represented by the following formula:
, where: represent the coefficient of risk estimated by
pair of companies merged/acquired and represent the value of the companies’ assets in item I, proportionally to the total asset of the resulting company of the merger/acquisition.
f) The risk coefficient of the resulting company, after merger/acquisition, comes represented by and is calculated using data from daily return of market shares, in a period of 6 months after merger/acquisition.
g) Betas of the control companies, in the period before merger/acquisition, are estimated from return of market shares in the period before the event (merger/acquisition).
h) After merger/acquisition, we estimate the risk coefficient of control companies from their market share daily return during the period of 6 months after integration.
i) To calculate the effect of complementary assets integration from merger/acquisition on the company’s economic risk we use the following equation:
, where:
D = decrease of economic risk of the company;
= pondered average of risk coefficient of companies that undergo merger/acquisition, before the event.
Revista Livre de Sustentabilidade e Empreendedorismo, v. 5, n. 1, p. 212-231, jan-fev, 2020 = estimated risk coefficient of the resulting company from merger/acquisition, after the event.
= risk coefficient presumable for control companies before merger/acquisition.
= risk coefficient calculated for control companies during the period after the event (merger/acquisition).
The research objective is to check the hypothesis that D becomes greater than zero with a merger/acquisition. D should be bigger than zero (D > 0) because if the economic risk falls, caused by merger/acquisition, it means that the effect of the event left a company less risky, more consolidated and with positive implications from the integration of complementary assets. As expected, the estimate of the company should be greater than the , generating a positive number in the subtraction: .
In addition, any variation of the systemic risk experienced by the group of control companies, generating positive or negative values in the subtraction should come from fluctuations in market conditions. These fluctuations do have an implication on the swing of company’s economic risk which undergo vertical merger/acquisition and whose effect should be eliminated, in order to isolate the effect of merger/acquisition on the company’s systemic risk. In this sense, variable D represents a measure of the company’s systemic risk reduction, due to merger/acquisition, out of any other effect. The hypothesis D>0 expresses the expectative that the effect solely from merger/acquisitions on the fall of the company’s systemic risk be positive.
Therefore, we can formulate the research hypothesis on the following premises:
Revista Livre de Sustentabilidade e Empreendedorismo, v. 5, n. 1, p. 212-231, jan-fev, 2020 With D null (H0: D = 0), there is no implications from integration of complementary assets in merger/acquisition to the resulting company. For D bigger than zero (HA: D > 0), there is, presumably, a positive influence from the integration of complementary assets on the resulting company (after merger/acquisition). We test the hypothesis using Wilcoxon Matched Pairs Signed Ranks (WMP) test. This nonparametric test does not require normal distribution of the population. It compares the risk of companies after merger/acquisition ( ) with decreasing of the economic risk of control companies ( ) targeting at evaluating significant statistical differences in the results. The null hypothesis means there is no significant statistical difference among the two expressions, that is:
=
If null hypothesis cannot be refused, then: =0
Therefore, in terms of population, mergers and acquisitions do not cause decrease in economic risk of companies. WMP test allows one to calculate the value of statistic W, that should be then compared with the critical values of a statistical table, to do the hypothesis test (Siegel, 1956). In case of HO rejection, WMP test allows also to calculate, through ranking, which difference is the bigger. In other words, if in population level, the decrease of the economic risk of participating companies in merger/acquisitions implies D > 0 (risk decreasing), or on the contrary, implying D < 0 (risk increasing).Table 1 shows the selected companies that made merger or acquisition during the considered period.
Revista Livre de Sustentabilidade e Empreendedorismo, v. 5, n. 1, p. 212-231, jan-fev, 2020
Table 1 – Sample of Companies under item I with Respective Total Asset
Source:Securities Value Comission(CVM), 2015.
Integration
Nr. Company Total Asset Canvass Date Total Asset Integration Year of 1
Cia Cervejaria Brahma
S.A. R$ 4.447.523,00 31/12/1999 2000
Cia Antarctica Paulista
S.A. R$ 2.175.157,00 31/12/1998
2 Sadia S.A. R$ 12.558.144,00 31/12/2008 2009 Perdigão S.A. R$ 6.403.008,00 31/12/2008
3 Braskem S.A. Quattor Petroquímica R$ 21.551.933,00 31/12/2009 2010 S.A. R$ 2.237.050,00 31/12/2009
4
Gol Linhas Aéreas
Inteligentes S.A. R$ 2.504.178,00 31/12/2007 2008 Varig Participações em
Transportes S.A. R$ 56.883,00 31/12/2005*
5 Votorantim S.A. R$ 12.797.764,00 31/12/2008 2009 Aracruz Celulose S.A. R$ 10.333.968,00 31/12/2008
6 Telefonica Brasil S.A. R$ 19.600.980,00 31/12/2010* 2012 Vivo Participações S.A. R$ 13.584.577,00 31/12/2010*
7 PDG Realty S.A. Empreend e Participações R$ 3.836.437,00 31/12/2009 2010 Agre Empreendimentos Imobiliários S.A. R$ 1.848.747,00 31/12/2009
Revista Livre de Sustentabilidade e Empreendedorismo, v. 5, n. 1, p. 212-231, jan-fev, 2020
Table 2 – ControlGroupCompanies
Source: Future Stock Market (BMF)/ BOVESPA, 2015.
RESULTS AND DISCUSSION
To reach the objectives of this research we first calculate the betas for both groups of companies, the ones that made merger or acquisition and the control group companies. Then we calculate risk reduction comparatively to check the hypothesis HO and HA. Next set of tables refer to these calculation. Integration Nr. Company Sector Classification by BOVESPA
1 Lojas Americanas Retail
2 JBS S.A. Non ciclic consume /Industrialized Food / Meat and Related
3 MG Poliester S.A. Basic Materials / Chemicals /Petrochemicals 4 Tam - Transportes Aéreos Regionais Transport/ Air Transport 5 Celulose Irani S.A. Basic Materials / Wood and Paper / PaperandCelulose
6 Inepar Telecomunicações S.A. Telecommunications / Mobile Telecom
7 João Fortes Engenharia S.A. Construction and Transport / Construction and Engineering / Building
Revista Livre de Sustentabilidade e Empreendedorismo, v. 5, n. 1, p. 212-231, jan-fev, 2020
Table 3 – Betas Estimationof Companies Participating on Mergers and Acquisitions
Companies with Mergers or Acquisitions Estimated Beta Test t p value. Statistical Significanc eof Beta Teste Z p valueStatistic al Global Significanceo f the model R SquareAdjust ed Antarctica 0,311 1,045 0,002 10,011 0,002 0,057 Brahma 0,295 4,42 0,000 19,53 0,000 0,072 Ambev 0,352 6,719 0,000 45,14 0,000 0,013 Sadia 0,197 5,403 0,000 29,193 0,000 0,024 Perdigão 0,408 7,214 0,000 52,039 0,000 0,045 Brasil Foods 0,375 6,881 0,000 47,345 0,000 0,040 Brasken -0,382 -3,731 0,000 13,918 0,000 0,009 Quattor 0,213 6,817 0,000 46,47 0,000 0,024 BraskenPos Aquisição 0,466 8,872 0,000 78,719 0 0,089 Gol 0,417 8,83 0,000 77,99 0 0,069 Varig 0,306 4,985 0,000 24,85 0 0,011
Gol Pos Aquisição 0,690 18,06 0,000 326,130 0 0,185 Votorantim Celulose 0,486 12,394 0,000 153,610 0 0,060 Aracruz Celulose 0,223 3,311 0,001 10,965 0,001 0,010 Fibria Celulose 0,766 19,22 0,000 369,59 0,000 0,246 Telefonica 0,229 7,43 0,000 55,196 0,000 0,058 Vivo 0,483 7,342 0,000 53,9 0,000 0,04805 Vivo 0,255 7,378 ,000 54,434 0 0,074 Pdg 0,806 13,171 0,000 173,478 0,00000 0,173 Agre 1,093 1,093 0,000 33,274 0,00000 0,290 Pdg Reality 1,147 15,682 ,000 245,936 0 0,197
Revista Livre de Sustentabilidade e Empreendedorismo, v. 5, n. 1, p. 212-231, jan-fev, 2020
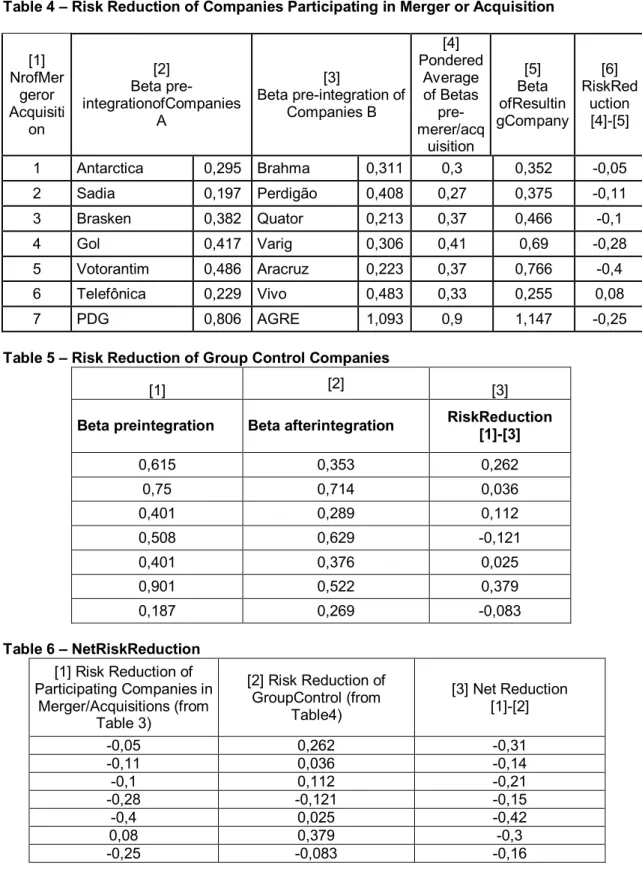
Table 4 – Risk Reduction of Companies Participating in Merger or Acquisition
[1] NrofMer geror Acquisiti on [2] Beta pre- integrationofCompanies A [3] Beta pre-integration of Companies B [4] Pondered Average of Betas pre- merer/acq uisition [5] Beta ofResultin gCompany [6] RiskRed uction [4]-[5] 1 Antarctica 0,295 Brahma 0,311 0,3 0,352 -0,05 2 Sadia 0,197 Perdigão 0,408 0,27 0,375 -0,11 3 Brasken 0,382 Quator 0,213 0,37 0,466 -0,1 4 Gol 0,417 Varig 0,306 0,41 0,69 -0,28 5 Votorantim 0,486 Aracruz 0,223 0,37 0,766 -0,4 6 Telefônica 0,229 Vivo 0,483 0,33 0,255 0,08 7 PDG 0,806 AGRE 1,093 0,9 1,147 -0,25
Table 5 – Risk Reduction of Group Control Companies
Table 6 – NetRiskReduction
[1] [2] [3]
Beta preintegration Beta afterintegration RiskReduction [1]-[3]
0,615 0,353 0,262 0,75 0,714 0,036 0,401 0,289 0,112 0,508 0,629 -0,121 0,401 0,376 0,025 0,901 0,522 0,379 0,187 0,269 -0,083 [1] Risk Reduction of Participating Companies in Merger/Acquisitions (from Table 3) [2] Risk Reduction of GroupControl (from Table4) [3] Net Reduction [1]-[2] -0,05 0,262 -0,31 -0,11 0,036 -0,14 -0,1 0,112 -0,21 -0,28 -0,121 -0,15 -0,4 0,025 -0,42 0,08 0,379 -0,3 -0,25 -0,083 -0,16
Revista Livre de Sustentabilidade e Empreendedorismo, v. 5, n. 1, p. 212-231, jan-fev, 2020 We did the Wilcoxon test from data in columns 1 and 2 of Table 6. Considering 0,05 significance level, the null hypothesis must be refused, based on the existence of differences statistically significant between the variation of economic risk of companies under merger/acquisition and the variation of control group companies. Additionally, the sum of negative ranks reaches 28, while the sum of positive ranks is 0. Therefore, statistically, D is negative. This result denies our central hypothesis that mergers and/or acquisitions support a decrease in the economic risk of enterprises. If D < 0, as results are pointing to, then merger and/acquisition should promote a negative decrease, that is, an increase in the economic risk.
In despite of small, the sample size cannot be blamed for the results, since the test WMP is effective, even with samples under 10 elements (Helfat & Teece, 1987). The group control companies, on the other hand, may be responsible for some bias in the results. Ideally, the group control companies should be as much as similar as possible to the participating companies under merger/acquisition, in such way that market behavior (variations) should affect both groups in the same way or intensity. Each company of the group control should be from the same industrial field and hold approximately the same amount of assets than the corresponding company in the participating companies under merger/acquisition. These similarities, however, were not possible to keep to all companies. There were not much coincidence of companies in both groups complying with the restrictive requisites and a relatively small amount of companies listed in the BOVESPA (stock market) induced us to adapt elements of the pairs. For instance, we have to use a general retail company (Lojas Americanas) in the control group companies for a pair of beer makers (Brahma and Antarctica), which despite being close, is still not the ideal representative.
Revista Livre de Sustentabilidade e Empreendedorismo, v. 5, n. 1, p. 212-231, jan-fev, 2020 In spite of hurdles for a perfect compliance of the research methodology, such typical results, showing negative net reduction (increase in risk) to all seven merger/acquisition cases studied, brings out the possible issue of a systemic component undermining the expected results and, therefore, a door for a plausible explanation of the phenomenon.
The analysis of Table 3 may suggest some hints. Numbers in this table, show that before merger/acquisition, the economic risk of participating companies is low. All betas hold values lower than 1 demonstrating that variation in the economic surroundings, would imply variations less than proportional on returns from these companies. Furthermore, the low value of R2, shown in the last column of Table 3, implies that economic variations of market conditions explains a very small amount of variance on economic returns from these companies.
These two conditions, added to the significant volume of assets held by selected companies in Table 1, support the hypothesis that the studied companies in this research, already had, before merger/acquisition, accurate information on economic risks that allowed them to formulate more efficient strategies contingent to the distinct scenarios they were involved, minimizing the fluctuation of economic returns. These same conditions allow us to hypothesize that these companies were already holders of complementary assets. Such assets, sufficiently consolidated, would guarantee an effective market positioning for their innovations. They would also keep them safe from opportunistic maneuvers from commercial partners (they themselves complementary asset holders), who collaborate with the commercialization of innovations of the company, but would compete for profit appropriation (Teece, 1986 e 2013). So merger/acquisitions would have little to add in terms of risk reduction.
Revista Livre de Sustentabilidade e Empreendedorismo, v. 5, n. 1, p. 212-231, jan-fev, 2020 Lev and Mendelker (1972) conducted research on the effect of merger/acquisitions of companies’ economic risk. They concluded that among the main reasons for merger is the whish for the growth of the company, for increases in market share and for the business return rate. They notice also that a great deal of merger and acquisitions are supported by third party capital investment, on the premises of the acquiring company’s expenses. This process of financial leveraging allow for the company’s fast growth, but it increases the estimation of economic risk ( ) measured through CAPM model. This happens because when the parcel of debt increases within the capital structure of the company, returns on shares tend to become more volatile (Modigliani & Miller, 1958). In this way, complementary assets brought by the acquired company, do not put significant pressure on economic risk to fall. At the same time, financial leveraging would exert strong pressure to go up, resulting in increases of the companies’ economic risk.
FINAL REMARKS
As the results of this research show, the effect of mergers/acquisitions on the economic risk of companies set in Brazil, is about the same as Lev and Mendelker (1972) found. While studying the same relationship, the authors found in companies set in other countries that mergers and acquisitions do not produce a clear directional effect on the level of economic risk in companies, measured through CAPM model.
Results of our statistical study indicate that mergers/acquisitions tend to increase the level of economic risk of companies. However, all sampled companies are big companies, so statistics laws do not allow us to generalize results including medium and small size companies. The logic in this argument indicates that mergers/acquisitions among medium and small size companies, incorporate complementary assets to the acquiring company to position its
Revista Livre de Sustentabilidade e Empreendedorismo, v. 5, n. 1, p. 212-231, jan-fev, 2020 innovation basis in a more competitive platform, should lower the economic risk of the company.
Finally, we propose new research to be done using the same method, but with a bigger and diversified database and using the size of the acquiring company (measured by the company’s total asset) as control variable. Another approach to be researched would be to determine the relationship between the amount of complementary assets not redundant, that is, not held by the acquiring company before a merger/acquisition, and the variance of the economic risk (before and after merger/acquisition) among small and medium size companies.
REFERENCES
Arrow, K. J. (1975). Vertical integration and communication. Bell Journal of Economics, 6(1), 173–183.
Assaf Neto, A., & Lima, F. G. (2011). Curso de administração financeira. São Paulo: Atlas.
Lev, B & Mandelker, G (1972). The Microeconomic consequences of Corporate Mergers. The Journal of Business, 45(1) 85-104.
Helfat, C. E., & Teece, D. J. (1987). Vertical Integration and Risk Reduction. Journal of Law, Economics & Organization, 3(1), 47.
Klein, B., Crawford, R. G., & Alchian, A. A. (1978). Vertical Integration, Appropriable Rents, and the Competitive Contracting Process. Journal of Law & Economics, 21(2), 297–326.
Lintner, J. (1965). Security Prices, Risk, and Maximal Gains from Diversification. Journal of Finance, 20(4), 587–615. Available at: http://search.ebscohost.com/login.aspx?direct=true&db=bth&AN=4656697&lan g=pt-br&site=ehost-live. Access: Dec 15th, 2014.
Mossin, J. (1966). Equilibrium in a Capital Asset Market. Econometrica, 34(4), 768. doi:10.2307/1910098
Revista Livre de Sustentabilidade e Empreendedorismo, v. 5, n. 1, p. 212-231, jan-fev, 2020 Rodrigues, L. C., Silveira, A., Kono, C. M., & Lenzi, F. C. (2013). Inovação e Modelo de Negócio – Um estudo de caso no setor vitivinicultor. Revista Ibero-Americana de Estratégia, 12(2), 250–273. doi:10.5585/riae.v12i2.1979
Rosenberg, B., & Guy, J.The prediction of systematic risk. In: Ross, S. A.,Westerfield, R. W., & Jaffe, J. F. (2002). Corporate Finance (2o ed). Sao Paulo: Ed. Atlas.
Samanez, C. P. (2009). Engenharia Econômica. Rio de Janeiro: Prentice Hall Brasil.
Sharpe, W. F. (1964). Capital Asset Prices: A Theory of Market Equilibrium Under Conditions of Risk. Journal of Finance, 19(3), 425–442. Available at: http://search.ebscohost.com/login.aspx?direct=true&db=bth&AN=6637496&lan g=pt-br&site=ehost-live. Access: August, ,17th, 2014.
Siegel, S. (1956). Nonparametric Statistics for the Behavioral Sciences. New York: McGraw-Hill.
Teece, D. J. (1986). Profiting from technological innovation: Implications for integration, collaboration, licensing and public policy. Research Policy, 15(6), 285–305. doi:10.1016/0048-7333(86)90027-2
Teece, D. J. (2006). Reflections on “Profiting from Innovation”. Research Policy, 35(8), 1131–1146.
Teece, D. J. (2010). Business Models, Business Strategy and Innovation. Long Range Planning, 43(2/3), 172–194. doi:10.1016/j.lrp.2009.07.003
Teece, D. J. (2013). Profiting from Innovation. In Encyclopedia of Management Theory (p. 1056). SAGE Publications.
Teece, D. J., Armour, H. O., & Saloner, G. (1981). Vertical Integration and Risk Reduction. Graduate School of Business, Stanford University.
Williamson, O. E. (1992). Markets, hierarchies, and the modern corporation: An unfolding perspective. Journal of Economic Behavior & Organization, 17(3), 335–352. Available at http://ideas.repec.org/a/eee/jeborg/v17y1992i3p335-352.html. Accessed: Augn20th, 2014.
Woiler, S., & Mathias, W. F. (1996). Projetos: planejamento, elaboração e análise. São Paulo: Atlas.