Reproduction and structure of the population of the Chaetognath
Parasagitta friderici
in Guanabara Bay (Brazil) based on short term sampling
FABIANA MENDES, GISELA M. DE FIGUEIREDO and JEAN L.VALENTIN
Laboratório de Zooplâncton Marinho, Departamento de Biologia Marinha, Instituto de Biologia, Universidade Federal do Rio de Janeiro (UFRJ), Rua Professor Rodolpho Paulo Rocco, 211, Prédio do CCS,
bloco A1, sala 079, Cidade Universitária, 21249-617 Rio de Janeiro, RJ, Brasil
Manuscript received on July 30, 2010; accepted for publication on January 31, 2011
ABSTRACT
The aim of this study was to describe the total density, densities of developmental stages and the reproduction period of Parasagitta friderici. Weekly samples were collected at one station in the channel of Guanabara Bay, Rio de Janeiro, during one year. Three vertical hauls were made for each sample, and P. friderici was
separated, the developmental stages were identified, and body length (BL), ovary length (OL) and seminal
vesicle width (SVW) were measured. Throughout the year P. friderici was the most abundant chaetognath species occurring in all four developmental stages, the densities of which varied from week to week. Higher densities of adults occurred in the spring, followed by peaks of juveniles in the summer. Although
P. friderici seems to reproduce continuously in Guanabara Bay, a reproductive peak was apparent during
the spring. The intensification of reproduction during the spring, with juveniles occurring in the summer,
seems to be related to the period of higher food supply during the rainy season and intrusions of the South Atlantic Central Water.
Key words: Chaetognath, development stage, Guanabara Bay, reproduction.
Printed version ISSN 0001-3765 / Online version ISSN 1678-2690 www.scielo.br/aabc
Correspondence to: Fabiana Mendes E-mail: fabianamendes@ufrj.br
INTRODUCTION
Chaetognaths are an important planktonic group
that occurr from polar to tropical waters and
often present in high densities in the zooplankton
(Feigenbaum and Maris 1984). These organisms
are hermaphroditic and carnivorous, feeding
on zooplankton and fish larvae, but mainly
on copepods (Reeve 1970, Feigenbaum 1991,
Brodeur and Terazaki 1999). Several chaetognath
species have proved to be important indicators
of water masses (Casanova 1999).
104 FABIANA MENDES, GISELA M. DE FIGUEIREDO and JEAN L.VALENTIN
time scales, i.e., hours, days and weeks, which
are more concurrent with regional oceanographic
and ecological processes (Lopes 2007) and also
with zooplankton life cycles. In Guanabara Bay in
the state of Rio de Janeiro, seasonal events cause
thermal and salinity stratification of the water
column, which may cause rapid alterations in
plankton populations (Valentin et al. 1999a). The
greatest changes in the hydrobiological conditions
of Guanabara Bay are influenced by the entrance of
a cold coastal water mass (South Atlantic Central
Waters, SACW) into the Bay and the increase of
precipitation during the austral spring-summer
period (Mayr et al. 1989, Kjerfve et al. 1997).
In Brazil, chaetognath studies have dealt
mainly with distribution (Almeida Prado 1961a,
Fernandes et al. 2005) or population structure
and feeding (Nair and Sankarankutty 1988,
Vega-Pérez and Liang 1992, Liang and Vega-Pérez
1994, 1995, 2002). In Guanabara Bay, three
species of chaetognaths are abundant;
Parasagitta
friderici
Ritter-Zàhony is the dominant species,
followed by
Flaccisagitta enflata
Grassi and
Ferosagitta hispida
Conant (Marazzo and
Nogueira 1996).
Parasagitta friderici
is widely
distributed worldwide, occurring in the Pacific,
Mediterranean and Atlantic, as well as in
Brazilian estuaries and coasts (Almeida Prado
1961b, Fernandes et al. 2005, Avila et al. 2006).
In Guanabara Bay, the few studies on this species
have examined its distribution (Marazzo and
Nogueira 1996), feeding (Marazzo et al. 1997) and
vertical migration (Castellões 2000). However,
there is little information about the life cycle,
reproduction, and importance of this species in the
pelagic food web (e.g., Gibbons 1994, Daponte et
al. 2004). The aim of this study was to describe the
density, reproduction period and structure of the
P. friderici
population in terms of developmental
stages. We collected samples in short (weekly)
time intervals to minimize possible bias related to
the short life cycle of this species.
MATERIALS AND METHODS
Weekly samples were collected at one station
(~ 20 m depth) located in the main channel of
Guanabara Bay, Rio de Janeiro, Brazil (22°54’04’’ S
and 43°08’53’’ W) during one year (September 2003
through August 2004). Three vertical hauls were
conducted using a conical net of 60 cm diameter
and 200
µ
m mesh size, with a calibrated flowmeter
attached. Samples were fixed in 4% formalin buffered
with sodium tetraborate. Data for temperature and
salinity at the surface and near the bottom were
obtained using a thermosalinometer (Labcomp
SCTPH). Precipitation data were obtained from the
Instituto Nacional de Meteorologia (INMET).
Chaetognaths were separated from the samples
and identified to species level. For the dominant
species
Parasagitta friderici
, the developmental
stages of at least 100 individuals were identified
in each sample. The stages were separated based
on the classification proposed by Kehayias et al.
(1999), in which: stage I - young without visible
ovaries; stage II – visible ovaries but not seminal
vesicles; stage III – both ovaries and seminal
vesicles visible; and stage IV- seminal vesicles
filled with sperm, large ova in ovaries. Body length
(BL), ovary length (OL), and seminal vesicle
width (SVW) were measured using a microscope
with a camera attached and an image analysis
system (AxioVision
®V.4.5, Carl Zeiss). The
proportion between the ovary and body lengths
was determined for each stage of development and
season, according to Furnestin (1957).
Correlation tests were conducted between
level of significance (p
< 0.01). Data higher or
lower than 1.5 times the interquartile range were
considered outliers and were omitted from the
analysis. Statistical analyses were conducted using
the software Statistica version 7 (Statsoft 2004).
RESULTS
Periods of thermal stratification in the water
column occurred from November 2003 to January
2004, caused by intrusion of cold water from the
South Atlantic Central Water (SACW). During this
period, surface water temperatures were between
22-26
ºC and the bottom temperature was ~ 18
°C
(Fig. 1). Water stratification due to low salinity
(< 30) at the surface occurred at irregular intervals
from October to March, caused by high rainfall in
the region during the spring and summer.
Three species of chaetognaths were found in
Guanabara Bay.
Parasagitta friderici
comprised
95% of the total individuals collected, followed
by
Flaccisagitta enflata
(4%) and
Ferosagitta
hispida
(1%). In general, in each sample,
P. friderici
contributed ~ 90% to total chaetognath density,
except at the end of June and beginning of July
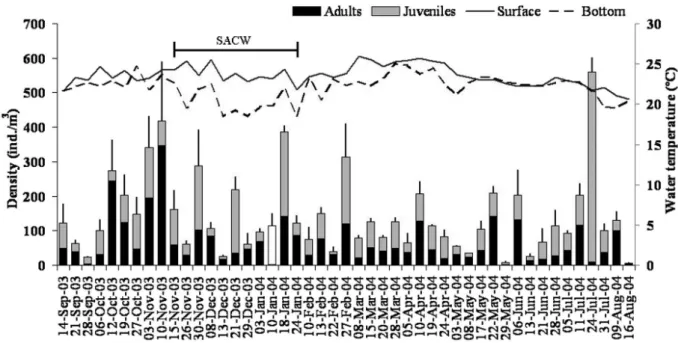
(70-80%). Densities of
P. friderici
varied weekly
and showed no clear pattern over the year (Fig.
1).
The highest density was 560 ind./m
3on July 24,
and the lowest was 6.5 ind./m
3on August 16
(Fig. 1). Higher densities occurred from the end
of October to the beginning of November, just
prior to the intrusion of the SACW. However,
there were no significant correlations (p > 0.05)
between weekly density variations of
P. friderici
and the abiotic factors (temperature, salinity, tide,
and precipitation). Juveniles (stages I and II) and
adults (stages III and IV) occurred throughout the
year, although their relative contributions also
varied widely week to week (Fig. 1). The highest
density of adults was observed at the end of the
spring (October-November), and it was followed
by sporadic peaks of juveniles.
Fig. 1 - Means of density (+ standard errors) and contribution of the maturation stage of Parasagitta friderici in Guanabara Bay collected weekly over one year. Juveniles included stages I and II, and adults included stages III and IV. The development stages of the sample collected
on January 10 was not identified (white bar). Lines indicate the variation of the mean of water temperature at the surface and at the bottom of
106 FABIANA MENDES, GISELA M. DE FIGUEIREDO and JEAN L.VALENTIN
A total of 650 individuals of
P. friderici
were
measured for comparisons of body length (BL),
ovary length (OL), and seminal vesicle width (SVW)
between the stages of development in each season.
ANOVA comparisons of BL between stages for each
season showed significant results (spring F
(3, 245)= 312.6, p
<
0.00001; summer F
(3,210)= 151.2, p
<
0.00001; autumn F
(3,106)=
105.4, p
<
0.00001; winter
F
(3,63)= 41.3, p
<
0.00001) (Fig.2). The BL increased
with development until stage III (Tukey test,
p < 0.05) and there was no increase in body length
from stages III to IV (Tukey test, p
>
0.05), except
during the spring when body length differed among
all development stages (Tukey test, p
<
0.05) (Fig. 2).
The range of body length of
P. friderici
was 2.5-12
mm, and individuals longer than 10 mm occurred
only during spring and summer. Comparisons of BL
at each stage between seasons showed differences for
stage II, where individuals collected during the autumn
were larger than during the winter (F
(3,158)=
3.8,
p
<
0.05;
Tukey,
p
<
0.05). Seasonal differences in
body length also occurred for stages III (F
(3,146)=
7.4,
p
<
0.05) and IV (F
(3,181)= 13.6, p
<
0.05). For both
stages, individuals collected in the summer were
larger (p
<
0.05), and individuals collected in the
autumn were smaller (p < 0.05). Thus, adults reach
their maximum size at stage III, except in spring
when they grow larger from stage III to IV. However,
during the summer the maximum size is reached
earlier (stage III) and is larger than in the other season.
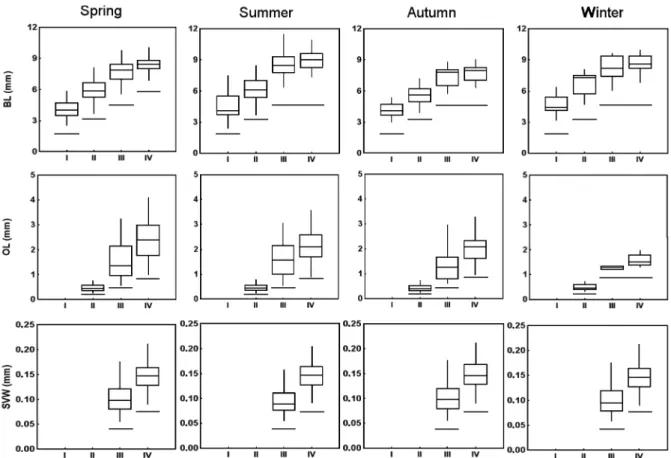
Comparisons of ovary length (OL) also
showed significant differences between the stages
Fig. 2 – Changes in the body length (BL), ovary length (OL) and seminal vesicle width (SVW) during the ontogenetic development (stages I-IV)
in each season of the year (summer, spring, autumn and winter). The box represents the median value (horizontal segment), the range containing 50% of the individuals (box), and vertical segments represent 1.5 times the interquartile range. The horizontal line below each box indicates that
for all seasons (i.e., spring F
(2, 161)= 127.8, p
<
0.0001;
summer F
(2,123)= 151.1, p < 0.00001; autumn
F
(2,63)= 71.9, p < 0.00001; winter F
(2, 25)= 42.1,
p
<
0.00001), and the ovaries increased according to
the developmental stage (Tukey test, p < 0.05). The
exception occurred for samples collected during the
winter, when there were no significant differences
between ovary length of individuals in stages III
and IV (Tukey test, p > 0.05) (Fig. 2). There were
no seasonal differences in OL for individuals in
stages II and III (p > 0.05). For individuals in stage IV,
significant differences were found (F
(3,118)= 3.4;
p < 0.05). Although the Tukey test did not confirm
differences in ovary length between seasons, a visual
pattern shows an increase of ovary size (winter
<
autumn < summer < spring) (see Fig. 2).
Seminal vesicle width (SVW) was
significantly larger in stage IV for all seasons
(one-way ANOVA: spring F
(1, 45)= 114, p < 0.00001;
summer F
(1,85)=
43, p
<
0.00001; autumn F
(1,64)= 67,
p < 0.00001; winter F
(1, 32)=
44.7, p
<
0.00001)
(Fig.
2). Seasonal comparisons showed that
individuals in stage III collected in the summer had
wider seminal vesicles than those collected in the
spring and autumn (F
(3, 144)= 5.4, p < 0.05; Tukey
test, p < 0.05), whereas for individuals in stage IV
there were no significant differences.
The proportion between ovary and body
length of
P. friderici
in stage IV showed that
during the spring, 42% of individuals had ovaries
corresponding to 30 to 45% of body length, while
during the summer only 18% of individuals had
ovaries corresponding to 30 to 40% of body
length. In contrast, during the winter, 80% of
individuals had ovaries corresponding to 8 to 16%
of body length. At stage III, 41% of individuals
in the spring, 37% in the summer, and 33% in
autumn had ovaries occupying 20 to 30% of their
body length. Thus, the highest percentage of
individuals of
P. friderici
with ovaries occupying
a higher part of their body, in both stages III and
IV, occurred in the spring.
DISCUSSION
PARASAGITTA FRIDERICIDENSITYOVERTHEYEAR
In Guanabara Bay,
P. friderici
has been very
abundant since it was first recorded (Costa 1970).
In the current study, it was the most abundant
chaetognath species throughout the year.
Parasagitta
friderici
is often reported in estuaries on the south
coast of Brazil, and also in Uruguay and Argentina.
In the latter, it was the only species that occurred in
areas strongly influenced by fresh water in the La
Plata River (Boltovskoy 1975). In the present study,
higher densities of
P. friderici
occurred in spring
and summer, particularly during the rainy season
(October through March) and sporadic intrusions
of the SACW (November through January). High
densities of zooplankton, which were previously
reported in Guanabara Bay from January to May,
were attributed to the influence of the summer
rains (Nogueira et al. 1988) and the influx of
coastal waters (Marazzo and Nogueira 1996). Both
factors increase nutrient levels in the Bay, which
increases phytoplankton production and subsequent
zooplankton densities. Early studies showed that the
density of prey, mainly copepods, may be a key factor
influencing the spatial and temporal distribution of
chaetognath density (Marazzo and Nogueira 1996,
Hernandez et al. 2005, Tse et al. 2007). Thus, the
higher densities of
P. friderici
in Guanabara Bay
during the spring and summer seem to be related
to high food availability. Further studies should
consider simultaneous sampling of
P. friderici
and
their prey on fine scales.
108 FABIANA MENDES, GISELA M. DE FIGUEIREDO and JEAN L.VALENTIN
and salinity variations (Bieri 1959, Almeida Prado
1961b, Marazzo and Nogueira 1996, Fernandes et
al. 2005). Abiotic factors and population dynamics
determine the variations in zooplankton density, and,
to better distinguish these oscillations, short sampling
intervals, i.e. weekly or hourly, are recommended
(Batistic et al. 2007, Lopes 2007). Other factors not
approached here, such as population dynamics and
currents that carry
P. friderici
into the Bay, could
have influenced the chaetognath densities. Although
we did not recognize the causes of the short-term
variation of
P. friderici
densities, our results clearly
indicated the wide variability in
P. friderici
densities
within a month. Therefore, we suggest that studies of
population dynamics of chaetognaths consider short
sampling intervals (i.e. week or days), particularly in
dynamic environments such as estuaries and bays.
MORPHOLOGYOFDEVELOPMENTALSTAGES
Several schemes have been proposed for the
classification of the developmental stages of
chaetognaths (see Boltovskoy 1981, Alvariño 1990).
Here, we used the key proposed by Kehayias et al.
(1999), particularly because it is simpler, there is no
need to stain the specimens, it includes fewer stages
of development, and it has been used for many
species, making comparisons possible. Although
this classification key does not include
P. friderici
,
its application showed similarities with other keys
proposed for this species (i.e., Alvariño 1969 apud
Alvariño 1990, Daponte et al. 2004).
The classification of Kehayias et al. (1999)
allowed us to clearly separate
P. friderici
into four
stages. However, we observed some overlapping
between sizes of individuals in different stages.
For instance, individuals in stages III and IV did
not show differences in body and ovary lengths.
The overlapping in gonad size or body length for
individuals of different stages has been ascribed to
several causes, such as: limitations inherent to the
classification keys (Daponte et al. 2004), variations
in the timing between the development of male and
female gonads (protandry) (Pearre 1991, Kehayias
et al. 1999), contraction of the ovary after spawning
(Pearre 1991), seasonal variation, and the constant
mixture of individuals coming from different
environmental conditions (e.g., food availability and
temperature). Below, we discuss some reasons for
the variability of gonads and body sizes within the
developmental stages.
The overlapping between ovary lengths of
individuals in stages III and IV occurred only in
the winter, when individuals had smaller ovaries
despite being mature. This suggests that during the
winter there was less investment in reproduction. We
also found the overlapping of body length between
individuals in stages III and IV, except in the spring.
In general,
P. friderici
in Guanabara Bay reaches its
maximum size at stage III, and thereafter the energetic
investment is directed to the development of gonads
instead of the somatic body. During the summer, the
maximum size, which is the largest of the year, is also
reached earlier, in stage III. On the other hand, during
the spring,
P. friderici
seems to be able to invest in
both reproduction and somatic growth. In our study,
the overlapping in sizes between individuals at
different stages of development seems to be related to
environmental conditions, particularly to the seasonal
variations in Guanabara Bay. Body and gonad sizes
not only showed overlapping, but also differed among
individuals in the same stage of development that
were collected in different seasons. Therefore, given
the high variability of gonads size within a stage, the
use of classification keys for developmental stages
that employ body morphology instead of considering
proportions based on gonad sizes is advisable.
REPRODUCTIONOF PARASAGITTA FRIDERICI
pattern. However, a reproductive peak was
recognized during the spring, when higher densities
of adults occurred, followed by peaks of juveniles
in the summer. To better identify periods when
reproduction is more intense, we also analyzed
the size of ovaries. Our results showed a higher
frequency of individuals with ovaries corresponding
to a larger part of body during the spring (twice the
frequency found in the summer), which seems to
indicate a higher reproductive activity.
Parasagitta friderici
may reproduce
continuously through the year since the temperature
does not oscillate widely (range between 17–31ºC,
Kjerfve et al. 1997) and the density of copepods
remains high (~ 15.000 ind./m
3) (Valentin et
al. 1999b). However, the intensification of
reproduction during the spring seems to be
related to the period of the rainy season and
intrusions of the SACW into the Bay, increasing
the food supply, i.e., copepods. The intrusion of
SACW in Guanabara Bay is an important event
in this ecosystem because it brings cold water
with high nitrate and oxygen contents (Valentin
et al. 1999b). During this period, the primary
production increases in the Bay, which results in
higher density and quality of food available to
zooplankton. The association of higher densities
of juveniles of
P. friderici
with the SACW was
also reported for the São Paulo coast (Liang and
Vega-Pérez 2002). In Guanabara Bay, densities of
copepods tend to be high in the summer (Nogueira
et al. 1988), when we also found higher densities
of juveniles of
P. friderici
. Thus, the maturation
of
P. friderici
in Guanabara Bay may be coupled
with copepod reproduction, as demonstrated for
F. enflata
off the Chilean coast (Giesecke and
González 2008). Similar patterns of continuous
reproduction with peaks of intensification were
observed for
P. friderici
during the spring and
summer off the Iberian Peninsula (Alvariño 1990)
and in the spring and autumn on the Argentina
coast (Daponte et al. 2004). In the Cananéia
estuary in São Paulo, the continuous reproduction
with three reproductive peaks in one year was
associated with the temperature and hydrology of
the region (Liang et al. 2003).
In summary, the current study, conducted on a
short temporal scale, showed wide oscillations in the
structure (density and age) of
P. friderici
population.
The pattern of continuous reproduction with a peak
in the spring and juveniles in the summer was better
demonstrated by coupling the analyses of densities
of the developmental stages and the frequency of
individuals with ovaries filling a larger part of the
body. Finally, in Guanabara Bay the reproduction
of
P. friderici
seems to benefit from the high food
supply during the spring and summer.
ACKNOWLEDGMENTS
We are grateful to FJP Matos for helping with
field sampling, and JA Castro for counting and
measuring chaetognaths. We also thank three
anonymous referees who provided comments
to a former version of this article. Financial
assistance was provided by Fundação Carlos
Chagas Filho de Amparo à Pesquisa do Estado do
Rio de Janeiro (FAPERJ) and Conselho Nacional
de Desenvolvimento Científico e Tecnológico
(CNPq). F Mendes was supported by a fellowship
from FAPERJ.
RESUMO
O objetivo deste estudo foi descrever a densidade total,
densidades dos estágios de desenvolvimento e o período reprodutivo de Parasagitta friderici. As coletas foram realizadas semanalmente durante um ano em uma estação no canal da Baía de Guanabara, Rio de Janeiro. Foram realizados três arrastos verticais em cada amostragem e,
P. friderici foi separada, os estágios de desenvolvimento
identificados e o comprimento do corpo, comprimento
110 FABIANA MENDES, GISELA M. DE FIGUEIREDO and JEAN L.VALENTIN
densidades variaram entre as semanas. As densidades mais altas de adultos ocorreram na primavera seguidas de picos de juvenis no verão. Embora, P. friderici se reproduza continuamente na baía de Guanabara, um pico reprodutivo foi aparente durante a primavera. A
intensificação da reprodução durante a primavera com a
ocorrência de juvenis no verão, parece estar relacionada ao aumento da oferta de alimento durante a estação chuvosa e intrusões da Água Central do Atlântico Sul.
Palavras-chave: Chaetognatha, estágios de desenvolvimento, Baía de Guanabara, reprodução.
REFERENCES
ALMEIDA PRADO MS. 1961a. Chaetognatha encontrados em
águas brasileiras. Bolm Inst Oceanogr S Paulo 11: 31-51.
ALMEIDA PRADO MS. 1961b. Distribuição dos Chaetognatha
no Atlântico Sul Ocidental. Bolm Inst Oceanogr S Paulo 11: 15-50.
ALVARIÑO A. 1990. Chaetognatha. In: ADIYODI KG AND
ADIYODI RG (Eds), Reproductive biology of invertebrates: Fertilization, development, and parental care, 4, New York: J Wiley & Sons, p. 255-282.
AVILA LRM, ARRUDA MR AND BONECKER S. 2006. Chaetognatha. In: BONECKER SLC (Ed), Documentos REVIZEE Score Central: Atlas de Zooplâncton da região central da Zona Econômica Exclusiva brasileira, 21, Rio de Janeiro: Museu Nacional, p. 165-184.
BATISTIC M, JASPRICA N, CARIC M AND LUCIC D. 2007.
Annual cycle of the gelatinous invertebrate zooplankton of the eastern South Adriatic coast (NE Mediterranean). J Plankton Res 29: 671–686.
BIERI R. 1959. The Distribution of the Planktonic Chaetognatha in the Pacific and their Relationship to the Water Masses. Limnol Oceanogr 4: 1-28.
BOLTOVSKOY D. 1975. Some Biometrical, Ecological,
Morphological and Distributional Aspects of Chaetognata. Hydrobiologia 46: 515-534.
BOLTOVSKOY D. 1981. Chaetognatha. In: BOLTOVSKOY D
(Ed), Atlas del Zooplancton del Atlántico Sudoccidental y Métodos de Trabajo con el Zooplancton Marino, Mar del Plata, Argentina: Instituto Nacional de Investigación y desarrollo Pesquero, p. 759-785.
BRODEUR RD AND TERAZAKI M. 1999. Springtime abundance
of chaetognaths in the shelf region of the northern Gulf of Alaska, with observations on the vertical distribution and feeding of Sagitta elegans. Fish Oceanogr 8: 93-103.
CASANOVA J-P. 1999. Chaetognatha. In: BOLTOVSKOY D
(Ed), South Atlantic Zooplankton, 2, Leiden: Backhuys Publishers, p. 1353 -1374.
CASTELLÕES PV. 2000. Distribuição vertical do filo
Chaetognatha em um ponto fixo na baía de Guanabara (RJ-Brasil), Rio de Janeiro: Museu Nacional - Universidade Federal do Rio de Janeiro, 130 p.
COSTA P. 1970. Nota preliminar sobre ocorrência de Sagitta friderici e Sagitta enflata na Baia de Guanabara. Publ Inst Pesq Mar 47: 1-10.
DAPONTE MC, CAPITANIO FL, NAHABEDIAN DE, VINAS MD
AND NEGRI RM. 2004. Sagitta friderici Ritter-Zahony (Chaetognatha) from South Atlantic waters: abundance, population structure, and life cycle. ICES J Mar Sci 61: 680-686.
FEIGENBAUM D. 1991. Food and feeding behaviour. In:
BONE Q, KAPP H AND PIERROT-BULTS A (Eds), The biology of chaetognaths, Oxford: Oxford University Press, p. 45-54.
FEIGENBAUM D AND MARIS RC. 1984. Feeding in the
Chaetognatha. Oceanogr Mar Biol Annu Rev 22: 343-392.
FERNANDES LL, STERZA JM AND NEVES KO. 2005.
Seasonal Chaetognath abundance and distribution in a tropical estuary (Southeastern, Brazil). Braz j oceanogr 53: 47-53.
FURNESTIN M-L. 1957. Chaetognathes et zooplankton du
secteur Atlantique Marocain. Rev Trav Inst Pech Marit 21: 1-356.
GIBBONS MJ. 1994. Diel Vertical Migration and Feeding
of Sagitta-Friderici and Sagitta-Tasmanica in the Southern Benguela Upwelling Region, with a Comment on the Structure of the Guild of Primary Carnivores. Mar Ecol-Prog Ser 111: 225-240.
GIESECKE R AND GONZÁLEZ HE. 2008. Reproduction and
feeding of Sagitta enflata in the Humboldt Current system off Chile. ICES J Mar Sci 65: 361-370.
HERNANDEZ RM, SUAREZ-MORALES E AND GASCA R. 2005.
Seasonal distribution of chaetognatha in a Mexican neotropical bay during a year cycle. J Coast Res 21: 186-192.
JÓZEFCZUK A, GUZERA E AND BIELECKA L. 2003. Short-term
and seasonal variability of mesozooplankton at two coastal stations (Gdynia, Sopot) in the shallow water zone of the Gulf of Gdańsk. Oceanologia 45: 317–336.
KEHAYIAS G, KOUTSIKOPOULOS C, FRAGOPOULU N AND
LYKAKIS J. 1999. A single maturity classification key for
five common Mediterranean chaetognath species. J Mar Biol Assoc Uk 79: 1137-1138.
KJERFVE B, RIBEIRO CHA, DIAS GTM, FILLIPO AM AND
VALÉRIA DSQ. 1997. Oceanographic characteristics of an
LIANG TH, ARA K, MIRANDA LB, BERGAMO AL AND
BERNARDES M. 2003. On the variability of the chaetognath
Sagitta friderici Ritter-Zahony at Cananéia Lagoon Estuarine system, São Paulo, Brazil. Hydrobiologia 510: 91-102.
LIANG TH AND VEGA-PÉREZ LA. 1994. Studies on
chaetognaths off Ubatuba region, Brazil, I. distribution and abundance. Bolm Inst Oceanogr S Paulo 42: 73-84.
LIANG TH AND VEGA-PÉREZ LA. 1995. Studies on
chaetognatha off Ubatuba region, Brazil. II. Feeding habits. Bolm Inst Oceanogr S Paulo 43: 27-40.
LIANG TH AND VEGA-PÉREZ LA. 2002. Distribution,
abundance and biomass of Chaetognaths off São Sebatião region, Brazil in february 1994. Braz j oceanogr 50: 1-12.
LOPES RM.2007. Marine zooplankton studies in Brazil –
A brief evaluation and perspectives. An Acad Bras Cienc 79: 369-379.
MARAZZO A,MACHADO CF AND NOGUEIRA CSR.1997. Notes
on feeding of Chaetognatha in Guanabara Bay, Brazil. J Plankton Res 19: 819-828.
MARAZZO A AND NOGUEIRA CSR.1996. Composition, spatial
and temporal variations of Chaetognatha in Guanabara Bay, Brazil. J Plankton Res 18: 2367-2376.
MAYR LM, TENENBAUN DR, VILLAC MC, PARANHOS R,
NOGUEIRA CR,BONECKER SL AND BONECKER AC.1989.
Hydrobiological Characterization of Guanabara Bay. In MAGOON OT AND NEVES C (Eds), Coastlines of Brazil, New York: American Society of Civil Engineering, p. 124-139.
NAIR VR AND SANKARANKUTTY C.1988. Chaetognaths of
Potengi Estuary (Natal, Northest Brazil). Atlântica 10: 5-20.
NOGUEIRA CR,BONECKER ACT AND BONECKER SLC. 1988.
Zooplâncton da Baía de Guanabara (RJ - Brasil) – Composição e variações espaço-temporais, In: Encontro Brasileiro de Plâncton, 3, Caiobá, Brasil, p. 151-156.
PEARRE SJR. 1991. Growth and Reproduction. In: BONE Q,
KAPP H and PIERROT-BULTS A (Eds), The biology of chaetognaths, Oxford: Oxford University Press, p. 61-75.
REEVE MR.1970. The biology of Chaetognatha I. Quantitative
aspects of growth and egg production in Sagitta hispida. In: STEELE JH (Ed), Marine Food Chains, Edinburgh: Oliver and Boyd, p. 168-189.
STATSOFT. 2004. STATISTICA: Data Analysis Software System. Version 7.0. Available from: www.statsoft.com.
TSE P,HUI SY AND WONG CK.2007. Species composition and
seasonal abundance of Chaetognatha in the subtropical coastal waters of Hong Kong. Estuar Coast Shelf Sci 73: 290-298.
VALENTIN JL,TENENBAUM D,BONECKER ACT, BONECKER
S, NOGUEIRA C, PARANHOS R AND VILLAC MC.
1999b. Caractéristiques Hydrobiologiques de la Baie de Guanabara (Rio de Janeiro, Brésil). J Rech Oceanogr 24: 33-41.
VALENTIN JL,TENENBAUM DR,BONECKER ACT, BONECKER
SLC, NOGUEIRA CR AND VILLAC MC. 1999a. O
Sistema Planctônico da Baía de Guanabara: Síntese do Conhecimento. Oecol Brasil 7: 35-59.
VEGA-PÉREZ LA AND LIANG TH. 1992. Feeding of pelagic