PARAMETERIZATION OF THE 3-PG MODEL FOR EUCALYPT IN THE REGION OF CERRADO IN MINAS GERAIS STATE
PARAMETRIZAÇÃO DO MODELO 3-PG PARA EUCALIPTO NA REGIÃO DO CERRADO DE MINAS GERAIS
Jarbas Silva Borges1 Júlio César Lima Neves2 Helton Maycon Lourenço3 Nairam Félix de Barros4 Sharlles Cristhian Moreira Dias5
ABSTRACT
The 3-PG model is an effective tool for determining the productive productivity of eucalypt plantations. However, the model parameterizations available today produce underestimated results when they are applied to Cerrado region of Minas Gerais state. Thus, in this paper we aimed to parameterize the 3-PG model for fast-growing eucalypt clonal plantations in the Cerrado region of Minas Gerais state, Brazil. To perform the parameterization, there were collected data from stands of Eucalyptus grandis x Eucalyptus urophylla clonal hybrid, throughout an age range, from very young stands (about 3 months old) until adult stands (about 7 years old), in two regions (Curvelo and Itacambira – MG). The growth estimates obtained by 3-PG were compared with data from forest inventory in both regions, until 84 months old. The application of 3-PG model using the set of parameter and variable values determined in the study allowed to describe, accurately, the growth patterns of forests stands in the Cerrado region of Minas Gerais state. Thus, it follows that the parameterization upgraded the performance of the model that resulted in accurate estimates of growth.
Key words: process-based modeling; simulation; eucalypt.
RESUMO
O modelo 3-PG é uma ferramenta eficaz para determinação do potencial produtivo de florestas de eucalipto. No entanto, as parametrizações deste modelo, hoje disponíveis, produzem resultados subestimados quando aplicadas à região do Cerrado de Minas Gerais. Dessa forma, o objetivo deste trabalho foi parametrizar o modelo 3-PG para plantios de eucalipto localizados na região do Cerrado de Minas Gerais. Para isso, foram utilizados dados de povoamentos de híbridos clonais de Eucalyptus grandis x Eucalyptus urophylla, com idades entre 3 e 84 meses, localizados nas regiões de Curvelo e Itacambira – MG. As estimativas de crescimento obtidas pelo modelo 3-PG foram comparadas com dados de crescimento de povoamentos florestais medidos nas duas regiões, até a idade de 84 meses. O conjunto de valores de parâmetros e variáveis obtidos neste trabalho permitiu simular com acurácia, em termos das variáveis produzidas pelo modelo, os padrões de crescimento de povoamentos florestais presentes na região do Cerrado mineiro. Dessa forma, conclui-se que a parametrização promoveu melhorias no desempenho do modelo que resultaram em estimativas acuradas de crescimento.
Palavras-chave: modelagem processual de crescimento; simulação; eucalipto.
1. Engenheiro Agrônomo, Msc., Doutorando do Programa de Pós-graduação em Solos e Nutrição de Plantas, Departamento de Solos, Universidade Federal de Viçosa, Av. P.H. Rolfs, s/n, CEP 36570000, Viçosa (MG). [email protected]
2. Engenheiro Agrônomo, Dr., Professor Adjunto do Departamento de Solos, Centro de Ciências Agrárias, Universidade Federal de Viçosa, Av. P.H. Rolfs, s/n, CEP 36570000, Viçosa (MG). [email protected] 3. Engenheiro Agrônomo, Msc., Doutorando do Programa de Pós-Graduação em Solos e Nutrição de Plantas,
Departamento de Solos, Universidade Federal de Viçosa, Av. P.H. Rolfs, s/n, CEP 36570000, Viçosa (MG). [email protected]
4. Engenheiro Florestal, PhD., Professor Titular do Departamento de Solos, Centro de Ciências Agrárias, Universidade Federal de Viçosa, Av. P.H. Rolfs, s/n, CEP 36570000, Viçosa (MG). [email protected]
5. Estudante de Engenharia Florestal, Departamento de Engenharia Florestal, Universidade Federal de Viçosa, Av. P.H. Rolfs, s/n, CEP 36570000, Viçosa (MG). [email protected]
INTRODUCTION
Traditionally, mensuration-based growth and yield models have been the main modelling tools applied to the forest management systems (SOARES et al., 2005). Despite their relatively simple data requirement, they provide a high degree of accuracy in predicting forest growth across stands in a region (BATTAGLIA & SANDS, 1998). However, their application is limited to spatial and temporal scale in which they were developed (MIEHLE et al., 2009), disabling the application in locations where there is no previous growth information, besides not considering changes in growth conditions or forest management throughout time or from one rotation to the other.
Thus, there has been situations in which the forest manager has sought decision support tools that surpasses the imposed limitations by the growth and yield models (BATTAGLIA & SANDS, 1998), as examples: the incorporation of new areas, before used for agriculture or pasture, and for which there is no growth data available for the adjustment of growth and yield models traditionally used in the forestry sector; the need to provides answers to the more complex questions of the forest management, like the risk minimization of extreme events, mitigation of the climate change effects, environmental pollution and sustainable forest management (in terms of water use efficiency, for example).
In this sense, the appearance of the 3-PG model, acronym for Physiological Principles in Predicting Growth (LANDSBERG & WARING, 1997) – in essence, an efficiency model of solar radiation and water use, and carbon partition – was auspicious. This model, developed to estimate the productivity of even-aged forest stands, is based in physiological processes used in process-based, carbon-balance models. However, it also incorporates empirical relationships derived from experimental measurements, which make possible to keep the 3-PG model relatively simple.
The 3-PG enables the prediction of the impact of key environmental factors on productivity (solar radiation, temperature, water and nutrients) and management practices, on the productive potential of the forest species and, consequently, on the sustainability of planted forests (ALMEIDA et al., 2004a). It aid in the quantification of risks associated to production, improving the quality of the decision making process. This model has
a simple and transparent structure, is simple to operate, use readily available input data, and its parameters are relatively easy to determine. These characteristics enhance the likelihood of its use in a management context (ESPREY, et al., 2004).
The performance of the 3-PG in estimating productivity of commercial forests, or not, of eucalypt and/or pines has been evaluated in several countries: Australia (TICKLE et al., 2001; SANDS & LANDSBERG, 2002; LANDSBERG et al., 2003), New Zealand (COOPS et al., 1998; WHITEHEAD et al., 2002), USA (COOPS & WARING, 2001), South Africa (DYE, et al., 2004), Chile (RODRÍGUEZ et al., 2009) and China (ZHAO et al., 2009). In Brazil, this performance has been evaluated from data obtained in plantations of forest companies located in the States of Bahia (STAPE, 2002; STAPE et al., 2004), Espírito Santo (ALMEIDA et al., 2004a,b; ALMEIDA et al., 2010) and the central-east region of Minas Gerais state (SILVA, 2006).
the 3-PG model adjusted for that particular region. Thus, this work aimed to establish a set of parameter values that would enable to describe with high accuracy, in terms of variables produced by the model 3-PG, the growth patterns of eucalypt plantations located in the Cerrado region of Minas Gerais state.
MATERIAL AND METHODS
Studied area
The data to conduct this study came from Eucalyptus grandis x Eucalyptus urophylla clonal hybrids plantations, throughout an age range, from very young stands (about 3 months old) until adults stands (about 7 years old), located in the regions of Curvelo (18º45’23’’ S and 44º25’51’’ W) and Itacambira (17º03’53’’ S and 43º18’32’’ W) – MG, owned by PLANTAR S.A. The city of Curvelo is located in the central region of the state, at an average altitude of 600 m, with average annual precipitation of 1360 mm. Itacambira is situated to the north of the state at an altitude of approximately 1000 m and average annual precipitation of 900 mm.
The soils of the evaluated stands were ripped at a 50 cm depth before planting and then it was applied the Gafsa reactive natural phosphate. Soon after plantation the soils were fertilized with NPK 6-30-6 at 1 % B, 0.5 % Cu and 0.5 % Zn. Approximately six months after planting, an additional fertilization was made with KCl in Curvelo. In Itacambira two additional applications of KCl were made, one at the time of planting and another approximately six months after planting. Annually, up to the third year were made boron application in all stands.
At each region plots were established, composed of 40 plants, 600 m2 (30 m x 20 m), planted with stocking averaging 1100 trees ha-1, at the ages of 3, 12, 24, 36, 60 and 84 months. In these plots, all plants had diameter measured at 1.30 m height (dbh). For the young plants (3 months old) the diameter was measured at the ground level.
Measurements used to parameterize and calibrate the 3-PG
Evaluation of the biomass
At each plot, four plants with the mean dbh were destructively sampled. In the sampled trees were determined: total height, wood density, wood volume, specific leaf area and the biomass of the components leaves, branches, bark, root and wood.
These components were separated and weighed (fresh matter) after the cut. For the estimate of the weight of the dry matter of these components, after the homogenization, sub-samples were oven dried to constant mass and weighed to correct for moisture content. From the total of the fresh matter’s weight of each compartment and the ratio between the weight of the dry and fresh matter of each sample, the weight of the total dry matter was estimated, of the respective compartments for each sampled tree.
Regarding the determination of the roots’ biomass, the measurements were taken from only two average plants per plot. In this determination, a uniform distribution of the roots in the soil’s profile was considered, with a parallel trench to the line of the plantation, distributed at ¼ of the useful area of the sampled plants (LELES et al., 2001; DU TOIT, 2008). Initially, all the roots were removed from the layers from 0-20 cm, later, all of the layers from 20-40 cm and, then all of the layers from 40-80 cm in depth. The roots were separated, by means of sifting, in fine root + medium (≤ 4 mm) and coarse roots (> 4 mm), and weighed to determine the fresh and dry matter.
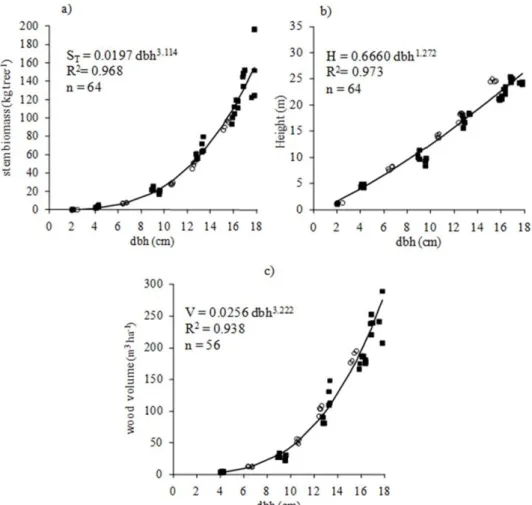
From the data obtained the allometric relationship were fitted, following the model Wi = a DBHb, where Wi is the dependent variable and a and b are the empiric parameters. As such, equations for the allometric relationships for “stem” biomass (hardwood + bark + branches) (ST), for total height (H) and wood volume (V) were adjusted as a function of the dbh (Figure 1).
Soil
Litterfall
To determine the litterfall six litter traps were scattered randomly throughout each plot. The litter traps consisted of nylon screens (meshs) (sombrite type), fixed horizontally in steel frames of 0.5 m x 0.5 m (0.25 m2 of surface) and supported at 0.30 m above the soil’s surface by steel rods. The litterfall was quantified monthly, separating it in leaf and branch. After weighing the collected material from the six collectors in each plot and of the determination of the dry matter of each sample, the average monthly litterfall was estimated. The values were expressed in t ha-1 of dry matter. Generally, there was an increase in the literfall with the aged of forest up to 3-4 years, and gradual decrease in subsequent ages. There was also the influence of season, being the highest litterfall seen between the
months of May and July, independent of the age of the population. Based on the measured values and using the calibration procedures were established the values of the model parameters related to the litterfall (gammaFx and tgammaF) (Table 3).
Specific Leaf Area (SLA), Branch and Bark Fraction (PBB) and Wood Density (ρ)
In determining the SLA 50g-leaf samples (fresh matter) were taken, after homogenization of all leaves, at the time of biomass quantification of mean plants. The SLAwas calculated by the ratio between leaf area, determined in an automatic leaf area meter LI-3000 (LI-Cor, USA), and the dry matter of leaves in each collected sample.
For the ρ determination, five disks of approximately 2 cm thickness were removed
FIGURE 1: Allometric relationship for (a) “stem” biomass (branches + bark + hardwood) (kg tree-1), (b) height (m), (c) wood volume (m3 ha-1) as a function of the dbh (cm). In this figure the open circles represent the measured data in Curvelo and the filled squares the measured data in Itacambira.
region. The maximum and minimum temperatures and global solar radiation data were obtained from a climatic database for South America, with a resolution of 0.5 degrees latitude and longitude (Table 2).
The 3-PG model
The full description of the original 3-PG model is provided by Landsberg & Waring (1997). In addition, detailed description of the current version of the model, used in this work, is provided by Sands & Landsberg (2002). The general structure of the model is composed by five submodels: the assimilation of carbohydrates, the distribution of biomass between foliage, roots and stems, mortality, soil water balance, and conversion of biomass values into variables of interest to forest managers.
from the positions 0, 25, 50, 75 and 100 % of the commercial height, of each one of the sampled trees in each of the plots, with the values of density of each tree the average of the density value found in the five positions.
To evaluate the variation of specific leaf area, wood density and branch and bark fractions in relation to the aboveground biomass excluding the leaves, as function of the stand age, non-linear equations were adjusted, proposed by Sands & Landsberg (2002) (Table 1).
Meteorological data
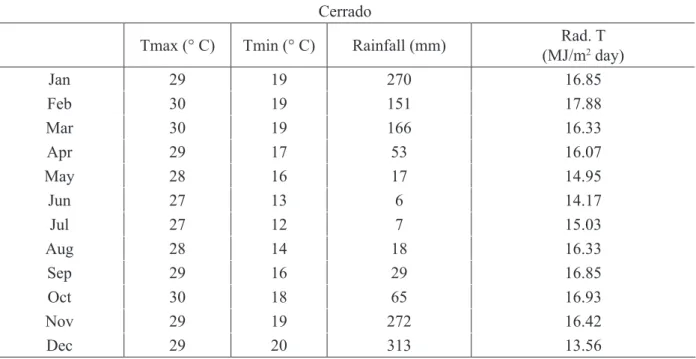
Regarding the meteorological data inserted in the 3-PG to simulate the growth of eucalypt forests, normal climate data were used, except for rainfall. The rainfall data used are from an average for a 10-year period of measurement available for the
TABLE 1: Variation of specific leaf area, wood density, branch and bark fraction with the stand age. TABELA 1: Variação da área foliar específica, densidade da madeira, fração de galho e casca com a idade
do povoamento.
Variable EQUATION n R2
SLA (m2 kg-1) SLA = 7.56 + (13.74 - 7.56)exp(-0.69315 (age/1.23)2) 64 0,864 ρ (t m-3) ρ = 0.505 + (0.382 - 0.505) exp(-0.69315 (age/2.26)2,99) 56 0,720
PBB (kg kg-1) P
BB = 0.19 + (0.59 - 0.19) exp (-0.69315 (age/2.17)
3) 64 0,800
n: number of points considered in the equation; “R2”:percentage of explained variance; age in years.
TABLE 2: Average meteorological data for the Cerrado region of Minas Gerais state. TABELA 2: Dados meteorológicos médios para a região do Cerrado de Minas Gerais.
Cerrado
Tmax (° C) Tmin (° C) Rainfall (mm) Rad. T
(MJ/m2 day)
Jan 29 19 270 16.85
Feb 30 19 151 17.88
Mar 30 19 166 16.33
Apr 29 17 53 16.07
May 28 16 17 14.95
Jun 27 13 6 14.17
Jul 27 12 7 15.03
Aug 28 14 18 16.33
Sep 29 16 29 16.85
Oct 30 18 65 16.93
Nov 29 19 272 16.42
Dec 29 20 313 13.56
The main input variables to execute the 3-PG are: climate (temperature, solar radiation, vapor pressure deficit and rainfall), soil (fertility, texture, water availability); plant (foliage, root and stem biomass at starting age, tree population); and physiological (canopy quantum efficiency, stomatal conductance, etc.). Regarding the climatic variables, the 3-PG can be run for any number of years, using either actual monthly weather data or long-term monthly averages (climate normals). According to Sands & Landsberg (2002), using averages is the normal procedure unless there is particular interest in specific events, such as droughts.
In the 3-PG, the photosynthetically active radiation absorbed by the dossel is determined from leaf area index (LAI) and photosynthetically active radiation (PAR) through the Beer’s law. Next, the quantity of carbon fixed per unit of absorbed radiant energy (photons) is estimated, which represents the canopy quantum efficiency (αC). The value of this conversion efficiency is calculated from a value of theoretical maximum canopy quantum efficiency (αCx) and it also considers, the existence of modulators in which the values vary from zero (high limitation conditions) to 1 (no limitation). These modulators represent the environmental limitations imposed to growth, by the vapour pressure deficit (fVPD), by temperature (fT), by frost (fF), by water availability (fA) and nutritional (fN) and by the stand age (fI).
The C fixed in the photosynthesis, already with all of the environmental limitation considered by the previously described modulators and, removing the maintenance respiration of woody biomass, it is then allocated to different compartments of the plant, by means of allometric relationships established in experimental measurements. From these information, the 3-PG estimates in monthly intervals and, or annual, the “stem”, foliage and roots biomass (t ha-1), average stem diameter at breast height (cm), basal area (m2 ha-1), wood volume (m3 ha-1), annual average increment (m3 ha-1 year-1), leaf area index (LAI) (m2 m-2), soil water balance (mm), the litterfall (t ha-1) and root turnover (t ha-1).
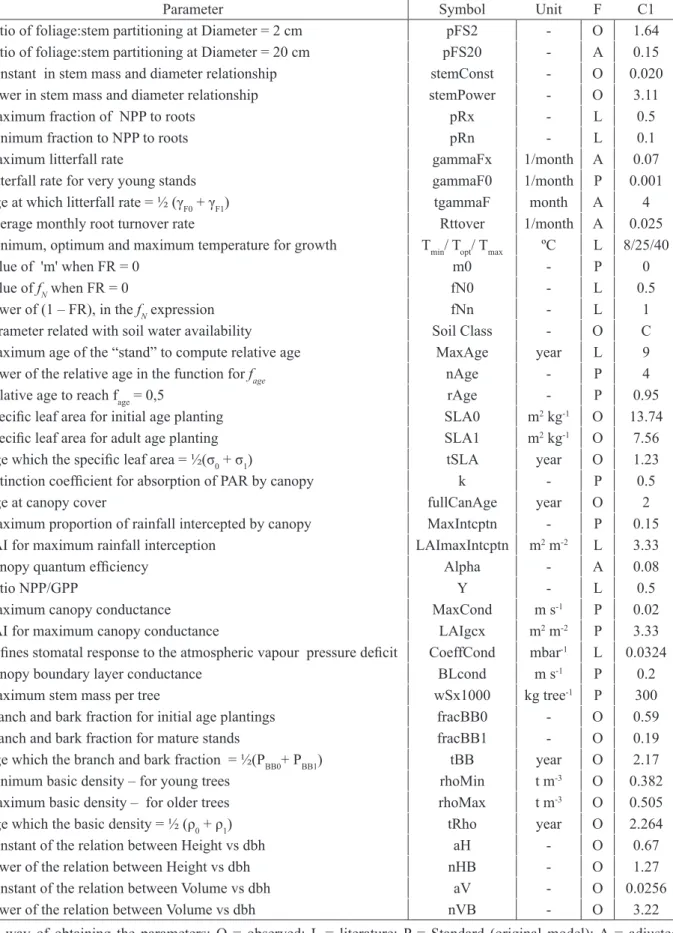
Obtaining the value of the model’s parameter Most values of the parameters and variables applied in the model were obtained from the field measurements (O), data obtained in literature (L) and, or, default parameters values from the original model (P). However, some of the parameters of the model, were also estimated by calibration (A) (SANDS & LANDSBERG, 2002; LANDSBERG et al., 2003;
ALMEIDA et al., 2004b; BUGG et al., 2006). This procedure consists in varying, inside a range of values available in literature, the values of these parameters. Next, the model is run and the data observed in the field measurements is compared, for the area and interest condition, with the data estimated by the model. This procedure is executed until a minimization of the deviations between the estimated values and the observed, thus obtaining the best adjustment for the model.
According to Almeida et al. (2004b), a number of parameters of the 3-PG model can be altered in the calibration process, although the ideal procedure is to use the standard values of the original model, literature data or the best possible empiric value, for as many parameters possible. The main parameters of the model and the way they were obtained in this work are presented on Table 3.
Evaluation of the model’s efficiency
The efficiency of the 3-PG model, in estimating the variables that represent the growth of these stands, was tested by means of simple linear regression. In this stage the regression equations were adjusted between the observed values (O) and the estimated values by the 3-PG (P) (O = β0 + β1 P). Considering that in an ideal hypothetical model, the estimate value by the model is equal to the observed value (O = P), hence β0 = 0 e β1= 1. Thus, it was tested by the t test at 1 % significance, for each situation, the hypothesis of β1 =1, having as theoretical basis the fact that β1 not statistically different from 1, in principle, indicates an adequate treatment given by model to the involved processes in growth.
The capacity of extrapolation and accuracy of the estimates obtained by the 3-PG for plantations in which it was not calibrated to (independent plantations), were evaluated by means of comparison between the estimates obtained by the model, with a confidence interval (1 %) of continuous and pre-cut forest inventory data, for the region.
RESULTS
TABLE 3: List and source of parameters obtained in parameterisation and calibration of 3-PG. TABELA 3: Lista e fonte dos parâmetros obtidos na parametrização e calibração do 3-PG.
Parameter Symbol Unit F C1
Ratio of foliage:stem partitioning at Diameter = 2 cm pFS2 - O 1.64
Ratio of foliage:stem partitioning at Diameter = 20 cm pFS20 - A 0.15
Constant in stem mass and diameter relationship stemConst - O 0.020
Power in stem mass and diameter relationship stemPower - O 3.11
Maximum fraction of NPP to roots pRx - L 0.5
Minimum fraction to NPP to roots pRn - L 0.1
Maximum litterfall rate gammaFx 1/month A 0.07
Litterfall rate for very young stands gammaF0 1/month P 0.001
Age at which litterfall rate = ½ (γF0 + γF1) tgammaF month A 4
Average monthly root turnover rate Rttover 1/month A 0.025
Minimum, optimum and maximum temperature for growth Tmin/ Topt/ Tmax ºC L 8/25/40
Value of 'm' when FR = 0 m0 - P 0
Value of fN when FR = 0 fN0 - L 0.5
Power of (1 – FR), in the fNexpression fNn - L 1
Parameter related with soil water availability Soil Class - O C
Maximum age of the “stand” to compute relative age MaxAge year L 9
Power of the relative age in the function for fage nAge - P 4
Relative age to reach fage = 0,5 rAge - P 0.95
Specific leaf area for initial age planting SLA0 m2 kg-1 O 13.74
Specific leaf area for adult age planting SLA1 m2 kg-1 O 7.56
Age which the specific leaf area = ½(σ0 + σ1) tSLA year O 1.23
Extinction coefficient for absorption of PAR by canopy k - P 0.5
Age at canopy cover fullCanAge year O 2
Maximum proportion of rainfall intercepted by canopy MaxIntcptn - P 0.15
LAI for maximum rainfall interception LAImaxIntcptn m2 m-2 L 3.33
Canopy quantum efficiency Alpha - A 0.08
Ratio NPP/GPP Y - L 0.5
Maximum canopy conductance MaxCond m s-1 P 0.02
LAI for maximum canopy conductance LAIgcx m2 m-2 P 3.33
Defines stomatal response to the atmospheric vapour pressure deficit CoeffCond mbar-1 L 0.0324
Canopy boundary layer conductance BLcond m s-1 P 0.2
Maximum stem mass per tree wSx1000 kg tree-1 P 300
Branch and bark fraction for initial age plantings fracBB0 - O 0.59
Branch and bark fraction for mature stands fracBB1 - O 0.19
Age which the branch and bark fraction = ½(PBB0+ PBB1) tBB year O 2.17
Minimum basic density – for young trees rhoMin t m-3 O 0.382
Maximum basic density – for older trees rhoMax t m-3 O 0.505
Age which the basic density = ½ (ρ0 + ρ1) tRho year O 2.264
Constant of the relation between Height vs dbh aH - O 0.67
Power of the relation between Height vs dbh nHB - O 1.27
Constant of the relation between Volume vs dbh aV - O 0.0256
Power of the relation between Volume vs dbh nVB - O 3.22
In Table 4 linear regressions are presented which describe the relationship between the measured data and the estimates obtained by the 3-PG for six output variables. The high values of R2 of these regressions indicate that the values of the simulated variables explain, in most cases, more than 90 % variance in the observed values on the field. Additionally, the values of β1 do not differ statistically from 1 confirm the good performance of the model in simulating the eucalypt forests growth.
The output variables simulated by the 3-PG and evaluated in this work (some results not shown), are a part of different sub-models that comprise the
3-PG. This approach enables to evaluate whether the treatment given to the processes involved in the forest growth by the model is adequate. Thus, the risk of the model to obtain accurate productivity estimates, but not adequately describing the processes involved in forest growth are minimized (Duursma, 2004).
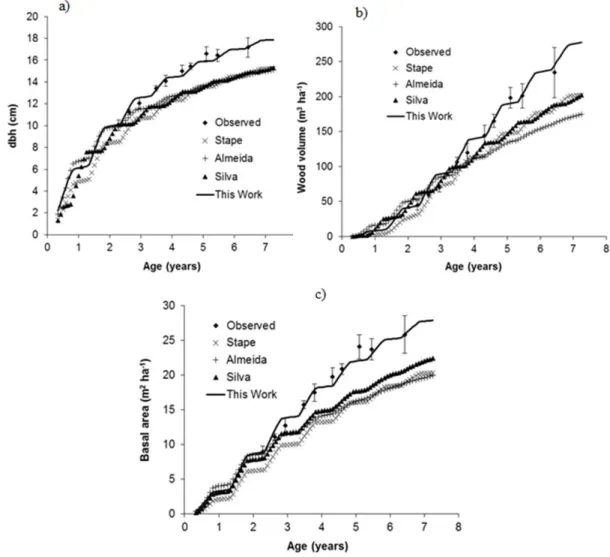
In Figure 3 is presented the evaluation of the extrapolation capacity of the 3-PG and the accuracy of the growth estimates generated by it for plantations in which it was not calibrated to (growth data of independent populations measured in the region). In this figure, it is also shown, the highest accuracy of the growth estimates obtained by the
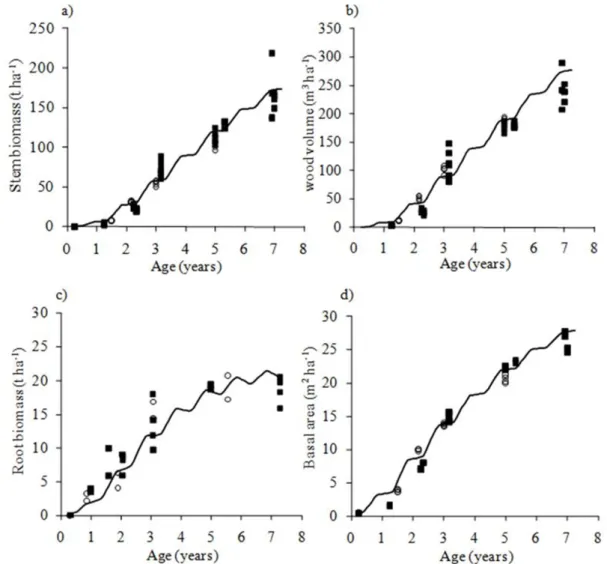
FIGURE 2: Comparison of observed (symbols) and predicted (lines) by 3-PG time course of (a) stem biomass (branches + bark + hardwood) (t ha-1), (b) wood volume (m3 ha-1), (c) root biomass (t ha-1) and (d) basal area (m2 ha-1). In this figure, the open circles represent the measured data in Curvelo and the filled squares the measured data in Itacambira.
TABLE 4: Efficiency statistical analysis of 3-PG model when simulating the eucalypt forests growth in height, basal area, dbh, “stem” biomass, wood volume and root biomass.
TABELA 4: Análise estatística da eficiência do modelo 3-PG ao simular o crescimento de florestas de eucalipto em altura, área basal, dap, biomassa do “tronco”, volume de lenho e biomassa de raiz.
Variable β0 β 1 n R2 Probability
Height - 2.08 1.09 ns 56 0.95 0.01
Basal Area - 0.53 1.00 ns 64 0.98 0.01
dbh - 0.60 1.02 ns 64 0.97 0.01
Stem biomass 0.21 0.96 ns 64 0.96 0.01
Wood Volume - 0.12 0.96 ns 56 0.92 0.01
Root biomass 1.43 0.92 ns 30 0.90 0.01
n = number of data pairs used in the regression equation adjustment; β0 e β1 = coefficients of the adjusted regression equation; R2 = determination coefficient.
FIGURE 3: Estimate for (a) dbh, (b) wood volume and (c) basal area, obtained by different parameterizations of the 3-PG model and compared with confidence limit (1 %) (N = 314 plots) continuous and pre-cut forest inventory data for Cerrado region.
model adjusted in this work, for the plantations in the region of the Cerrado in Minas Gerais state, facing to estimates obtained by other parameterizations of the 3-PG available for Brazil (STAPE et al., 2004; ALMEIDA et al., 2004b; SILVA, 2006).
DISCUSSION
Regarding the parameters obtained in the calibration of 3-PG (maximum quantum efficiency, maximum litterfall rate, root turnover rate, for example), their values are comparable to those found and used in other studies, for example, the Stape (2002). From the efficiency analysis of model (Table 4), it can be concluded that the adjustment of the 3-PG was efficient, since the hypothesis H0: β1 = 1 was not rejected (p>0.01) for neither of the evaluated outputs variables, indicating that the productivity estimates obtained by the 3-PG model present strict correlation, statistically significant, with the data observed in the field measurements. This evaluation of the 3-PG performance, by means of the evaluation of the values obtained for the variables in different sub-models of the 3-PG has enabled to concluded that besides the accurate productivity estimates, the model has also given adequate treatment to the processes involved in the forest growth.
The results presented in this work shows that the set of parameters and variables estimates obtained enable the 3-PG to reproduce, along the years, in the form of the response variables of the model, the growth patterns of eucalypt stands, measured in the Cerrado region in Minas Gerais state and that were used in obtaining the referred parameters.
The test against independent measurements data, comparison between the growth estimates obtained by the 3-PG and the confidence interval (1 %) of the continuous and pre-cut forest inventory data in the region (Figure 3), reported in this study, indicate that the model possesses good extrapolation capacity, is reliable and provides accurate growth estimates in areas which it was not calibrated, agreeing with what was found by Almeida et al. (2004a). They also show that the parameterization and calibration procedures conducted in this work give the 3-PG the capacity to explore a probable performance of forest plantations in areas not explored for this mean yet and, thus supplying information on the possible wood supply of these areas.
Finally, it is worth mentioning that the inferior performance of the other parameterizations of the 3-PG model made in Brazil in simulating the growth of eucalypt forests in the Cerrado region (Figure 3) would indicate the need for site-specific parameterization. In other words, it would lead to believe that the 3-PG adjusted in this work would also have a low performance when applied in regions where each one of the other parameterizations was obtained. However, when we simulated the growth curve in plots of the control treatment (not irrigated) of a fertilization-irrigation experiment in the central-east region of Minas Gerais (SILVA, 2006; LOURENÇO, 2009), it was seen a superior performance of the parameterization of the 3-PG model obtained in this work when compared to the parameterization obtained with the data of the fertilized-irrigated plots of the experiment (data not shown). Thus, a question arises that needs further study: do the parameterizations and calibrations of the 3-PG model obtained in fertilized-irrigated plots (condition of no water and nutrients limitation) are the most adequate to simulate the growth of commercial plantations, or would be the parameterizations obtained in rainfed conditions (as obtained in this work) more indicated in these situations? We have conducted studies to try to answer this question.
Based on what was exposed in this work, it can be affirmed that the 3-PG can be used with good results, to predict the productive potential in terms of wood mass or volume, for planted forests and in new areas not yet explored for commercial means, in the Cerrado region of Minas Gerais state.
CONCLUSIONS
The 3-PG model adjusted in this work is efficient in simulating the growth of eucalypt stands in Cerrado regions of Minas Gerais;
The parameterization and calibration of the 3-PG models made improvements in the model’s performance and resulted in more accurate estimates of eucalypt plantations growth, demonstrating also, the need for caution when using the parameterization made in different conditions from those it will be applied on.
REFERENCES
on Eucalyptus plantation production with 3-PG, a process-based growth model. Forest Ecology and Management [S.I.], v. 259, n. 9, p. 1730-1740, 2010.
ALMEIDA, A. C. et al. Needs and opportunities for using a process-based productivity model as a practical tool in fast growing Eucalyptus plantations. For. Ecol. Manage., v. 193, p. 167– 177, 2004a.
ALMEIDA, A. C. et al. Parameterisation of 3-PG model for fast-growing Eucalyptus grandis plantations. For. Ecol. Manage., v. 193, p. 179– 195, 2004b.
ASSOCIAÇÃO BRASILEIRA DE PRODUTORES DE FLORESTAS PLANTADAS (ABRAF). Anuário estatístico da ABRAF: ano base 2009. Brasília, DF: 2010. 140 p.
BATTAGLIA, M.; SANDS, P. J. Process-based forest productivity models and their application in forest management. For. Ecol. Manage., v. 102, n. 1, p. 13–32, mar. 1998.
BUGG, A. L. et al. Application of three modelling approaches to simulating tree growth in central NSW, Australia. Environmental Modelling e Software, v. 21, p. 310–319, 2006.
COOPS, N. C. et al. Assessing forest productivity in Australia and New Zealand using a physiologically-based model driven with averaged monthly weather data and satellite-derived estimates of canopy productivity. For. Ecol. Manage., v. 104, p. 113-127, 1998.
COOPS, N. C.; WARING, R. H. Assessing forest growth across southwestern Oregon under a range of current and future global change scenarios using a process model, 3-PG. Global Change Biology, v. 7, p. 15-29, 2001.
DU TOIT, B. Effects of site management on growth, biomass partitioning and light use efficiency in a young stand of Eucalyptus grandis in South Africa. Forest Ecology and Management [S.I.], v. 255, n. 7, p. 2324-2336, 2008.
DUURSMA, R. A. A simple process-based model of forest growth, and a test for the Priest River Experimental Forest. 2004. 169 p. Thesis (PhD) – University of Idaho, [S.I], 2004.
DYE, P. J. Verification of 3-PG growth and water-use predictions in twelve Eucalyptus plantations stands in Zululand, South Africa. For. Ecol. Manage., v. 193, p. 197-218, 2004.
ESPREY, L. J. et al. Understanding 3-PG using a sensitivity analysis. For. Ecol. Manage., v. 193, n. 1-2, p. 235-250, 2004.
LANDSBERG, J. J. et al. Performance of the forest productivity model 3-PG applied to a wide range of forest types. For. Ecol. Manage., v. 172, n. 2-3, p. 199-214, 2003.
LANDSBERG, J. J.; WARING, R. H. A generalized model of forest productivity using simplified concepts of radiation-use efficiency, carbon balance and partitioning. For. Ecol. Manage., v. 95, p. 209-228, 1997.
LELES, P. S. S. et al. Crescimento, produção e alocação de matéria seca de Eucalyptus camaldulensis e E. pelita sob diferentes espaçamentos na região dos Cerrados, MG. Scientia Forestalis, v. 59, p. 77-87, jun. 2001. MIEHLE, P. et al. A comparasion of four process-based models and a statistical regression model to predict growth of Eucalytpus globulus plantations. Ecological Modelling, v. 220, n. 5, p. 734–746, Mar. 2009.
RODRÍGUEZ, R. et al. A process-based model to evaluate site quality for Eucalyptus nitens in the Bio-Bio Region of Chile. Forestry, v. 82, n. 2, p. 149 – 163, Jan. 2009.
SANDS, P. J.; LANDSBERG, J. J. Parameterisation of 3-PG for plantation grown Eucalyptus globulus. For. Ecol. Manage., v. 163, p. 273-292, 2002. SILVA, G. G. C. Nutrição, crescimento e sua modelagem em povoamentos de eucalipto em reposta à disponibilidade de água e nutrientes. 2006. 116 p. Tese (Doutorado em solos e nutrição de plantas)-Universidade Federal de Viçosa, Viçosa, 2006.
SOARES, C. P. B. et al. Equações para estimar o estoque de carbono no fuste de árvores individuais e em plantios comerciais de eucalipto. Revista Árvore. Viçosa, v. 29, n. 5, p. 711-718, 2005. STAPE, J. L. et al. Testing the utility of the 3-PG model for growth of Eucalyptus grandis x urophylla with natural and manipulated supplies of water and nutrients. For. Ecol. Manage., v. 193, p. 219-234, 2004.
STAPE, J. L. Production ecology of clonal eucalyptus plantations in northesastern Brazil. 2002. 225 p. Tese (Doutorado)-Colorado State University, Fort Collins, Colorado, 2002.
TICKLE, P. K. et al. Assessing forest productivity at local scales across a native eucalypt forest using the spatial model, 3PG-SPATIAL. For. Ecol. Manage., v. 152, p. 275–291, 2001.
models. Int. J. Biometeorol, v. 46, p. 66–75, 2002. ZHAO, M. et al. Simulating age-related changes in carbon storage and allocation in a Chinese fir