Carlos Pestana Barros & Nicolas Peypoch
A Comparative Analysis of Productivity Change in Italian and Portuguese Airports
WP 006/20U
_________________________________________________________
António Afonso & Christophe Rault
Long-run Determinants of Sovereign Yields
WP 15/2010/DE/UECE
_________________________________________________________
Department of Economics
W
ORKINGP
APERSISSN Nº 0874-4548
School of Economics and Management
Long-run Determinants of Sovereign Yields
*
António Afonso
$and Christophe Rault
#Abstract
We study sovereign bond yields in OECD countries with a dynamic panel by checking for cross-section dependence; assessing panel cointegration; and estimating panel error-correction models. The results show that markets consider budgetary and external imbalances and inflation as relevant determinants of sovereign yields.
Keywords: long-term yields, panel cointegration, bootstrap. JEL: C23, E62, G10, H62.
*
The opinions expressed herein are those of the authors and do not necessarily reflect those of the European Central Bank or the Eurosystem.
$
ISEG/TULisbon - Technical University of Lisbon, Department of Economics; UECE – Research Unit on Complexity and Economics; R. Miguel Lupi 20, 1249-078 Lisbon, Portugal. UECE is supported by FCT (Fundação para a Ciência e a Tecnologia, Portugal). European Central Bank, Directorate General Economics, Kaiserstraße 29, D-60311 Frankfurt am Main, Germany. Emails: [email protected], [email protected].
#
2 1. Introduction
The long-run relationship between fiscal variables and sovereign bond yields
constitutes part of policymakers’ conventional wisdom. Increases in the debt ratio or in
the government deficit ratio may imply an increase in long-term interest rates, by
impinging negatively on credit risk and on the quality of the outstanding debt. Under
such conditions market participants perceive an additional risk stemming from the
loosening of fiscal stance (Ardagna et al., 2004), while liquidity risk also plays a role
notably in times of market unrest (Beber et al., 2009).1 Moreover, fiscal developments
are relevant determinants of sovereign ratings (Afonso et al., 2010).
We assess the long-run determinants of real long-term sovereign yields in the
OECD employing a dynamic panel approach to test for the existence of cointegration.
Furthermore, we also consider cross-country dependence (for instance, common fiscal
behaviour, notably in the European Union, financial markets’ integration and
liberalisation, business cycle synchronization), and estimate a complete panel
error-correction model to uncover the short-run parameters. Results show that budgetary and
external imbalances and inflation determine sovereign yields.
2. Methodology
The specification for the real long-term sovereign yield, r, is
( )
it it it i i it it
r = i −π =α γ+ X +u . (1)
where i is the long-term nominal sovereign yield, π is the inflation rate, and X includes
additional explanatory variables. i denotes the country, t indicates the period, αi stands
for the individual effects for each country i, and the disturbances uit follow the standard
assumptions.
An error-correction form for the real long-term interest rates is given by
1 1 1
1
( ) ( ) ( )
k
it it i j it j it j j it j it it i it it
j
i π α β i − π − θ X − δ i− π − γ X − v
=
∆ − = +
∑
∆ − + ∆ + − − + (2)where the disturbances vit follow the standard assumptions.
Among the several long-run factors influencing the long-term sovereign yields, we
consider the budget balance ratio, the debt ratio, the current account balance ratio, and
inflation.
1
Since with high inflation governments can partially inflate away fiscal
indebtedness, the need for a higher nominal and real long-term bond yields cannot be discarded. Therefore, we build a measure of inflation surprises (πe
) taking the difference
between actual inflation and a 2-year moving average of past inflation.
Moreover, external imbalances are linked to fiscal imbalances, notably when
private savings do not increase sufficiently to offset the effects of higher budget deficits,
therefore, impinging via such channel also on long-term bond yields.
3. Analysis
For the period 1973-2008 we consider the following countries: Austria, Belgium,
Denmark, Finland, France, Germany, Ireland, Italy, Luxembourg, Netherlands,
Portugal, Sweden, Spain, UK, Canada, Japan, and U.S.2
To test for cross-section dependence we use the test of Pesaran (2004) by
computing the Cross section Dependence statistic, and we can reject the null of
cross-section independence. Moreover, using a 2nd generation unit root test from Pesaran
(2007), with the null being the unit root, results support the existence of a unit root in all
series.3
We then apply the bootstrap panel cointegration test of Westerlund and Edgerton
(2007), which accommodates correlation within and between individual cross-sections.
In case of non-rejection of the null, we can assume that there is cointegration between
real long-term interest rates and their determinants.
The asymptotic test results (Table 1) indicate the absence of cointegration.
However, this is computed on the assumption of cross-sectional independence, not the
case in our panel. Consequently, we also used bootstrap critical values. In this case we
conclude that there is a long-run relationship between real long-term interest rates and
their determinants, implying that over the longer run real they move together.
2
Government Bond Yield, IFS 61.Z.F, International Financial Statistics (IFS), IMF. Consumer Price Index, IFS 64.XZF, IFS, IMF. Government debt ratio, 1.0.319.0.UDGGL, European Commission (EC) AMECO. Budget balance-to-GDP ratio, 1.0.319.0.UBLGE, EC AMECO. GDP at market prices, 1.0.0.0.UVGD, EC AMECO. Current Balance, % of GDP, CBGDPR, Balance of Payments, OECD Economic Outlook.
3
4
Table 1 – Panel cointegration between Real Long-Term Interest Rates and determinants (with a constant)
LM-stat Asymptotic p-value
Bootstrap p-value # X1= (Πe, CA, DR) 7.430 0.000 0.840 X2= (Πe, CA, GBR) 7.385 0.000 0.782 Notes: bootstrap based on 2000 replications.
a - null hypothesis: cointegration of Real Long-Term Interest Rates and determinant series. # Test based on Westerlund and Edgerton (2007).
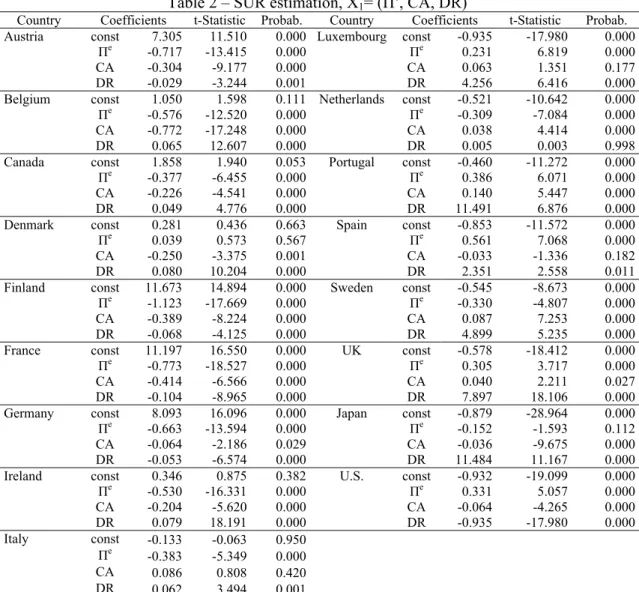
Therefore, we estimate the system of long-run relationships (one by country),
given by equation (1), by the Zellner approach to handle cross-sectional dependence
using the SUR estimator. Results in Table 2 show that real sovereign yields are
statistically and positively affected by changes in the debt ratio in 12 countries. Inflation
has a statistically significant negative effect on real long-term interest rates in ten cases.
Since improvements in the external balance reduce real sovereign yields in ten
countries, the deterioration of current account balances may signal a widening gap
between savings and investment, pushing long-term interest rates upwards. Moreover,
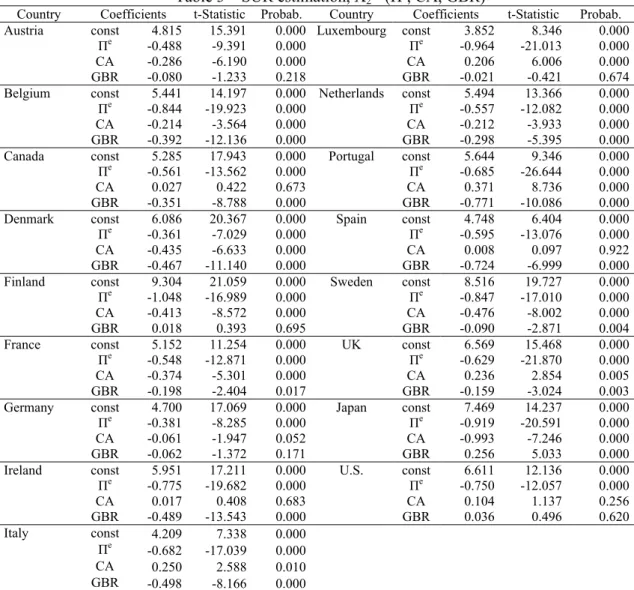
when the budget balance ratio is used (Table 3) a better fiscal balance reduces the real
Table 2 – SUR estimation, X1= (Πe, CA, DR)
Country Coefficients t-Statistic Probab. Country Coefficients t-Statistic Probab. Austria const 7.305 11.510 0.000 Luxembourg const -0.935 -17.980 0.000
Πe
-0.717 -13.415 0.000 Πe 0.231 6.819 0.000 CA -0.304 -9.177 0.000 CA 0.063 1.351 0.177 DR -0.029 -3.244 0.001 DR 4.256 6.416 0.000 Belgium const 1.050 1.598 0.111 Netherlands const -0.521 -10.642 0.000
Πe
-0.576 -12.520 0.000 Πe -0.309 -7.084 0.000 CA -0.772 -17.248 0.000 CA 0.038 4.414 0.000 DR 0.065 12.607 0.000 DR 0.005 0.003 0.998 Canada const 1.858 1.940 0.053 Portugal const -0.460 -11.272 0.000
Πe
-0.377 -6.455 0.000 Πe 0.386 6.071 0.000 CA -0.226 -4.541 0.000 CA 0.140 5.447 0.000 DR 0.049 4.776 0.000 DR 11.491 6.876 0.000 Denmark const 0.281 0.436 0.663 Spain const -0.853 -11.572 0.000
Πe
0.039 0.573 0.567 Πe 0.561 7.068 0.000 CA -0.250 -3.375 0.001 CA -0.033 -1.336 0.182 DR 0.080 10.204 0.000 DR 2.351 2.558 0.011 Finland const 11.673 14.894 0.000 Sweden const -0.545 -8.673 0.000
Πe
-1.123 -17.669 0.000 Πe -0.330 -4.807 0.000 CA -0.389 -8.224 0.000 CA 0.087 7.253 0.000 DR -0.068 -4.125 0.000 DR 4.899 5.235 0.000 France const 11.197 16.550 0.000 UK const -0.578 -18.412 0.000
Πe -0.773 -18.527 0.000 Πe 0.305 3.717 0.000 CA -0.414 -6.566 0.000 CA 0.040 2.211 0.027 DR -0.104 -8.965 0.000 DR 7.897 18.106 0.000 Germany const 8.093 16.096 0.000 Japan const -0.879 -28.964 0.000
Πe
-0.663 -13.594 0.000 Πe -0.152 -1.593 0.112 CA -0.064 -2.186 0.029 CA -0.036 -9.675 0.000 DR -0.053 -6.574 0.000 DR 11.484 11.167 0.000 Ireland const 0.346 0.875 0.382 U.S. const -0.932 -19.099 0.000
Πe
-0.530 -16.331 0.000 Πe 0.331 5.057 0.000 CA -0.204 -5.620 0.000 CA -0.064 -4.265 0.000 DR 0.079 18.191 0.000 DR -0.935 -17.980 0.000 Italy const -0.133 -0.063 0.950
Πe
-0.383 -5.349 0.000 CA 0.086 0.808 0.420 DR 0.062 3.494 0.001
6
Table 3 – SUR estimation, X2= (Πe, CA, GBR)
Country Coefficients t-Statistic Probab. Country Coefficients t-Statistic Probab. Austria const 4.815 15.391 0.000 Luxembourg const 3.852 8.346 0.000
Πe
-0.488 -9.391 0.000 Πe -0.964 -21.013 0.000 CA -0.286 -6.190 0.000 CA 0.206 6.006 0.000 GBR -0.080 -1.233 0.218 GBR -0.021 -0.421 0.674 Belgium const 5.441 14.197 0.000 Netherlands const 5.494 13.366 0.000
Πe
-0.844 -19.923 0.000 Πe -0.557 -12.082 0.000 CA -0.214 -3.564 0.000 CA -0.212 -3.933 0.000 GBR -0.392 -12.136 0.000 GBR -0.298 -5.395 0.000 Canada const 5.285 17.943 0.000 Portugal const 5.644 9.346 0.000
Πe
-0.561 -13.562 0.000 Πe -0.685 -26.644 0.000 CA 0.027 0.422 0.673 CA 0.371 8.736 0.000 GBR -0.351 -8.788 0.000 GBR -0.771 -10.086 0.000 Denmark const 6.086 20.367 0.000 Spain const 4.748 6.404 0.000
Πe
-0.361 -7.029 0.000 Πe -0.595 -13.076 0.000 CA -0.435 -6.633 0.000 CA 0.008 0.097 0.922 GBR -0.467 -11.140 0.000 GBR -0.724 -6.999 0.000 Finland const 9.304 21.059 0.000 Sweden const 8.516 19.727 0.000
Πe
-1.048 -16.989 0.000 Πe -0.847 -17.010 0.000 CA -0.413 -8.572 0.000 CA -0.476 -8.002 0.000 GBR 0.018 0.393 0.695 GBR -0.090 -2.871 0.004 France const 5.152 11.254 0.000 UK const 6.569 15.468 0.000
Πe -0.548 -12.871 0.000 Πe -0.629 -21.870 0.000 CA -0.374 -5.301 0.000 CA 0.236 2.854 0.005 GBR -0.198 -2.404 0.017 GBR -0.159 -3.024 0.003 Germany const 4.700 17.069 0.000 Japan const 7.469 14.237 0.000
Πe
-0.381 -8.285 0.000 Πe -0.919 -20.591 0.000 CA -0.061 -1.947 0.052 CA -0.993 -7.246 0.000 GBR -0.062 -1.372 0.171 GBR 0.256 5.033 0.000 Ireland const 5.951 17.211 0.000 U.S. const 6.611 12.136 0.000
Πe
-0.775 -19.682 0.000 Πe -0.750 -12.057 0.000 CA 0.017 0.408 0.683 CA 0.104 1.137 0.256 GBR -0.489 -13.543 0.000 GBR 0.036 0.496 0.620 Italy const 4.209 7.338 0.000
Πe
-0.682 -17.039 0.000 CA 0.250 2.588 0.010 GBR -0.498 -8.166 0.000
Note: linear estimation after one-step weighting matrix. Balanced system, total observations: 612.
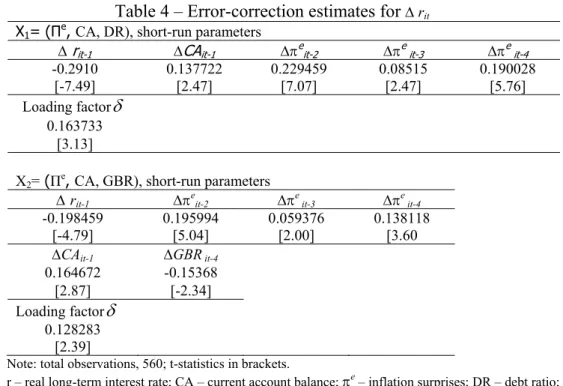
To estimate the complete panel error-correction model given in (2) we recover
from each of the cointegration relations the estimated coefficients to construct the
residual quantity ( iit −πit)−γiXit. Afterwards, we estimate a complete VAR in first
differences, with country effects, αi, with the necessary lags of the abovementioned
residual variable. The lag length structure k is chosen using the Schwarz and
Hannan-Quinn selection criteria, and by carrying out a standard likelihood ratio testing-down
type procedure, to examine the lag significance from a long-lag structure (started with
k=6) to a more parsimonious one. In order to improve the statistical specification of the
model, we systematically implemented Wald tests of exclusion of variables from the
short-run dynamic (not reported here) to eliminate insignificant short-run estimates at
the 5% level. The results of the estimations using Full Information Maximum
Table 4 – Error-correction estimates for ∆ rit
X1= (Πe, CA, DR), short-run parameters
∆ rit-1 ∆CAit-1 ∆πeit-2 ∆πeit-3 ∆πe it-4
-0.2910 0.137722 0.229459 0.08515 0.190028 [-7.49] [2.47] [7.07] [2.47] [5.76] Loading factorδ
0.163733 [3.13]
X2= (Πe,
CA, GBR), short-run parameters
∆rit-1 ∆πeit-2 ∆πeit-3 ∆πeit-4
-0.198459 0.195994 0.059376 0.138118
[-4.79] [5.04] [2.00] [3.60
∆CAit-1 ∆GBRit-4
0.164672 -0.15368 [2.87] [-2.34] Loading factorδ
0.128283 [2.39]
Note: total observations, 560; t-statistics in brackets.
r – real long-term interest rate; CA – current account balance; πe – inflation surprises; DR – debt ratio; GBR – budget balance ratio.
Inflation has a significant short-run effect on real long-term sovereign yields, and
a fall in inflation would imply a decline in real rates. Interestingly, the long-run effect
associated with the panel results (Table 4), can in this case be computed to be around
-0.4. This is in line with the long-run cointegration relationship reported for the countries
in the previous SUR analysis, and implies that an increase in inflation surprises of 1
percentage point could lead to a long-run decline of around 0.4 percentage point in the
real long-term interest rate. Regarding the short-run effects of the fiscal determinants, an
improvement of the government budget balance also reduces the real interest rate.
4. Conclusion
We studied the long-run behaviour of sovereign yields for OECD countries, for
the period 1973-2008. The use of a dynamic panel approach allowed to reflect financial
and economic integration, and to increase the performance and accuracy of the tests. In
this framework, cross-country dependences in the sovereign bond segment of the capital
markets were also taken into account.
We rejected cross-section independence for the real long-term interest rates (and
for its determinants). From an economic point of view such cross-section dependence
8
with 2nd generation panel unit root tests that all the series in the panel are I(1), we
undertook a bootstrap panel cointegration analysis.
Finally, our analysis shows that better government budget balances mostly reduce
real sovereign yields, while higher sovereign indebtedness increases them. Additionally,
deteriorating current account balances, signalling a widening gap between savings and
investment, push sovereign yields upwards.
References
Afonso, A.; Gomes, P., Rother, P. 2010. Short- and Long-run Determinants of
Sovereign Debt Credit Ratings. International Journal of Finance and Economics,
forthcoming, doi: 10.1002/ijfe.416.
Ardagna, S., Caselli, F. and Lane, T. 2004. Fiscal Discipline and the Cost of Public
Debt Service: Some Estimates for OECD Countries. ECB WP 411.
Beber, A., Brandt, M. and Kavajecz, K. 2009. Flight-to-Quality or Flight-to-Liquidity?
Evidence from the Euro-Area Bond Market. Review of Financial Studies, 22 (3),
925-957.
Codogno, L., Favero, C., Missale, A. 2003. Yield spreads on EMU government bonds.
Economic Policy 18, 211-235.
Laubach, T. 2009. New Evidence on the Interest Rate Effects of Budget Deficits and
Debt. Journal of the European Economic Association, 7 (4), 1-28.
Orr, A., Edey, M. and Kennedy, M. 1995. Real Long-Term Interest Rates: The
Evidence from Pooled Time-Series. OECD Economic Studies, 25, 45-107.
Pesaran, M. 2004. General Diagnostic Tests for Cross Section Dependence in Panels.
CESifo WP 1229.
Pesaran, M. 2007. A Simple Panel Unit Root Test in the Presence of Cross-Section
Dependence. Journal of Applied Econometrics, 22, 265-312.
Smith, V., Leybourne, S. and Kim, T.-H. 2004. More Powerful Panel Unit Root Tests
with an Application to the Mean Reversion in Real Exchange Rates. Journal of
Applied Econometrics 19, 147–170.
Westerlund, J. and Edgerton, D. 2007. A Panel Bootstrap Cointegration Test.