Carlos Pestana Barros & Nicolas Peypoch
A Comparative Analysis of Productivity Change in Italian and Portuguese Airports
WP 006/2007/DE _________________________________________________________
Rossana Lott Rodrigues, João Carlos Lopes, João Dias & Antonio Carlos Moretto
Structural changes and external vulnerabilities in the Brazilian economy: 1995-2009
WP 13/2013/DE/UECE _________________________________________________________
Department of Economics
W
ORKINGP
APERSISSN Nº 0874-4548
Rossana Lott Rodrigues2 João Carlos Lopes3
João Dias4
Antonio Carlos Moretto5
Abstract: From the 1990s, the reorientation of the development model, which switched from protective of industrial sector to intensifier of the trade liberalization process, brought the need for reorganization of large productive sectors of the Brazilian economy, were openly forced to face global competitors, within the established international conditions. Thus, during the 1990s, the Brazilian economy experienced a period of fast and deep changes, combining the process of intensification of trade liberalization with a view of industrial and technological policy which combines sectoral and systemic dimension, with privatization of important sec-tors of the economy (such as electricity and telecommunications secsec-tors), and a stabilization program (Real Plan), based on a fixed exchange rate, with important effects on the whole economy. This article aims to assess the evolution of external vulnerability and structural changes in terms of generating value added in the Brazilian economy in the period 1995-2009, subdivided into three sub-periods, namely 1995-2000, 2000-2005 and 2005 -2009, by means of a novel treatment of the inter-sectoral output multipliers. The data base was the annual in-put-output matrices from Brazil for 1995, 2000, 2005 and 2009, structured into 42 sectors. The main results indicated a very satisfactory behavior of the national economy over time, with a predominance of positive gains in the ability to generate value added and lower imports of intermediate inputs by the most technologically advanced industries and by services, and fewer losses and greater external dependence for the minority of sectors, particularly in recent years.
Key words: Structural changes, external vulnerabilities, regional economy.
1. INTRODUCTION
From the 1990s, the reorientation of the development model, which switched from
protective of industrial sector to intensifier of the trade liberalization process, brought the
need for reorganization of large productive sectors of the Brazilian economy, were openly
forced to face global competitors, within the established international conditions.
Thus, during the 1990s, the Brazilian economy experienced a period of fast and
deep structural changes, combining the process of intensification of trade liberalization with a
1
Acknowledgments. This paper was prepared during a post doc program of Rossana Lott Rodrigues and Anto-nio Carlos Moretto in UECE, a research center supported by FCT (Fundação para a Ciência e a Tecnologia). These authors acknowledge the financial support of the State University of Londrina, Brazil, during the post doc.
2
Department of Economic- State University of Londrina - UEL. E-mail address: [email protected]
3
School of Economics and Management- ISEG - Technical University of Lisbon - UTL, and Research Unit on Complexity and Economics – UECE. E-mail address: [email protected]
4
School of Economics and Management- ISEG - Technical University of Lisbon - UTL, and Research Unit on Complexity and Economics – UECE. E-mail address: [email protected]
5
view of industrial and technological policy which combines sectoral and systemic dimension,
with privatization of important sectors of the economy (such as electricity and
telecommuni-cations sectors), and a stabilization program (Real Plan), based on a fixed exchange rate, with
important effects on the whole economy.
The substantial adjustments promoted by the Brazilian industry in the 1990s were
more than production and employment. The qualification, productivity, and wages, also
ad-justed in response to the intensification of trade liberalization in progress from the beginning
of the decade. There is every indication that these events result from the effects of the
restruc-turing production process of the domestic industry, based primarily on the implementation of
modern management techniques and quality control and on adoption of technology towards
skilled labor.
Another issue that emerges from this process and worries researchers is the
con-centration movement, both in the productive and in assets fields (mergers, acquisitions, entry
of large oligopolistic firms in the market, expanding production scales, etc.), involving even a
regional dimension, with sub-national government (state) adopting industrial policies
embod-ied in aggressive strategies to attract investments and increasing its already significant share
in the national and/or state GDP [VASCOCELOS; CASTRO (1999) and BONELLI; VEIGA
(2003)]. Accordingly, at the regional level, the responses to changes in the 1990s, although
moving in the same direction, present particular aspects due to its own characteristics.
According to Giambiagi et al. (2005), from 1999 the country began a short
pro-cess of growth interrupted by the Brazilian energy crisis, by the contagion of the Argentine
crisis and by the terrorist attacks of September 11, 2001 in the United States. With cuts of
20% in energy demand in 2001 compared to the previous year, the national energy crisis
re-sulted in three consecutive quarters of GDP decline in 2001. The contagion of the Argentine
crisis reduced capital inflows in Brazil, while the terrorist attacks shook the international
mar-kets.
In the period between 2003 and 2008, according to the Dating Committee of
Eco-nomic Cycles (CODACE, 2009), the Brazilian economy experienced continued expansion of
GDP, with cumulative growth of 30%. In the labor market was observed considerable raise in
the formalization of labor relations and clear downward trend in unemployment rate
(COR-SEUIL; FOGUEL, 2011).
Nevertheless, the international financial crisis of 2008 shook, temporarily, the
tra-jectory of national economic growth. The impacts were particularly hard during the last
a sharp drop in commodity prices, which resulted in the devaluation of the Real against the
U.S. dollar and the deterioration of the indicators of economic activity and employment
(MINISTÉRIO DA FAZENDA, 2010).
However, the continued growth was guaranteed by the soundness of fiscal and
monetary fundamentals which were pursued over the period. The economy began to grow,
generating significant primary surpluses of public accounts and inflation controlled by the
target system. Instead of getting into debt in order to grow, Brazil began to expand with debt
reduction (MINISTÉRIO DA FAZENDA, 2010).
Given this path of 14 years of the national economy and despite the existence of a
vast literature devoted to its evaluation in several aspects, makes it interesting to study, at
sec-toral level, external vulnerability and ability to generate value added of national economy in
the period from 1995-2009 by means of a new treatment of the inter-sector production
multi-pliers.
Therefore, the objective of this research is to evaluate the evolution of external
dependence and changes in terms of generating value added of sectors of the Brazilian
econ-omy in the period from 1995-2009, subdivided in to three sub-periods, namely 1995-2000 and
2000-2005 and 2005-2009. Specifically aiming at:
- quantifying then net growth effect resulting from the variation of the value added generated
in the sectors during the period;
- quantifying the external dependence effect resulting from the import of inputs by the sectors
in the period;
- classifying the sectors according to these effects;
- providing a set of indicators to support the planning of both national public policies and
pri-vate actions.
Besides this introduction, the article is divided in to four parts. The second
de-scribes the methods and data, while the third discusses the results. The fourth and last part
presents the concluding remarks and suggestions for future researches.
2. METHODS AND DATA
2.1. Source of data
For this study were used the annual input-output matrices from Brazil for 1995,
2000, 2005 and 2009, structured into 42 sectors, and estimated by Guilhoto and Sesso Filho
2.2. Theoretical Foundation
2.2.1. Sectoral linkages indices
The analysis of intersectoral relations of a given economy is based on the fact that
the products can be used by both industries, as intermediate inputs, as well as consumers, to
attend the needs of final demand. Whereas in the input-output model, final demand is
auton-omous, it becomes possible to determine the amount to be produced in each sector and the
relative intensity of transactions in different industries, in other words, intersectoral links.
In the literature, several methods are reported that aim to measure the intersectoral
links in order to identify key sectors, in the definition of Rasmussen (1956) and Hirschman
(1958), or growth poles according to Perroux (1977) and Myrdal (1957).
From the spatial or regional point of view, the search for development, since
1950, has attracted considerable interest in the concept of 'links' as a means to identify key
sectors for the promotion of industrial development strategies. It is believed that the
concen-tration of resources, especially capital and entrepreneurial ability in key sectors would enable
faster growth of output and employment than if they were allocated in other sectors
(McGilvray, 1977).
Although there is consensus regarding the importance of intersectoral linkages in
determining stimulus to economic growth and regarding the fact that the process of economic
transformation is often stimulated by the relatively small number of sectors, seems to be little
agreement regarding identification of key sectors. For McGilvray (1977), factors that play a
dominant role in the development process of the countries, as trade patterns and international
competitiveness, availability of natural resources, skill/talent business and technology, are not
explicitly recognized when seeking to determine sectors key. According to Guilhoto et al.
(1994), part of the confusion is due to the difficulty in identifying what are the sectors that
contribute above average for the economy, in an ex-post and ex-ante view.
Based on Guilhoto et al. (1994) proposal to consider the various available
meth-ods for measuring linkages index as complementary in the analysis of a particular economy,
which would determine key sectors in a more balanced and broad, and considering the
linkag-es index that can be derived from input-output tabllinkag-es as a first step in identifying potential
areas of development projects (McGilvray, 1977), are exposed, in this section, the methods
used to identify sectors that more become dynamic an economy6.
6
2.2.1.1 The Rasmussen-Hirschman index
The Rasmussen-Hirschman indices linkages have been very applied and discussed
in the literature by McGilvray (1977), Hewings (1982), Guilhoto et al. (1994), among others.
These measures, originally devised by Rasmussen (1956), were used as a means of
identify-ing key sections by Hirschman (1958).
Considering the internal structure of the economy based on input-output model
and following the last two authors, one may determine the sectors that have greater power
chaining within the economy. In other words, one can calculate the backward linkages index,
which estimate how much an industry demand from the other sectors, and the forward
linkag-es index, which tell how much an industry is demanded by others.
Thus, based on the Leontief inverse matrix (Leontief, 1986) given by the equation
B = (I - A) -1, with bij defined as an element of this matrix B, B* as the average of all elements
of L e Lj e Lias the sum of a column and a typical line B, given respectively as:
n
i ij
j l
L
1
e
n
j ij
i l
L
1
i, j=1,2,...n (2.1)
So:
Backward linkage index (power of dispersion):
*/ /n L L
Uj j (2.2)
Forward linkage index (sensitivity of dispersion):
*/ /n L L
Ui i (2.3)
For Rasmussen and Hirschman, values greater than 1, both backward and forward
linkages index, indicate above average sectors and, therefore, key sectors for economic
growth.
Particularly considering the backward linkage index, these indicators show the
ef-fect of a unit change in final demand of sector j on the production of all sectors. The higher
the value of these coefficients, the greater the impact of the change in final demand sector j
and over all others.
2.2.1.2. Net growth (or efficiency) and external dependency effects
The Rasmussen-Hirschman backward linkage indicators can be used to evaluate
both the gains in the capacity of an economy to generate value added as well as the changes in
(2011).
In this context, and following the methodology showed by this authors, the
col-umn sums of the Leontief inverse matrix (backward linkage indices) allows to evaluate the
effect on the total product resulting from the increases by one unity in final demand of each
sector, which can be divided in three terms: interindustry flows, value-added and imported
inputs7. Furthermore, an important property applies, that is the sum of the last two terms is
equal to unity, exactly the value of the initial stimulus (exogenous). This is why, in
equilibri-um, the total value of final demand sector is equal to the gross value added plus imported
in-puts from all sectors.
From this property, and after a convenient arrangement of these terms, the
evolu-tion of backward linkage indices, value added and imported input coefficients over time can
be used to detect structural changes in the economy.
In other words, one can quantify the capacity to generate more or less value added
by unit of final demand, call for Amaral, Lopes e Dias (2010) as an ‘efficiency effect’ or ‘net
growth effect’, and the necessity to import more or less intermediate inputs, for the authors
certain kind of ‘external dependency effect’. Besides, one can classify the productive sectors
according to a particular combination of both effects, finding a new kind of 'key sectors',
those presenting a positive 'efficiency' change and negative 'dependency change.
Thus, considering a unitary increase in j sector’s final demand, ∆ yj = 1, its effects
on total production are:
∑ ∆X ∑ b b (2.4) By the equilibrium condition between total sectoral final demand and total
prima-ry inputs, we have:
∆yj = 1 => ∆(Σi vi + Σi mi) = 1 (2.5)
where vi and mi are the value added and the value of imported inputs used by sector I,
re-spectively.
Defining and assuming as constants the value-added coefficients (a = vi/xi) as
well as the imported inputs coefficients (a = mi/xi), we have:
1 = Σibija + Σibija (2.6)
Dividing both sides of (2.6) by b0j:
1/b0j = Σi (bija ) / Σibij + Σi (bija ) / Σibij, (2.7)
and, representing by v*j and m*j the terms in the right hand side of (2.7) (the weighted
7
age of value-added and imported inputs coefficients, respectively), we arrive finally at:
1 = b0j (v∗+ m∗) (2.8)
The expression (2.8) can be used as in a dynamic or as in a comparative static to
detect and quantify the changes in the productive structure of an economy. In the present
pa-per, (2.8) will be used in a comparative static.
Suppose that, for each sector j, we have, between two given years, a decrease in
b0j. This means that, in order to satisfy a unitary increase in sector j final demand it is
neces-sary a smaller increase in the global production of the economy. In this case, we must have
∆m*j+∆v*j > 0, and so four situations are possible in a two dimensional space with axes ∆v*j
and ∆m*j:
-when ∆ v*j > 0 and ∆ m*j < 0, the decrease in b0j goes with a larger capacity to generate
val-ue added (a beneficial ‘net’ growth effect) and a lower necessity of imported inputs (a reduced
external dependency effect) – let’s call this area A, the most virtuous one;
-if ∆v*j > 0, ∆m*j > 0 and ∆v*j/∆ m*j > 1, there is a simultaneous increase in ‘net growth
ef-fect’ and ‘external dependency’, with the first dominating the second (area B);
-with ∆m*j > 0, ∆ v*j > 0, but ∆m*j/∆ v*j > 1, the increase in ‘external dependency’ is
rela-tively more significant than the increase in ‘net growth effect’ (area C);
-finally, with ∆m*j > 0 and ∆ v*j < 0, the decrease in b0j is totally due to an increase in
‘exter-nal dependency’, with a simultaneous decrease in the capacity to generate value added (area
D, the most disadvantageous situation).
For the case of a b0j increase we must have ∆m*j+∆v*j < 0, a worse situation for
the economy, at least from the ‘capacity to generate more value added’ point of view. The
four possible areas now are (in a descending order):
-Area A’: ∆v*j > 0 and ∆ m*j < 0, with ∆ v*j < |∆m*j|
-Area B’: ∆v*j < 0 and ∆ m*j < 0, with |∆ v*j| < |∆m*j|
-Area C’: ∆v*j < 0 and ∆ m*j < 0, with |∆ v*j| > |∆m*j|
-Area D’: ∆v*j < 0 and ∆ m*j > 0, with |∆ v*j| > ∆m*j
3. RESULTS AND DISCUSSION
With the application of the method described above for the Brazilian economy in
the period from 1995-2009, divided into three periods, namely, 1995-2000, 2000-2005 and
2005-2009, and using the input-output matrices for1995, 2000, 2005 and 2009 with 42 sectors
the results presented in Tables 1-6 is a significant improvement and maturation of the
Brazili-an productive system between 1995 Brazili-and 2009 considering the Brazili-analyzed aspects. In other
words, a smaller number of sectors started to require large increase in the overall production
of the economy to raise their final demands in one unit at the same time that most sectors
re-duced their external dependence for imported inputs.
The increase in the number of sectors that could increase their final demands in a
unit with a small increase in global production and that reduced the need for imported inputs
for the production process reflects the improvement in the production pattern of the national
economy as well as its diversification and capacity to compete with foreign economy within
the trade liberalization process underway in the country. Thus, from 1995 to 2009, the number
of sectors with these characteristics increased from 13 to 32, as shown in following Tables.
The observation of the results separately by sub-period may reveal a reality that,
at first sight, seems less positive. However, the evaluation of the results in this way makes it
possible to check in detail the evolution of the national productive structure, of the generated
value added and of the external dependence confronted with the policies adopted over the
period and observe their virtuous path in response to the changes that occurred not only in
Brazil, but that is common to several countries.
The scenario that precedes the period from 1995-2000 comes from the
post-implantation of the Real Plan in 1994, when the country stabilized the price level growth,
started to adopt fixed and valued exchange rate regime and initiated a period of deep
structur-al reforms, with the economy showing moderate rates of growth. According to Camargo
(2006), from then on, the pattern of structural functioning of the national economic system
was changed, extending the range of planning of private decisions and making the potential
consumer repressed by recessions and high inflation from previous periods rise again.
In the short term, the change of exchange rate regime worsened the
unemploy-ment situation in the country, mainly because of the low growth of the period, given the deep
structural reforms which the country experienced with the implementation of the Real Plan
and the intensification process of commercial opening in course. The reduction of tariffs and
the exchange rate overvaluation changed relative prices in favor of imported goods, leading to
industry reorganization, changes in technology, organization of work and unemployment
(CACCIAMALI, 2000). Added to this scenario is the Mexican crisis of the late 1994 which
The period from 1995/98 maintained the fixed exchange rate regime and the
ap-preciation of the national currency, with deficits in the trade balance and high interest rates,
which prevented the achievement of macroeconomic stability and return to growth.
During this period, the international financial market was the scene of two other
important crises, which harmed Brazil due to the reduced flow of foreign loans. The first
cri-sis in 1997, in Asian countries, initially originated in Thailand, spread to South Korea,
Indo-nesia and Malaysia, and the second in Russia in 1998 (GIAMBIAGI et al., 2005).
In January 1999 floating exchange rate with a temporary rise in interest rates
be-gan to be adopted, which came to be gradually reduced (BRESSER-PEREIRA, 2005), and
there was an improvement in the trade balance (BAER, 1996 and GREMAUD et al.2005).
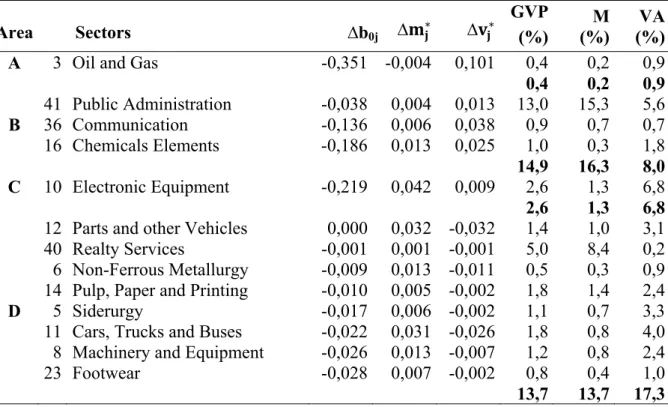
In this context, the results showed, for the first sub-period, 1995-2000, that there
were fewer sectors with negative variation of b0j, 13, than with positive variation of b0j, 29
(Tables 1 and 2). The behavior of this coefficient reveals the biggest or smallest capacity to
generate sectoral value added, respectively. For sectors with negative variation of b0j only Oil
and Gas (3) is located on Area A, the most beneficial to the economy as it has, in addition to
greater net growth effect, less external dependence. However, this sector wasn’t important in
terms of share of total production, accounting for only 0.4% of the gross value of production
in the period from 1995-2000.
Between the period from 1995-2000, the largest number of sectors with negative
variation of b0j, 8, was located on area D, which shows increased external dependence and
simultaneous decrease in the ability to generate value added (Table 1 and Figure 1). It is
worth emphasizing that in this area are located many important sectors for economic growth,
as Parts and other Vehicles (12), Non-ferrous Metallurgy (6), Siderurgy (5) Cars, trucks and
buses (11), Machinery and Equipment (8) Footwear (23), among others, sectors strongly
af-fected by trade liberalization and the appreciation of the exchange rate after the Real Plan.
Areas B and C of Table 1 are intermediate. On area B are located 3 sectors, Public
Administration (41) Communications (36) and Chemical Elements (16), which showed
be-tween 1995 and 2000, both increase inability to generate value added and rise in external
de-pendence, predominantly the first one. Area C was represented only by Electrical Equipment
Table 1. Distribution of sectors in areas with Δb0j < 0, and sectoral share in gross value of production (GVP), imports (M) and the value added (VA), Brazil, 1995-2000.
Area Sectors ∆b0j ∆ ∗ ∆ ∗
GVP (%)
M (%)
VA (%) A 3 Oil and Gas -0,351 -0,004 0,101 0,4 0,2 0,9 0,4 0,2 0,9 41 Public Administration -0,038 0,004 0,013 13,0 15,3 5,6 B 36 Communication -0,136 0,006 0,038 0,9 0,7 0,7 16 Chemicals Elements -0,186 0,013 0,025 1,0 0,3 1,8 14,9 16,3 8,0 C 10 Electronic Equipment -0,219 0,042 0,009 2,6 1,3 6,8 2,6 1,3 6,8 12 Parts and other Vehicles 0,000 0,032 -0,032 1,4 1,0 3,1 40 Realty Services -0,001 0,001 -0,001 5,0 8,4 0,2 6 Non-Ferrous Metallurgy -0,009 0,013 -0,011 0,5 0,3 0,9 14 Pulp, Paper and Printing -0,010 0,005 -0,002 1,8 1,4 2,4 D 5 Siderurgy -0,017 0,006 -0,002 1,1 0,7 3,3 11 Cars, Trucks and Buses -0,022 0,031 -0,026 1,8 0,8 4,0 8 Machinery and Equipment -0,026 0,013 -0,007 1,2 0,8 2,4 23 Footwear -0,028 0,007 -0,002 0,8 0,4 1,0 13,7 13,7 17,3 Source: Elaborated by authors.
Figure 1. Sectoral distribution with negative variation of b0j, Brasil, 1995-2000.
Source: Source: Elaborated by authors. -0,040
-0,020 0,000 0,020 0,040 0,060 0,080 0,100 0,120
-0,010 0,000 0,010 0,020 0,030 0,040 0,050
∆v∗
∆m∗
3
14 5 23
8 6
11 12
10 16
36
41
40
A
B
C
Among the sectors with positive variation of b0j none was found in the area with
positive variation of the capacity to generate more value added and less need for imported
inputs (A') and 28 were on area D', the least beneficial to the economy since the sectors there
classified showed, besides greater external dependence, dominance of lower net growth effect
(Table 2 and Figure 2).
Table 2. Distribution of sectors in areas with Δb0j> 0, and sectoral share in gross value of production (GVP), imports (M) and value added (VA), Brazil, 1995-2000.
Area Sectors ∆b0j ∆ ∗ ∆ ∗
GVP (%)
M (%)
VA (%) C' 17 Oil Refining 0,168 -0,002 -0,033 2,6 1,2 13,0 2,6 1,2 13,0 29 Vegetal Oil 0,276 0,003 -0,051 0,8 0,3 1,0 25 Vegetal Products 0,191 0,028 -0,070 0,5 0,3 0,5 9 Electrical Equipment 0,183 0,023 -0,069 1,1 0,9 2,1 37 Financial Institution 0,182 0,008 -0,080 7,4 8,7 2,3 21 Textile Industry 0,160 0,001 -0,045 1,3 1,1 2,9 28 Sugar Products 0,135 0,007 -0,029 0,6 0,2 0,3 13 Wood and Wood Products 0,131 0,012 -0,051 1,3 1,2 1,0 27 Dairy Products 0,128 0,008 -0,033 0,8 0,4 0,4 26 Meat Products 0,128 0,005 -0,030 1,3 0,6 0,7 20 Plastics 0,108 0,018 -0,042 0,9 0,6 2,7 19 Pharmaceutical and Veterinary 0,105 0,012 -0,044 1,3 1,2 1,9 7 Other Metal Products 0,101 0,013 -0,040 1,2 1,1 1,9 24 Coffee Products 0,095 0,008 -0,026 0,2 0,1 0,0 D' 15 Rubber 0,094 0,017 -0,039 0,3 0,2 0,9 42 Private Nonmarket Services 0,089 0,006 -0,041 2,1 2,4 1,0 4 Non-Metallic Minerals 0,080 0,014 -0,036 1,0 0,8 1,4 22 Clothing 0,080 0,002 -0,025 1,3 1,2 1,4 31 Other Industrial Products 0,078 0,014 -0,036 0,3 0,3 0,5 34 Trade 0,073 0,007 -0,045 8,4 11,2 3,4 1 Agriculture 0,066 0,013 -0,039 4,7 5,6 3,2 18 Other Chemicals 0,064 0,014 -0,027 0,7 0,4 2,2 39 Business Services 0,064 0,007 -0,033 4,8 5,5 2,7 2 Mining 0,053 0,011 -0,026 0,8 0,6 1,1 35 Transport 0,051 0,013 -0,031 4,2 4,4 3,3 32 Public Utilities 0,049 0,006 -0,024 2,5 2,7 1,7 33 Construction 0,043 0,011 -0,024 5,7 5,5 4,1 38 Families Services 0,021 0,008 -0,016 7,6 8,3 4,4 30 Other Food Products 0,011 0,000 -0,002 2,5 1,3 5,0 65,9 67,2 54,1 Source: Elaborated by authors.
Among these sectors are Textiles (21) and Clothing (22) which had revealed and
appreciation, besides various sectors of services branch related to infrastructure, which had,
until the mid-1990s, competitive disadvantages and additional costs relating to foreign
com-petitors.
Figure 2. Sectoral distribution with positive variation of b0j, Brasil, 1995-2000.
Source: Source: Elaborated by authors.
Particular attention should be paid to the fact that the sectors on area D' were
re-sponsible together for, approximately, 66% of production, 67% of imports and 54% of
domes-tic value added in 1995. On area C' Oil Refining (17) showed simultaneous decrease in both
effects, predominantly the reduction of external dependence.
The need for imported inputs to the production process was, in general, great for
most sectors and industries were starting productive restructuring and modernization. Thus,
between 1995 and 2000 a few sectors, such as Oil and Gas (3) and Oil Refining (17), which
had already been benefited indirectly by the positive results from the National Alcohol
Pro-gram (PROALCOOL), had lower external dependence and, in the first case, greater ability to
generate value added. The Oil Refining sector (17) showed decrease in net growth effect,
which may be attributed to the substitution of gasoline by ethanol in the national car fleet. -0,090
-0,080 -0,070 -0,060 -0,050 -0,040 -0,030 -0,020 -0,010 0,000
-0,005 0,000 0,005 0,010 0,015 0,020 0,025 0,030
C'
D'
17 30
25 9
37
15 20 38
21
29
42
34 22
13 19
1 7
4 31 28
39 27
18 35 33 2 24 32
26
v∗
The sub-period from 2000-2005 revealed reduction in the number of sectors with
negative variation of bj0 from 13 to 10. However, the number of sectors located on area A
increased from 1 to 8 and there was no occurrence of sectors on areas C and D. Taking into
account areas A and B, 50% of the sectors were service sectors. In other words, from the10
classified in these two areas, 5 were dedicated to some sort of service in the period, namely
Private Nonmarket Services (42), Business Services (39), Financial Institutions (37),
Com-munications (36) and Public Utilities (32) (Table 3 and Figure 3).
Table 3. Distribution of sectors in areas with Δb0j < 0, and sectoral share in gross value of production (GVP), imports (M) and the value added (VA), Brazil, 2000-2005.
Area Sectors ∆b0j ∆ ∗ ∆ ∗
GVP P (%)
M (%)
VA (%) 21 Textile Industry -0,011 -0,013 0,016 1,1 0,8 1,8 42 Private Nonmarket Services -0,017 -0,002 0,008 2,0 2,2 0,9 7 Other Metal Products -0,027 -0,006 0,013 1,2 0,9 1,8 A 23 Footwear -0,027 -0,006 0,011 0,7 0,4 0,8 39 Business Services -0,039 -0,002 0,017 4,2 4,8 2,4 33 Construction -0,044 -0,003 0,017 5,6 5,5 4,3 37 Financial Institution -0,191 -0,003 0,079 5,6 5,9 2,1 28 Sugar Products -0,316 -0,004 0,061 0,5 0,2 0,2 20,9 20,7 14,4
B 36 Communication -0,018 0,001 0,006 3,5 3,6 2,4 32 Public Utilities -0,019 0,001 0,006 3,3 3,5 2,1 6,8 7,1 4,5 Source: Elaborated by authors.
With regard specifically to the sectors of infrastructure, which until the mid-1990s
were almost exclusively under the responsibility of the public sector, characterized by reduced
fixed investments, technological, management and services operation gaps, the period from
2000 -2005 shows the result of the redefining regulatory model occurred from the second half
of the 1990s, in order to attract private investment, both to complete projects initiated and
discontinued due to lack of resources, and to reduce the costs of implementation of the new
infrastructure projects.
Starting from 1995 the Federal Government extended the privatization program to
infrastructure services, edited the Concessions Law and the constitutional amendments of
suppression of several state monopolies (oil industry, telecommunications, distribution of
piped gas and reinsurance) and eliminated constitutional discrimination against foreign
with financial and operational autonomy, and edited the specific legislation for each sector
included in the reforms (BONELLI, VEIGA, 2003).
Figure 3. Sectoral distribution with negative variation of b0j, Brasil, 2000-2005.
Source: Source: Elaborated by authors.
Despite the fact that the results of these initiatives are heterogeneous, varying
greatly between service providers sectors, they can be considered, in general, positive in terms
of attracting investment, expansion of domestic supply and increased competition.
Among the sectors with positive variation of b0j in the period from 2000-2005, 6
were located on the area with positive variation of the capacity to generate more value added
and less need for imported inputs (A'), and 11 were found on area D'. On C' area 13 sectors
were detected and on B' 2 (Table 4 and Figure 4). Compared with the period from 1995-2000,
the period from 2000-2005 showed a small increase in the number of sectors with b0j > 0,
from 29 to 32, but even so, many sectors improved their position in terms of external
depend-ence, being located on areas A', B' and C', a total of 21 sectors, compared to only 1 in the
ini-tial period. Considering only areas D and D', the number of sectors decreased from 37 to11,
0,000 0,010 0,020 0,030 0,040 0,050 0,060 0,070 0,080
-0,016 -0,014 -0,012 -0,010 -0,008 -0,006 -0,004 -0,002 0,000 0,002
B
32 36
A
37
28
21
7 23
33 39
42
v∗
showing a reduction in the number of sectors with higher external dependence and dominance
of lower net growth effect between 1995-2000 and 2000-2005.
Table 4. Distribution of sectors in areas with Δb0j > 0, and sectoral share in gross value of production (GVP), imports (M) and the value added (VA), Brazil,2000-2005.
Area Sectors ∆b0j ∆ ∗ ∆ ∗
GVP (%)
M (%)
VA (%) 17 Oil Refining 0,026 -0,008 0,003 3,8 1,3 14,6 18 Other Chemicals 0,020 -0,006 0,002 0,9 0,4 2,3 15 Rubber 0,019 -0,011 0,006 0,3 0,2 0,9 A' 2 Mining 0,011 -0,004 0,001 0,7 0,6 0,9 9 Electrical Equipment 0,003 -0,009 0,008 1,0 0,6 2,2 20 Plastics 0,001 -0,008 0,007 0,9 0,5 2,7 7,6 3,6 23,6
We could say that these findings were the result of the changes implemented in
the national economy over the period, making it more robustly structured and able to produce
domestically many of the inputs required for its production process.
Between 1995-2000 and 2000-2005, two findings are important for what they
mean in terms of changes in the sectoral pattern of behavior in Brazil. The first is the
im-provement in the ability to generate sectoral value added and reduce external dependence in
some sectors, especially the Textile Industry (21), Other Metal Products (7), Footwear (23)
and Construction (33), sectors with more technology. The second is the absolute and relative
gain of importance of the activities traditionally associated with the service sector, with
great-er involvement in the production in the pgreat-eriod from 2000-2005.
Thus, on areas A and B are the Private Nonmarket Services sectors (42) Business
Services (39), Financial Institutions (37), Communications (36) and Public Utilities (32), in
which modern technologies began to promote an important productive revolution in the
indus-trial apparatus, since, according to Bonelli and Veiga (2003), it is estimated that a large share
of employment in the industrial sector started to be devoted to service production from the
1990s.
Figure 4. Sectoral distribution with positive variation of b0j, Brasil, 2000-2005.
Source: Source: Elaborated by authors.
-0,060 -0,050 -0,040 -0,030 -0,020 -0,010 0,000 0,010 0,020
-0,016 -0,012 -0,008 -0,004 0,000 0,004 0,008 0,012
B'
2
∆m∗
v∗
15 9 18 20 17
A'
31 4
16 6
1 3 27
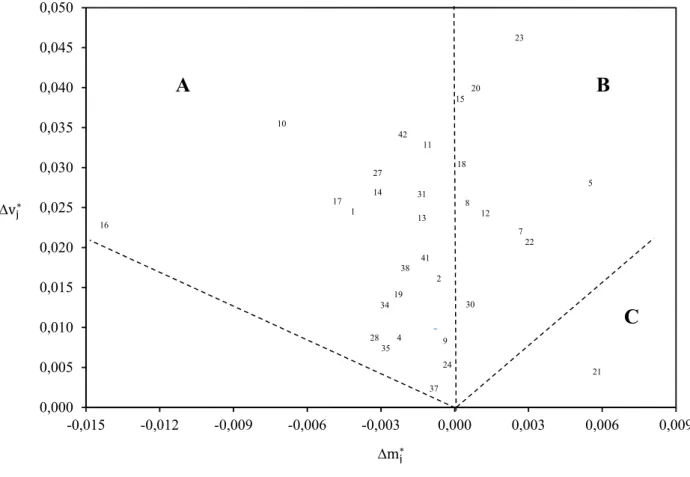
The sub-period from 2005-2009 reserved for the national economy a very positive
scenario in sectoral terms, with 21 of them being located on area A, 10 on B and 1 on C, a
total of 32 (Table 5 and Figure 5).
Table 5. Distribution of sectors in areas with Δb0j < 0, and sectoral share in gross value of production (GVP), imports (M) and the value added (VA), Brazil, 2005-2009.
Area Sectors ∆b0j ∆ ∗ ∆ ∗
GVP (%)
M (%)
VA (%) 37 Financial Institution -0,004 -0,001 0,003 5,3 6,8 1,7 35 Transport -0,016 -0,003 0,008 4,8 5,0 3,9 34 Trade -0,021 -0,003 0,013 7,8 10,6 3,9 28 Sugar Products -0,026 -0,004 0,009 0,7 0,5 0,2 4 Non-Metallic Minerals -0,027 -0,002 0,010 0,9 0,7 1,2 24 Coffe Products -0,034 -0,001 0,006 0,2 0,1 0,0 41 Public Administration -0,037 -0,002 0,018 11,4 14,6 4,7 9 Electrical Equipment -0,037 -0,001 0,010 1,1 0,7 1,9 16 Chemicals Elements -0,038 -0,014 0,023 1,1 0,7 2,4 38 Families Services -0,043 -0,002 0,017 6,2 7,0 3,9 A 19 Pharmaceutical and Veterinary -0,045 -0,002 0,015 1,2 1,0 1,7 2 Mining -0,054 -0,001 0,016 0,9 0,8 1,1 1 Agriculture -0,064 -0,004 0,025 5,1 5,6 4,6 42 Privati nonmarket Services -0,084 -0,002 0,035 1,8 2,2 0,7 13 Wood and Wood products -0,085 -0,001 0,024 1,1 0,9 0,8 14 Pulp, Paper and Printing -0,088 -0,003 0,026 1,8 1,4 1,8 31 Other Industrial Products -0,093 -0,001 0,027 0,3 0,3 0,4 17 Oil Refining -0,107 -0,005 0,026 4,7 1,7 16,5 10 Eletronic Equipments -0,116 -0,007 0,036 1,6 0,8 5,2 27 Dairy Products -0,154 -0,003 0,029 0,6 0,2 0,3 11 Cars, Trucks and Bus -0,186 -0,001 0,033 1,9 0,5 4,8 60,4 62,0 61,6 30 Other Food Products -0,066 0,001 0,013 1,6 1,0 1,5 7 Other Metal Products -0,091 0,003 0,022 1,5 1,3 1,9 22 Clothing -0,091 0,003 0,022 0,7 0,6 0,7 8 Machinery and Equipment -0,115 0,000 0,026 1,6 1,0 2,7 12 Parts and other vehicles -0,122 0,001 0,024 2,1 1,2 4,5 B 5 Siderurgy -0,139 0,005 0,028 1,9 1,2 4,3 18 Other Chemicals -0,143 0,000 0,031 0,9 0,5 2,1 20 Plastic -0,171 0,000 0,039 0,9 0,5 2,4 15 Rubber -0,171 0,001 0,040 0,4 0,2 0,9 23 Footwear -0,227 0,003 0,047 0,6 0,4 0,6 12,2 7,9 21,5 C 21 Textile Industry -0,040 0,006 0,005 0,9 0,7 1,1 0,9 0,7 1,1 Source: Elaborated by authors.
Only on area A, is concentrated half of the industries in which the Brazilian
less need to import inputs for the production process. These sectors together accounted for
about 60% of production, 62% of imports and value added in the period of 2005-2009.
Figure 5. Sectoral distribution with negative variation of b0j, Brasil, 2005-2009.
Source: Source: Elaborated by authors.
Between 2005-2009, no sector is positioned on area D while the number of sectors
with positive variation of b0j fell from 32, from 2000-2005, to 10, from 2005-2009 (Table 6
and Figure 6).
In the case of the Brazilian economy it is not difficult to explain the positive
evo-lution of productive structure in terms of reduction of external dependence and increase in the
ability to generate value added between 1995 and 2009. This was a period of normalization of
political conditions, economic stabilization, inclusive social policies, not negligible changes
in industrial policy and foreign trade, breaking monopoly, privatization, international
econom-ic integration and relatively strong and convergent growth at macroeconomeconom-ic level.
0,000 0,005 0,010 0,015 0,020 0,025 0,030 0,035 0,040 0,045 0,050
-0,015 -0,012 -0,009 -0,006 -0,003 0,000 0,003 0,006 0,009
∆m∗
v∗
A
B
C
21 30
7 22 8
12
5 18
23
20 15
16
10
42 11
31
13 17
1 27
14
28 4 35 9
24
37 19 34
41 38
Nevertheless, considering the sectoral focus of this study, it is important to
re-view, even rapidly, the dynamics of sectoral policies in Brazil in the focused period so that the
results mentioned above make more sense.
An important fact in Brazil in the early years of the 1990s was the inflection in the
design of industrial policy and foreign trade. According to Bonelli e Veiga (2003, p. 3)
"'hori-zontal policies ' aimed at increasing competitiveness and exports, gain relevance vis-a-vis
sectoral policies and measures, which had virtually monopolized government efforts in these
public policy areas until the 80s".
Table 6. Distribution of sectors in areas with Δb0j > 0, and sectoral share in gross value of production (GVP), imports (M) and the value added (VA), Brazil, 2005-2009.
Area Sectors ∆b0j ∆ ∗ ∆ ∗
GVP (%)
M (%)
VA (%)
A' 29 Vegetal Oil 0,015 -0,004 0,002 0,9 0,2 0,4 39 Business Services 0,000 -0,001 0,001 3,8 4,6 1,8
4,7 4,8 2,2
B' 25 Vegetal Products 0,044 -0,005 -0,002 1,4 0,6 1,7 1,4 0,6 1,7 6 Non-Ferrous Metallurgy 0,087 -0,001 -0,019 0,6 0,4 1,3 C' 26 Meat Products 0,013 -0,001 -0,002 1,7 0,8 0,3 33 Construction 0,005 0,000 -0,001 4,4 4,8 2,9
6,7 6,0 4,5
D'
36 Communication 0,065 0,000 -0,023 3,7 4,0 2,6 3 Oil and Gas 0,045 0,006 -0,019 1,9 1,7 2,2 32 Public Utilities 0,033 0,003 -0,015 3,5 3,9 2,2 40 Realty Services 0,028 0,001 -0,024 4,7 8,3 0,3 13,8 18,0 7,3 Source: Elaborated by authors.
However, the increasing attention directed to horizontal policies did not generate,
at any time, the abandonment of 'sectoral axis' policies, which returned in 1995, giving
priori-ty treatment to investments in sectors such as automobiles, textiles, footwear, clothing,
aero-space, electronics, information and automation. Allied to incentive programs at federal level,
these sectors were also target of state industrial policies.
Thus, what is important to note in this context is the change of vision that
perme-ates the new policy: this changed from a vision that emphasizes the priority sectoral
dimen-sion domestic supply growth to a vidimen-sion of industrial and technology policy in which the
Figure 6. Sectoral distribution with positive variation of b0j, Brasil, 2005-2009.
Source: Source: Elaborated by authors.
4. CONCLUDING REMARKS
In this article we propose a method to study the structural changes in the Brazilian
economy in the period from 1995-2009, using traditional indicators of Hirschman-Rasmussen
from the production multipliers of the Leontief inverse matrix. This method is suitable for
assessing the sectoral external dependence (heavy reliance on imported inputs) and the low
value added generated in domestic production, important vulnerabilities in several open
econ-omies, such as the Brazilian one from the 1990s.
The analysis of the Brazilian productive structure between the period of 1995 and
2009, divided into three sub-periods, namely, 1995-2000, 2000-1005 and 2005-2009, showed
a very satisfactory performance of the national economy over the time, with predominance of
positive gains in the ability to generate value added and reduce intermediate input imports by
most technologically advanced sectors and by services sectors, and fewer losses in the ability
to generate value added and greater external dependence for the minority of the sectors,
par-ticularly in more recent years.
The growth of external dependence is not necessarily bad. It can be the result of
the greatest benefits of international division of labor and specialization of production. What
-0,030 -0,025 -0,020 -0,015 -0,010 -0,005 0,000 0,005 0,010
-0,006 -0,004 -0,002 0,000 0,002 0,004 0,006 0,008
v∗
∆m∗
29
39
25
A'
B'
33 266
C'
36 40
32
3
is not desirable, initially, is that the decrease in national production needed to satisfy the
in-creasing domestic demand is just a consequence of the replacement of domestic production by
imports.
So, what was observed was a visible modernization of the production system in
Brazil, with more sectors of medium and high technology and sectors associated with the
pro-duction of service positioning themselves on virtuous areas of greatest generation of value
added and less external dependency. This development of the national economy over the
stud-ied period reflects, undoubtedly, the effort for modernization imposed by the intensification of
trade liberalization process that, by joining private agents and public sector, implemented
necessary changes so that Brazil could participate more actively in the global liberalization
movement and deeper integration with the international economy.
It is important to note that, although limitations in traditional gross multipliers
used in this study (Oosterhaven and Stelder, 2002), the proposed method can be used as a
simple device but visually evocative to quantify the structural changes of a given economy.
Moreover, with some refinements, the method can also be useful to compare the evolution of
two or more economies over their development paths.
For future studies, it is recommended to analyze the evolution of the Brazilian
economy from 1980 to the most recent year (for which there is input-output matrix) with the
objective of verifying the sectoral structure before and after the intensification of trade
liberal-ization occurred in the 1990s. Another proposal would be to compare two economies along
their development paths, for example, Brazil and some other economy with which Brazil has
closer trade relations. Finally, studies that are dedicated to evaluate specific sectors would be
welcome and would allow greater detail of public and private actions directly applied to them.
Acknowledgments. We thank the financial support from national funds by FCT (Fundação para a Ciência e a Tecnologia). This paper is part of the Strategic Project: PEst-OE/EGE/UI0436/2011 and it was prepared during the post doc program of Rossana Rodrigues and Antonio Moretto in UECE, un-der the supervision of João Carlos Lopes.
REFERENCES
ARBACHE, J. S. (2001), Trade liberalisation and labour market in developing countries: theory andevidence. Discussion Paper 01/12, University of Kent, Department of Economics.
BONELLI, R.; FONSECA, R. (1998), Ganhos de produtividade e de eficiência: novos re-sultados para a economia brasileira. Texto para Discussão, 557, Rio de Janeiro: IPEA.
BONELLI, R.; VEIGA, P. da M. (2003), A dinâmica das políticas setoriais no Brasil da déca-da de 1990: continuidéca-dade e mudéca-danças. Revista Brasileira de Comércio Exterior, v. 75, abr.-jun. 2003.
BRESSER-PEREIRA, L. C. (2005), Desenvolvimento e crise no Brasil. São Paulo: Editora 34.
CACCIAMALI, M. C. (2000), Globalização e processo de informalidade. Economia e Socie-dade, Campinas, v.14, p. 153-174.
CACCIAMALI, M. C.; BEZERRA, L. de L. (1997), Produtividade e emprego industrial no Brasil. Revista Brasileira de Economia, v. 51, n. 1, p. 77-91.
CAMARGO, F. S. de. (2006), Análise Estrutural do Emprego Formal e Informal na Economia Brasileira, 94f. Dissertação (Mestrado em Economia Aplicada) ESALQ/USP, Piracicaba.
CAMPOS, M. de F. S. de S. (2004), Abertura comercial, comércio intra-indústria e desi-gualdade de rendimentos na indústria de transformação brasileira. Tese (Doutorado em Economia). PIMES/UFPE, Recife.
CARVALHO, P. G. M. de. (2000), As causas do aumento da produtividade da indústria brasileira nos anos 90. Tese (Doutorado em Economia). Rio de Janeiro: UFRJ/IE.
CELLA, G. (1984), The input-output measurement of interindustry linkages. Oxford Bulletin of Economics and Statistics, v. 70, p. 705-712.
CHAMON, M. (1998), Rising wages and declining employment: the brazilian manufactur-ing sector in the 90s. Texto para Discussão, 552, Rio de Janeiro: IPEA, 1998.
CLEMENTS, B. On the decomposition and normalization of interindustry linkages. Eco-nomics Letters, v. 33, p. 337-340.
CODACE (2009), Comitê de Datação dos Ciclos Econômicos. Rio de Janeiro: Instituto Bra-sileiro de Economia (Ibre), Fundação Getulio Vargas.
CONSIDERA, C. M.; SILVA, A. B. (1993), A produtividade da indústria brasileira. Rio de Janeiro: IPEA/DIPES (Sumário Executivo, 1).
CORSEUIL, C. H. L.; FOGUEL, M. N. (2011), Expansão econômica e aumento da forma-lização das relações de trabalho: uma abordagem através das contratações. Rio de Janeiro, IPEA, (Texto para Discussão, 1571).
FEIJÓ, C. A.; GONZAGA, P. (1994), Sete teses equivocadas sobre o aumento da produtivi-dade em anos recentes. Boletim de Conjuntura do IPEA, Rio de Janeiro: IPEA, v. 14, n. 2.
FERNANDES, R.; MENEZES FILHO, N. A. (2002), Escolaridade e demanda relativa por trabalho: uma avaliação para o Brasil nas décadas de 80 e 90. In: SEMINÁRIO DE ECO-NOMIA APLICADA, 2., IPEA/UnB/MTE, II, 2002. IPEA/UnB/MTE. Anais ... Brasília.
GIAMBIAGI, F.; VILLELA, A.; CASTRO, L. B.; HERMANN; J. (org). (2005), Economia Brasileira Contemporânea (1945-2004). Rio de Janeiro: Elsevier.
GREMAUD, A. P., VASCONCELOS, M. A. S.; TONETO Jr., R. (2005), Economia Brasi-leira Contemporânea. São Paulo: Atlas.
GUILHOTO, J. J. M; SONIS, M.; HEWINGS, G. J. D; MARTINS, E. B. (1994), Índices de ligações e setores-chave na economia brasileira: 1959/80. Pesquisa e Planejamento Econô-mico, v. 24, n. 2, p. 287-314.
GUILHOTO, J. J. M.; SONIS, M. ; HEWINGS, G. J. D. (1996), Linkages and multipliers in a multiregional framework: integration of alternative approaches. Discussion Paper,
96-T-8Urbana: University of Illinois. Regional Economics Applications Laboratory.
GUILHOTO, J. J. M.; SESSO FILHO, U. A. (2005), Estimação da Matriz Insumo-Produto a partir de dados preliminares das Contas Nacionais. Economia Aplicada. v. 9, n. 2, p. 277-299.
HEWINGS, G. J. D. (1982), The empirical identification of key sectors in an economy: a regional perspective. The Developing Economies, v. 20, p. 173-195.
HIDALGO, A. B. (2002), O processo de abertura comercial brasileira e o crescimento da pro-dutividade.Economia Aplicada, v.6, n.1, p. 79-95.
HIRSCHMAN, A. O. (1958), The strategy of economic development. New Haven: Yale University Press.
LEONTIEF, W. (1986), Input-Output Economics. 2nd ed. New York: Oxford University Press.
LOPES. J. C., DIAS, J. AMARAL, J. F. (2011), External dependency, value added generation and structural change: an interindustry approach”. Notas Económicas, v. 33, n. 2, p.6-19.
McGILVRAY, J. W. (1977), Linkages, key sector and development strategy. In: LEONTIEF, W. (Ed.) Structure, System and Economic Policy. Cambridge: Cambridge University Press.
MENEZES-FILHO, N. A.; RODRIGUES JÚNIOR, M. (2001), Abertura, tecnologia e quali-ficação: evidências para a manufatura brasileira. In: WORKSHOP LIBERALIZAÇÃO CO-MERCIAL IPEA/UnB/MTE, Anais... Brasília.
MINISTÉRIO DA FAZENDA (2010), Economia Brasileira em Perspectiva. Edição Especi-al/Ano 2010. Disponível em http://www.fazenda.gov.br/portugues/docs/perspectiva-economia-brasileira/edicoes/Economia-Brasileira-Em-Perpectiva-Especial-10.pdf. Acessado em 03/03/2012.
MYRDAL, G. (1957), Solidaridad o desintegración. México, DF, Buenos Aires, Fondo de Cultura Económica.
OOSTERHAVEN, J.; STELDER, D. (2002), Net Multipliers avoid exaggerating Impacts: with a bi-regional illustration for the Dutch transportation sector. Journal of Regional Scien-ce, v. 42, p. 533-43.
PERROUX, F. Conceito de pólos de crescimento. In: SCHWARTZMAN, J. (Ed.) (1997), Economia Regional: textos escolhidos. Belo Horizonte: CEDEPLAR, p. 145-156.
RASMUSSEN, P. N. (1956), Studies in intersectoral relations, Amsterdam: North-Holland, 1956.
ROSSI JÚNIOR, J. L.; FERREIRA, P. C. (1999), Evolução da produtividade industrial brasi-leira e abertura comercial. Pesquisa e Planejamento Econômico, v. 29, n. 1, p. 1-36.
SABÓIA,J. (2001),A dinâmica da descentralização industrial no Brasil. Texto para
Dis-cussão, 452, Rio de Janeiro: UFRJ/Instituto de Economia.
SALM, C.; SABÓIA, J.; CARVALHO, P. G. M. de. (1997), Produtividade na indústria brasi-leira: questões metodológicas e novas evidências empíricas. Pesquisa e Planejamento Eco-nômico, v. 27, n. 2, p. 377-396.
SILVA, A. et al. (1993), Retrospectiva da economia brasileira. Perspectivas da Economia Brasileira – 1994, cap. 1. Rio de Janeiro: IPEA, p. 13-41.