Rio Grande do Norte, Brazil, voluntary bone marrow donors
registry analysis
MARINA BARGUIL MACÊDO1, LUIZA TAMIE TSUNETO2, ROSEMARY ALMEIDADE OLIVEIRA TEIXEIRA3, MARIADO SOCORRO BELARMINODE
OLIVEIRA4, JOSÉ MACHADO MOITA NETO5, ADALBERTO SOCORRODA SILVA6, LUIZ CLÁUDIO DEMESDA MATA SOUSA7, MARAYZA GOMES
CARVALHO8, HERTON LUIZ ALVES SALES FILHO1, JOSÉ RENATO PEREIRADE MOURA BARROSO9, ANAREGINADE SOUSA ARAÚJO8,
SEMIRAMIS JAMIL HADADDO MONTE10*
1Medicine Undergraduate Student, Federal University of Piauí, Teresina, PI, Brazil 2Lecturer, Federal University of Maringá (UEM), Maringá, PR, Brazil 3Social Worker at the Dalton Cunha Blood Center, Natal, RN, Brazil 4Employee at the Dalton Cunha Blood Center, Natal, RN, Brazil
5Lecturer, Department of Chemistry, Federal University of Piauí, Teresina, PI, Brazil 6Biology Professor, Federal University of Piauí, Teresina, PI, Brazil
7Lecturer, Department of Informatics and Statistics, Federal University of Piauí, Teresina, PI, Brazil 8Laboratory of Immunogenetics and Molecular Biology, Federal University of Piauí, Teresina, PI, Brazil 9Computer Science Undergraduate Student, Federal University of Piauí, Teresina, PI, Brazil 10Associate Professor, Department of General Medicine, Federal University of Piauí, Teresina, PI, Brazil
S
UMMARYStudy conducted at the Laboratory of Immunogenetics and Molecular Biology, Federal University of Piauí (LIB – UFPI)
Article received: 3/26/2014 Accepted for publication: 6/3/2014 *Correspondence: Address: Campus Universitário Ministro
Petrônio Portela, Bairro Ininga Postal Code: 64049-550 Teresina -– PI [email protected]
http://dx.doi.org/10.1590/1806-9282.61.01.023
Conflict of interest: none
Objective: this study aimed to report the allele and haplotype frequencies of volunteer bone marrow donors (VBMD) from the state of Rio Grande do Norte (RN) who were enrolled in the Brazilian Volunteer Bone Marrow Donor Regis-try (REDOME).
Methods: the sample comprised 12,973 VBMD who had their allele and haplo-type frequencies calculated by Arlequin 3.5.1.2. A multivariate analysis of the data was obtained through a principal component analysis (PCA) and hierar-chical cluster analysis (HCA) performed with SPSS 8.0.
Results: the most frequent allelic group was HLA-A*02, followed by -DRB1*13, -DRB1*04, -DRB1*07, -B*44, -B*35, -A*24 and -DRB1*01. Of the 2,701 haplo-types observed, the three most frequent were HLA-A*01 B*08 DRB1*03 (1.62%), -A*29 B*44 DRB1*07 (1.56%) and -A*02 B*44 DRB1*04 (1.29%). These haplo-types were in linkage disequilibrium. RN allele and haplotype frequencies were very similar to those in other Brazilian states in which similar studies have been performed. The PCA revealed that RN is highly genetically similar to Caucasian populations, especially those from Iberian countries, which strongly influenced the state’s ethnic composition. Africans and Amerindians also influenced the RN population structure, to a lesser extent.
Conclusion: the HCA reinforced the conclusion that, despite its highly admixed profile, the RN population is genetically similar to European and European-de-scended populations. The PCA also showed that RN cities do not contribute to the same extent to REDOME, with less populous cities being underrepresented, indicating the need to enroll more VBMD from these smaller cities to faithful-ly depict the state’s population structure in the database.
I
NTRODUCTIONIn humans, the major histocompatibility complex (MHC), or human leukocyte antigen (HLA) system, is the most polymorphic of all currently known human genetic sys-tems. Its extensively polymorphic nature makes it an in-teresting target for both population geneticists and im-munologists.1 For the former, HLA polymorphisms
provide an opportunity for developmental studies of po-pulation diversity, origins and relationships. For the la-ter, however, the same polymorphisms are obstacles to overcome. In fact, HLA mismatches are risk factors for rejection in solid organ transplantation and graft versus host disease (GVHD) in hematopoietic stem cell trans-plantation (HSCT).2 The commonality between these two
above-mentioned research fields is the need for HLA iden-tification at allelic level. For this purpose, high-resolu-tion HLA typing methods have been developed that al-low researchers to define both HLA allele distribution within a population and the haplotype relationships between alleles of different loci,3,4 as well as their
relation-ships with protein function.
HSCT requires a perfect match of HLA molecules. However, the chance of such a matching occurring between related donors is only 25%. To overcome this limitation, bone marrow donor registry programs have been cons-tructed worldwide, in which volunteer donors’ HLA alle-les are provided in medium-resolution form within data-bases. The gene pools of small and homogeneous populations will be well represented in a bone marrow donor registry program with large numbers of volunteer donors. Admixed and larger populations, however, might require further analysis with regard to the representation of particular haplotypes, and the minimum number of volunteer donors needed for a well-represented popula-tion must be calculated.5
The Brazilian National Bone Marrow Donors Pro-gram (REDOME) is among the largest databases world-wide (3,017,036 registered donors as of July 2013), and comprises a highly admixed population. However, there is a differential contribution to this program, with a pro-nounced skew toward the southern and southeastern re-gions. The north, center-west, and especially northeast regions are less represented, and studies on the HLA al-lelic contribution to REDOME are scarce.6 Hence,
stu-dies on HLA allele and haplotype pools from those re-gions are highly desired. Specifically, for the Northeast region, Rio Grande do Norte (RN), the sixth most popu-lous state, is a good starting point because the state pre-sents a unique ethnic profile compared with other Brazi-lian states, even those in Northeast Brazil. The unique
genetic profile of RN results from a complex coloniza-tion process that started with Portuguese colonists, fol-lowed closely by Spanish, French and Dutch settlers. All of these immigrant groups played key roles in the modi-fication of the native Amerindian genetic background, which was again altered when Africans were introduced as slaves. Currently, admixture is the major ethnic group in RN, to the detriment of the remaining native Amerin-dians.7
In the present study, we aimed to describe the allelic and haplotypic frequencies of the HLA genes at the -A, -B and -DRB1 loci in the state of RN, as well as to determi-ne whether such alleles and haplotypes are well represen-ted in REDOME.
M
ATERIALS AND METHODSSample
The current study included a sample of volunteer bone marrow donors (VBMD) who were registered at the La-boratory of Immunogenetics and Molecular Biology in Teresina, Piauí, Brazil, from January 2006 to July 2011. The state of Rio Grande do Norte comprises 167 municipalities, with a territorial area of 52,796.791 km2. It is located between the geographical
coordina-tes of 04º 50’ S and 06º 56’ S latitude and 35º 00’ W and 38º 29’ W longitude. The estimated population of Rio Grande do Norte is 3,168,027 inhabitants, which corresponds to 5.9% of the Northeast population, and 1.7% of the entire Brazilian population. All donors pro-vided informed consent for study inclusion. The study was approved by the University’s Research Ethics Com-mittee.
HLA allelic groups were molecularly typed at an in-termediate resolution for the HLA class-I (loci A, B) and -II (the DRB1 locus) alleles according to the Sequence-Spe-cific Oligonucleotide Primed Polymerase Chain Reaction (PCR-SSO) technique in combination with Luminex using commercial reagents and following the manufacturer’s instructions (One Lambda Inc., Canoga Park, CA, USA). The allele genotyping analysis was performed with HLA Fusion Software version 1.2.1 (One Lambda Inc.). When necessary, allelic groups were converted to the most likely high-resolution types based on the reported HLA frequen-cies within the observed National Marrow Donor Pro-gram (NMDP) multiple allele codes using the EpHLA converter software (LIB, Teresina, Piauí, Brazil).8
Data analysis
REDOME, we used the equation ip = [(state population/ Brazil population)/(state VBMD/REDOME VBMD)], in which “ip” is a proportionality index that evaluates whe-ther the VBMD from the state relates to the total REDO-ME in the same way that the state population relates to the national population. We estimated the maximum li-kelihood (ML) haplotype frequencies from the observed data with an expectation maximization (EM) algorithm9
for multi-locus genotypic data when the gametic phase was not known. Sample haplotype frequencies (hfo) were obtained in an expectation maximization algorithm. Lin-kage disequilibrium (LD) coefficients were obtained ba-sed on the following formula: D = hfo - hfe, where D is the value of absolute linkage disequilibrium, hfo is the sample’s observed haplotype frequency, and hfe is the ex-pected haplotype frequency or the product of the fre-quencies of alleles or variants in the haplotype. For two--point haplotypes, relative delta values were obtained with the equation ∆ij´ = ∆ij / |∆maxij|, where ∆maxij takes one of the following values: min(pi, pj) - pipj if ∆ij ≥ 0 or max(0, pi pj - 1) - pipj if DIj < 0.10 An exact test was used
to measure potential deviations from the expected Hardy--Weinberg equilibrium genotype frequencies.11
Ewens--Watterson test12-14 was applied to each locus. The
Arle-quin software package15 was used to calculate allele and
haplotype frequencies and gene heterozygosity, to verify the fit to Hardy-Weinberg expectations and to perform Ewens-Watterson’s test of selective neutrality.
Principal component analysis for the sample’s genetic characterization
A multivariate analysis of the data was obtained through a principal component analysis (PCA)16 and hierarchical
cluster analysis (HCA). Calculations were performed with the Statistical Package for the Social Sciences (SPSS) ver-sion 8.0 (Chicago, IL, USA).
In summary, PCA, when applied to a multi-dimensio-nal set of variables, calculates an orthogomulti-dimensio-nal basis guided by the directions of the maximum analyzed data varian-ces. Projections of the original data on this basis, called the principal components, accumulate the maximum data va-riance in decreasing order, thus making it possible to ge-nerate an approximate representation of the data from a reduced number of dimensions of the basis. The total va-riance percentage that can be “explained” by a subset of the principal components is given by the accumulated sum of self-values that correspond to that subset of principal components. HCA shows the vectorial proximity between populations on the basis of allelic frequency using two-di-mension diagrams (dendrograms).
A total of 33 municipalities in RN, each with more than 10 VBMD registered in REDOME, were included in the intrapopulation analysis. The population inclusion criterion for the interpopulation analysis was possession of HLA-A, -B and -DRB1 type data for molecular biology, a cumulative allele frequency above 90% for each locus and a historical relationship with the genetic composition of RN. The selected population samples were: USA NMDP African American (referred to as AFA, n = 412,861), USA NMDP Caucasian (CAU, n = 2,361,208), USA NMDP His-panic (HIS, n = 449,844), Italy (ITA, n = 159,311), Brazil Piauí (PI, n = 21,943), Brazilian Natives (BRN, n = 60), Pe-ruvian Natives (PRN, n = 83), Rwanda (RWA, n = 280),17
Brazilian Volunteer Bone Marrow Donor Registry (RE-DOME, n = 887,616), and Brazilian Bone Marrow Recep-tor Database (REREME, n = 5,543).6
The obtained results were used as input parameters to perform the HCA and to group the populations by ge-netic proximity in a dendrogram using the Jaccard simi-larity index. The resulting HCA dendrogram consisted of diagrams that represented the similarities between sam-ple pairs or groups on a scale that ranged from identity to no similarity.
R
ESULTS AND DISCUSSIONSample characterization
The sample comprised individuals from 132 (79%) of 167 cities within Rio Grande do Norte. Natal (RN capital city) inhabitants comprised more than half of the sample (6,991 individuals), followed by Mossoró and Parnamirim, the lat-ter being located only 20 km away from Natal. These muni-cipalities are the most populous cities in the state and also have some of the highest Human Development Indexes (HDI) in RN. The remainder of our sample comprised less populous cities, each with 10 to 374 VBMD registries.
From a demographic standpoint, the VBMD from RN were young adults, mainly women, with a mean age of 35 ± 9 years. According to the ethnicity information, the individuals defined themselves mainly as indigenous (2,828 registries), followed by black (2,417 registries), brown (1,200 registries), white (132 registries), and yel-low (42 registries). Unfortunately, 6,354 individuals had no registered ethnicity. The state’s calculated ip was 3.8, which means that a database nearly fourfold larger than the current REDOME would be required to precisely re-present the RN population.
Allelic frequencies
From the inferred high resolution alleles of group HLA-A*02, -A*02:01 (22.54%), -A*02:05 (1.02%), -A*02:11(0.78%), -A*02:02 (0.78%) and -A*02:22 (0.02%)
were the most frequently observed alleles, indicating a strong contribution of Caucasian populations to the eth-nic composition, and a lesser contribution from African populations.19 It is noteworthy that the frequency for the
allelic group HLA-A*02 observed in our study is similar to that presented in populations from Lisbon, Portugal (27.9%) and Murcia, Spain (23%).17 This proximity
reaf-firms the strong influence of Iberian countries on the for-mation of the current RN population structure. It is also important to highlight that the inference did not reveal any Amerindian-characteristic alleles.
Compared with the other Brazilian states, the allelic frequencies demonstrated for RN share several similari-ties. Piauí (PI), another state in Northeast Brazil, has si-milar frequencies of 25.48% for HLA-A*02 and 9.07% for -A*24; Pernambuco (PE), also from this region, has -A*02
(28.7%) and -A*24 (9.9%) as its most frequent allelic groups, too; as do Paraná (PR), with -A*02 and -A*24 reaching frequencies of 23.2% and 10.6%, respectively, and Minas Gerais (MG), with an -A*02 frequency of 23.6%.17
All but one (HLA-B*83) of the 36 allelic groups for locus HLA-B* were observed in our study. The allelic groups HLA-B*54 (0.012%), -B*67 (0.012%) and -B*59 (0.004%) had low frequencies. Only two allelic groups (HLA-B*44 and -B*35) were found at frequencies above 10%. Such high frequencies resemble those reported for Europe and European-colonized countries.19-21
Regarding the allelic frequency for locus B, our popu-lation differs slightly from that of PR, in which HLA--B*35(11.3%) was the most frequent allelic groups, rather than -B*44 (10.8%), and from MG, in which -B*35(11.5%) also replaced -B*44(11.3%) as the most frequent allelic group. A more pronounced divergence was noted against both PE and PI, in which HLA-B*15 (12.4%), -B*07 (9.9%) and -B*44 (9.4%) and -B*15(11.29%), -B* 35 (10.88%) and -B*44 (10.14%), respectively, comprised the leading alle-lic groups.17 The more prominent resemblance of RN to
MG and PR, rather than to PE or PI (which are geogra-phically much closer), again highlights the fact that Cau-casian populations most strongly influenced the ethnic configuration of RN, a phenomenon which was already well known for states in the Southern and Southeast of Brazil.22-26
All thirteen allelic groups described for locus HLA--DRB1 were represented in the RN sample. None of the alleles were found at frequencies low enough to be con-RN sample. All 21 possible allelic groups for locus A were
found in at least more than one individual from our RN sample. For locus A, the allelic groups HLA-A*43 (0.0077%) and -A*02 (25.42%) were the rarest and the most frequent, respectively. These data corroborate what is described in the literature.18
TABLE 1 Allelic frequencies of HLA-A, -B and -DRB1 in our Rio Grande do Norte sample (n = 12,973)
HLA-A AF (%) HLA-B AF (%) HLA-DRB1 AF (%)
A*02 25.42 B*44 11.25 DRB1*13 15.54
A*24 10.20 B*35 10.76 DRB1*04 14.04
A*01 8.68 B*15 9.71 DRB1*07 12.05
A*03 7.66 B*51 7.72 DRB1*01 10.03
A*68 6.57 B*07 6.48 DRB1*11 9.82
A*23 5.75 B*14 5.67 DRB1*15 9.44
A*31 5.32 B*40 5.61 DRB1*03 8.88
A*29 5.27 B*08 4.21 DRB1*08 7.03
A*30 5.21 B*58 3.97 DRB1*14 4.31
A*11 4.78 B*18 3.79 DRB1*16 3.57
A*33 3.34 B*39 3.18 DRB1*10 2.23
A*32 3.28 B*50 2.87 DRB1*09 1.67
A*26 2.64 B*53 2.81 DRB1*12 1.40
A*74 1.67 B*49 2.77
A*25 1.26 B*38 2.63
A*66 1.09 B*57 2.29
A*34 0.95 B*27 2.14
A*36 0.46 B*52 1.95
A*80 0.31 B*45 1.85
A*69 0.15 B*42 1.60
A*43 0.01 B*37 1.52
B*13 1.24
B*41 1.04
B*48 0.93
B*55 0.73
B*81 0.54
B*56 0.23
B*47 0.20
B*78 0.13
B*82 0.05
B*46 0.05
B*73 0.02
B*54 0.01
B*67 0.01
B*59 0.004
AF: allele frequency.
sidered rare in our population. The allelic groups HLA--DRB1*13, -DRB1*04, -DRB1*07, -DRB1*01 and -DRB1*11 were found at frequencies above 10%. Although the HLA-DRB1*13allele is commonly present in various populations worldwide, in this study, it reached a fre-quency typical of that observed in Iberian countries (Lis-bon, Portugal: 15.3%, Murcia, Spain: 15.1%).
Regarding the HLA-DRB1 locus, the three most fre-quent alleles in PI were exactly the same as those in RN, specifically -DRB1*13 (13.70%), -DRB1*04 (13.45%), and -DRB1*07 (12.55%). There was a divergence at the first position of PR, HLA-DRB1*11 (13.0%), which ranked fifth in RN; despite this fact, the next two most frequent allelic groups were the same: -DRB1*04 (12.2%), and -DRB1*07 (11.9%). In MG, HLA-DRB1*13(15.7%) also ranked first, but -DRB1*07 (14.2%) and -DRB1*04 (11.5%) switched positions.17
Hardy-Weinberg equilibrium and heterozygosity test
When evaluating the genotype distributions at each locus, we did not find any deviations (p <0.05) from those expected under the Hardy-Weinberg equilibrium (HLA-A, p= 0.13; HLA-B, p= 0.11, HLA-DRB1,p= 0.45). Similarly, the hete-rogeneity test of neutrality selection for the same loci could not reject the neutral model. Together, these findings tell us that the study population suffered from neither evolutio-nary pressure nor epigenetic forces capable of significantly modifying the allelic frequencies for the assigned loci.
Linkage-disequilibrium (LD) was positively and consis-tently observed in all of the three loci, suggesting a possible link between the alleles that constitute the haplotypes. The expected frequency of heterozygotes (Fe) for loci A, B and DR were respectively 88.54, 93.67 and 89.00, while the observed frequency of heterozygotes (Fo) for those same loci were 88.98, 93.83 and 89.61, respectively (p = 0.1277, 0.1113 and 0.4485, respectively). Based on these results, we can assume that the strength of disequilibrium is unrelated to the relative physi-cal distance between the loci in this small HLA segment. Hen-ce, exogenous factors such as migrations, mutations, racial admixtures, new allele introduction and positive selection must concur to explain the observed LD. In fact, immigra-tions of Caucasian and African descendants and the racial admixture of these latter two ethnic groups are important historical landmarks in the formation of the RN population.7
Haplotype frequencies
All pair-wise associations performed in the present study were statistically significant, as shown by the LD likeli-hood ratio test (p <0.05). We confidently estimated 2,701 HLA haplotypes borne in three loci using the EM
algo-rithm. Only three haplotypes (HLA -A*01 B*08 DRB1*03, -A*29 B*44 DRB1*07, and -A*02 B*44 DRB1*04) were
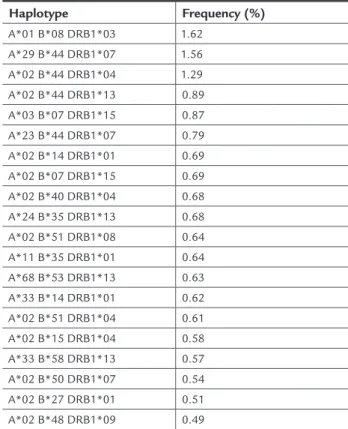
observed at frequencies above 1%. The high frequencies of the first and third haplotypes support a European con-tribution to the genetic composition of the study sam-ple. Table 2 shows the twenty most common haplotypes in our study. Interestingly, our first (HLA-A*01 B*08 DRB1*03) and second (-A*29 B*44 DRB1*07) most fre-quent haplotypes ranked in the same positions in the MG population, reaching 2.1% and 1.5%, respectively; and were the first and third most frequent haplotypes in the PR Caucasian population, with frequencies of 2.5% and 1.4%, respectively.17
TABLE 2 The twenty most frequent HLA haplotypes in our RN sample (n = 12,973)
Haplotype Frequency (%)
A*01 B*08 DRB1*03 1.62
A*29 B*44 DRB1*07 1.56
A*02 B*44 DRB1*04 1.29
A*02 B*44 DRB1*13 0.89
A*03 B*07 DRB1*15 0.87
A*23 B*44 DRB1*07 0.79
A*02 B*14 DRB1*01 0.69
A*02 B*07 DRB1*15 0.69
A*02 B*40 DRB1*04 0.68
A*24 B*35 DRB1*13 0.68
A*02 B*51 DRB1*08 0.64
A*11 B*35 DRB1*01 0.64
A*68 B*53 DRB1*13 0.63
A*33 B*14 DRB1*01 0.62
A*02 B*51 DRB1*04 0.61
A*02 B*15 DRB1*04 0.58
A*33 B*58 DRB1*13 0.57
A*02 B*50 DRB1*07 0.54
A*02 B*27 DRB1*01 0.51
A*02 B*48 DRB1*09 0.49
Linear regression analysis revealed a fine correlation between two loci (HLA- A and B), but not three loci (HLA--A, -B and -DR) haplotypes when RN was compared to REREME (R2 = 0.991, 0.974 and 0.066, respectively) and
REDOME (R2 = 0.989, 0.942 and 0.047, respectively). This
finding reveals that the genetic structure of a population cannot be described by genetic frequencies alone.
PCA results
To determine whether HLA alleles are homogenously distri-buted throughout RN, we plotted a pool of alleles from dif-ferent municipalities within the state in a PCA. Thus, we summarized the variability of a set of HLA molecules by creating principal components, which are linear combina-tions of all alleles. The first principal components (PC) cap-tured the largest amount of variability in the data, with each consecutive PC capturing less and less of the variability: the first PC’s variance was 10.547%, while the second’s was 9.286%, the third’s, 8.559%, and the forth’s, 8.115%. A cluster repre-senting 90% of the municipalities, with each having more than 10 VBMD, was then analyzed. Interestingly, this clus-ter includes the three most populous municipalities in RN: Natal, Parnamirim and Mossoró. Based on the PC plot, it is clear that some municipalities (Santo Antônio, Governador Dix-Sept Rosado, Baía Formosa and Florânia) lie outside of the main cluster. However, this is not unexpected, because these municipalities present low numbers of registered VBMD, which introduces bias. If we consider this to be true, increasing the VBMD registries in those places would remo-del the cluster and and would subsequently allow the incor-poration of the named municipalities; thus, there would be no phenotype substructure in the analyzed population.
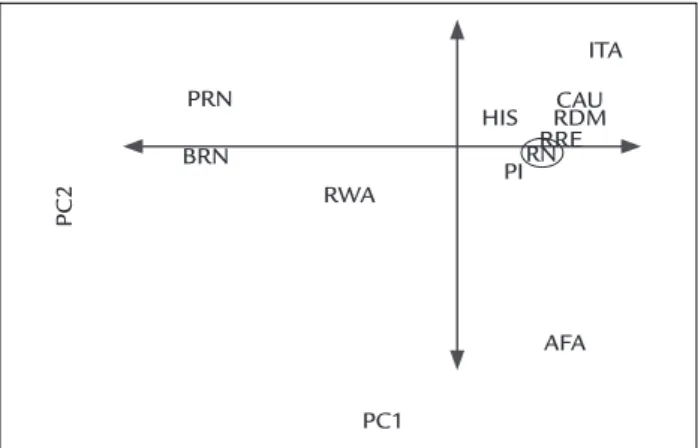
Next, we asked what ethnicity/ethnicities the RN popu-lation resembles. To answer this question, we plotted HLA molecules from RN against HLA molecule sets from diffe-rent ethnicities. In the PCA (Figure 1), the top PCs generally captured the population substructure due to ethnicity in the genome wide association data. We found that RN clus-tered together with populations from different countries in a pattern that resembled one typical for Caucasians of Eu-ropean descent.21,27,28 We must emphasize that RN and its
neighbor state, PI, clustered together, suggesting a close si-milarity between these states in terms of genetic composi-tion. A closer view of the PCA indicates that Amerindian and African components poorly contribute (or do not con-tribute at all) to the RN population composition.21,29,30
When this data was depicted in a dendrogram, we could clearly observe that the two populations that RN shared greatest genetic proximity were PI and USA Hispanic. On the sequence, REDOME and REREME were the next groups genetically closer to RN. USA African American, Peruvian Natives, Rwandan, USA Caucasian, Brazilian Natives and Italian, on this exact sequence, showed increasing distan-ces to the genetic structure of RN.
C
ONCLUSIONOur results reinforce the concept that HLA genes are a reliable tool with which to investigate the ethnic
compo-sition of a population. We conclude that VBMD from RN present genetic characteristics that are mainly compati-ble with Caucasian and African descent, with less promi-nent contributions from Amerindian populations. Fur-thermore, the state’s representation in REDOME remains small, and both the ip and PCA results indicate the need for more VBMD to be included in the registry so that less populous cities could be incorporated into the main clus-ter. This is required to determine whether there is a po-pulation substructure within the state, even in cities with high ip values.
A
CKNOWLEDGMENTSWe would like to express our gratitude towards Hemo-norte, the blood center of Natal, RN, which kindly allo-wed us to use its database in order to perform this study, in a time in which a local laboratory to typify HLA was unavailable. The invaluable contribution of the person-nel involved with the donors registration only reaffirms the blood center’s compromise with the State and the Country to which it solicitously works. We would also like to thank all the voluntary bone marrow donors, wi-thout whom this work would not have happened.
R
ESUMOAnálise do registro de doadores voluntários de medula óssea do Rio Grande do Norte, Brasil.
Objetivo: relatar as frequências alélicas e haplotípicas do HLA-A, -B e -DRB1 de doadores voluntários de medula
ós-PC2
PRN
BRN
RWA
AFA PI HIS
RRERDM CAU ITA
RN
PC1
FIGURE 1 Principal component analysis of the VBMD sample
from RN, REDOME, REREME and seven selected populations from the Allele Frequencies database.
sea (DVMO) do Rio Grande do Norte (RN), inscritos no Re-gistro Nacional de Doadores de Medula Óssea (REDOME). Metodologia: 12.973 DVMO tiveram suas frequências alé-lica e haplotípica calculadas pelo programa Arlequin 3.5.1.2. Uma análise multivariada dos dados foi obtida por meio da Análise de Componente Principal (ACP) e da Análise de Cluster Hierárquico (ACH) realizadas pelo SPSS 8.0. Resultados: os grupos alélicos mais frequentes foram HLA--A*02, seguido por -DRB1*13, -DRB1*04, -DRB1*07, -B*44, -B*35, -A*24 e -DRB1*01. Dos 2.701 haplótipos observa-dos, os três mais frequentes foram HLA-A*01 B*08 DRB1*03 (1,62%), -A*29 B*44 DRB1*07 (1,56%) e -A*02 B*44 DRB1*04 (1,29%), que se encontravam em desequi-líbrio de ligação. As frequências alélicas e haplotípicas do RN são bastante similares às de outros estados brasileiros em que trabalhos semelhantes foram executados. A ACP revelou ser o RN geneticamente muito semelhante a po-pulações caucasianas, especialmente a dos países ibéricos, os quais influenciaram fortemente na composição étnica do Estado. Africanos e ameríndios também contribuíram para a estrutura populacional, mas em menor proporção. Conclusão: a ACH reforçou a conclusão de que, apesar de seu perfil miscigenado, a população do RN se asseme-lha geneticamente com populações europeias e que des-cendem das europeias. A ACP também mostrou que as cidades do RN não contribuem equitativamente na com-posição do REDOME, de modo que cidades pouco po-pulosas estão sub-representadas, apontando a necessida-de necessida-de cadastrar mais DVMO necessida-dessas cidanecessida-des para que a estrutura da população seja fielmente retratada.
Palavras-chave: antígenos HLA, transplante, medula ós-sea, Brasil.
R
EFERENCES1. Sanchez-Mazas A, Fernandez-Viña M, Middleton D, Hollenbach JA, Buhler S, Di D. Immunogenetics as a tool in anthropological studies. Immunology 2011; 133(2):143-64.
2. Morishima Y, Sasazuki T, Inoko H, Juji T, Akaza T, Yamamoto K. The clinical significance of human leukocyte antigen (HLA) allele compatibility in patients receiving a marrow transplant from serologically HLA-A, HLA-B, and HLA-DR matched unrelated donors. Blood 2002; 99(11):4200-6. 3. Cao K, Moormann AM, Lyke KE, Masaberg C, Sumba OP, Doumbo OK.
Differentiation between African populations is evidenced by the diversity of alleles and haplotypes of HLA class I loci. Tissue Antigens 2004; 63(4):293-325. 4. Bugawan TL, Mack SJ, Stoneking M, Saha M, Beck HP, Erlich HA. HLA class I allele distributions in six Pacific/Asian populations: evidence of selection at the HLA-A locus. Tissue Antigens 1999; 53:311-9.
5. Patterson N, Price AL, Reich D. Population Structure and Eigenanalysis. PLoS Genet 2006; 2(12):2074-93.
6. Bouzas LFS. Análise da capacidade do REDOME/RENACORD em suprir as necessidades dos pacientes registrados no REREME [PhD Thesis]. Rio de Janeiro: Instituto Nacional do Câncer - INCA; 2011.
7. Trindade SLB. História do Rio Grande do Norte. Natal: Editora do Instituto Federal do Rio Grande do Norte; 2010.
8. EpHLA Converter [homepage on the internet]. Teresina: Laboratório de Imunogenética da Universidade Federal do Piauí; 2013 [updated Dec 2012; cited Oct 2013]. Available from: http://ephlaconverter.ufpi.br/. 9. Excoffier L, Slatkin M. Maximum-likelihood estimation of molecular haplotype
frequencies in a diploid population. Mol Biol Evol 1995; 12(5):921-7. 10. Imanishi T, Akaza T, Kimura A, Tokunaga K, Gojobori T. Allele and
haplotype frequencies for HLA and complement loci in various ethni groups. In: Tsuji K, Aizawa M, Sasazuki T (eds). HLA 1991, Proceedings of the Eleventh International Histocompatibility Workshop and Conference. New York: Oxford Science, 1992. p.1065.
11. Guo SW, Thompson EA. Performing the exact test of Hardy-Weinberg proportion for multiple alleles. Biometrics 1992; 48(2):361-72.
12. Watterson GA. The homozygosity test of neutrality. Genetics 1978; 88(2):405-17.
13. Hartl DL, Clark AG. Principles of population genetics. 3.ed. Sunderland: Sinauer Associates, Inc.; 1997.
14. Ewens WJ. The sampling theory of selectively neutral alleles. Theor Popul Biol 1972; 3:87-112.
15. Excoffier L, Laval G, Schneider S. Arlequin (version 3.0). An integrated software package for population genetics data analysis. Evolutionary Bioinformatics Online 2005; 1:47-50.
16. McVean G. A Genealogical Interpretation of Principal Components Analysis. PLoS Genet 2009; 5(10): e1000686. doi:10.1371/journal.pgen. 1000686 17. Gonzalez-Galarza FF, Christmas S, Middleton D and Jones AR. Allele frequency
net: a database and online repository for immune gene frequencies in worldwide populations. Nucleic Acid Research 2011; 39(Suppl 1):D913-D919. 18. Cao K, Hollenbach J, Shi X, Shi W, Chopek M, Fernández-Viña MA. Analysis
of the frequencies of HLA-A, B, and C alleles and haplotypes in the five major ethnic groups of the United States reveals high levels of diversity in these loci and contrasting distribution patterns in these populations. Hum Immunol 2001; 62(9):1009-30.
19. Mack SJ, Tu B, Lazaro A, Yang R, Lancaster AK, Cao K. HLA-A, -B, -C, and -DRB1 allele and haplotype frequencies distinguish Eastern European Americans from the general European American population. Tissue Antigens 2009; 73(1):17-32. 20. Middleton D, Williams F, Hamill MA, Meenagh A. Frequency of HLA-B
alleles in a caucasoid population determined by a two-stage PCR-SSOP typing strategy. Hum Immunol 2000; 61(12):1285-97.
21. Maiers M, Gragert L, Klitz W. High-resolution HLA alleles and haplotypes in the United States population. Hum Immunol 2007; 68(9):779-88. 22. Bortolotto AS, Petry MG, da Silveira JG, Raya AR, Fernandes SR, Neumann
J, et al. HLA-A, -B, and -DRB1 allelic and haplotypic diversity in a sample of bone marrow volunteer donors from Rio Grande do Sul State, Brazil. Hum Immunol 2012; 73(2):180-5.
23. Rosales T, Guilherme L, Chiarella J, Marin ML, Rosales C, Melo CP, et al. Human leukocyte A and B antigen, gene and haplotype frequencies in the population of the city of São Paulo in Brazil. Braz J Med Biol Res 1992; 25(1):39-47. 24. Ruiz TM, da Costa SM, Ribas F, Luz PR, Lima SS, da Graca Bicalho M.
Human leukocyte antigen allelic groups and haplotypes in a brazilian sample of volunteer donors for bone marrow transplant in Curitiba, Paraná, Brazil. Transplant Proc 2005; 37(5):2293-6.
25. Monte SJH, Moita Neto JM, Rampim GF, Shulzhenko N, Morgun A, Gerbase-Delima M. Polimorfismo do sistema HLA em uma amostra de mestiços da população de Teresina, Piauí. Rev Assoc Med Bras 2004; 50(4):422-6. 26. Nigam P, Dellalibera E, Maurício-da-Silva L, Donadi EA, Silva RS.
Polymorphism of HLA class I genes in the Brazilian population from the northeastern state of Pernambuco corroborates anthropological evidence of its origin. Tissue Antigens 2004; 64(2):204-9.
27. Carvalho AS. HLA-A, -B and -C markers in the Portuguese population. Tissue Antigens 1983; 21(1):39-44.
28. Piazza A, Olivetti E, Griffo RM. The distribution of HLA antigens in Italy. Genes Geogr 1989; 3(2):141-64.
29. Moscoso J, Seclen S, Serrano-Vela JI, Villena A, Martinez-Laso J, Zamora J et al. HLA genes in Lamas Peruvian-Amazonian Amerindians. Mol Immunol 2006; 43(11):1881-9.
30. Lazaro AM, Moraes ME, Marcos CY, Moraes JR, Fernandez-Vina MA, Stastny P. Evolution of HLA-class I compared to HLA-class II polymorphism in Terena, a South-American Indian tribe. Hum Immunol 1999; 60(11):1138-49. 31. Wang S, Lewis CM, Jakobsson M, Ramachandran S, Ray N, Bedoya G, et al.