ACPD
14, 24183–24220, 2014Methane as a diagnostic tracer
E. E. Remsberg
Title Page
Abstract Introduction
Conclusions References
Tables Figures
◭ ◮
◭ ◮
Back Close
Full Screen / Esc
Printer-friendly Version Interactive Discussion
Discussion
P
a
per
|
Discus
sion
P
a
per
|
Discussion
P
a
per
|
Discussion
P
a
per
|
Atmos. Chem. Phys. Discuss., 14, 24183–24220, 2014 www.atmos-chem-phys-discuss.net/14/24183/2014/ doi:10.5194/acpd-14-24183-2014
© Author(s) 2014. CC Attribution 3.0 License.
This discussion paper is/has been under review for the journal Atmospheric Chemistry and Physics (ACP). Please refer to the corresponding final paper in ACP if available.
Methane as a diagnostic tracer of
changes in the net circulation of the
middle atmosphere
E. E. Remsberg
Science Directorate, NASA Langley Research Center, 21 Langley Blvd., Mail Stop 401B, Hampton, VA 23681, USA
Received: 21 August 2014 – Accepted: 9 September 2014 – Published: 18 September 2014
Correspondence to: E. E. Remsberg ([email protected])
ACPD
14, 24183–24220, 2014Methane as a diagnostic tracer
E. E. Remsberg
Title Page
Abstract Introduction
Conclusions References
Tables Figures
◭ ◮
◭ ◮
Back Close
Full Screen / Esc
Printer-friendly Version Interactive Discussion
Discussion
P
a
per
|
Discus
sion
P
a
per
|
Discussion
P
a
per
|
Discussion
P
a
per
|
Abstract
This study makes use of time series of methane (CH4) data from the Halogen
Oc-cultation Experiment (HALOE) to determine whether there were any statistically sig-nificant changes of the net circulation within the stratosphere and lower mesosphere during 1992–2005. HALOE CH4 profiles in terms of mixing ratio vs. pressure-altitude
5
are binned into subtropical and extratropical latitude zones of the southern and of the Northern Hemisphere, and their separate time series are then analyzed using multiple linear regression (MLR) techniques. A positive trend in the subtropics and a negative trend in the extratropics is interpreted as indicating an acceleration of the net circu-lation. A significant acceleration is found in the Northern Hemisphere from 20 hPa to
10
7 hPa, a likely indication of changes from the effects of wave activity during those years. No similar acceleration is found in the Southern Hemisphere. The trends from HALOE H2O are analyzed and compared with those from CH4 for consistency because H2O is a primary product in the upper stratosphere of the chemical conversion of CH4.
The CH4 and H2O trends have a ratio of nearly 2 : 1, and they are anti-correlated
15
most clearly near the stratopause in the southern extratropics. Seasonal anomalies are found in the HALOE CH4 time series of the lower mesosphere, and they are
as-cribed to wave-driven, secondary residual circulation cells associated with the descent of the SAO westerlies. The time series residuals for CH4of the lower mesosphere also exhibit aperiodic structure, and it is anti-correlated with that of the tracer-like species
20
HCl. Such structure indicates the effects of variations in the wave forcing. It is con-cluded that multi-year, global-scale distributions of CH4are very useful for diagnosing large-scale changes of the net transport within the middle atmosphere.
1 Background
The Brewer/Dobson circulation (BDC) is primarily a seasonal net circulation in the
25
ACPD
14, 24183–24220, 2014Methane as a diagnostic tracer
E. E. Remsberg
Title Page
Abstract Introduction
Conclusions References
Tables Figures
◭ ◮
◭ ◮
Back Close
Full Screen / Esc
Printer-friendly Version Interactive Discussion
Discussion
P
a
per
|
Discus
sion
P
a
per
|
Discussion
P
a
per
|
Discussion
P
a
per
|
component at the extratropical latitudes of the northern and the Southern Hemispheres (e.g., Butchart, 2014; Plumb, 2007). The BDC has also been referred to as the trans-formed Eulerian mean (TEM) and residual circulations, and they are useful for viewing the net atmospheric response to the seasonal changes in the diabatic heating (Dunker-ton, 1978). The dissipation of Rossby and gravity wave forcings tend to accelerate
5
the net circulation of the winter hemisphere (e.g., Solomon et al., 1986; Plumb, 2007; Shepherd, 2007; Okamoto et al., 2011). In addition, any two-way, meridional exchange or mixing of the air contributes to the primary BDC (Garny et al., 2014). Thus, it is likely that there should be some asymmetry between the seasonal net circulations of the Northern and Southern Hemispheres because the winter wave forcing and mixing
10
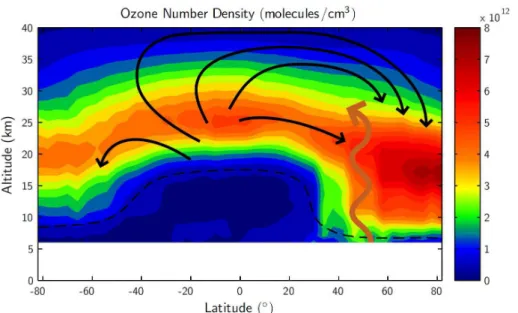
processes are more pronounced in the Northern Hemisphere (Shepherd, 2007). A schematic of the net circulation and its relation to the distribution of ozone in the stratosphere is shown in Fig. 1 for March, where the solid black curves represent the sense of the net circulation and the vertical orange arrow represents the approximate region for the propagation of waves from the upper troposphere and into the middle
15
atmosphere (see Shaw and Shepherd, 2008). Figure 1 indicates that the net circulation during winter and into spring leads to an accumulation of ozone in the extratropics of the Northern Hemisphere by March. Tracer-like molecules, such N2O and CH4, exhibit
distributions that are well correlated and vary seasonally in response to changes in the net circulation (Plumb and Ko, 1992).
20
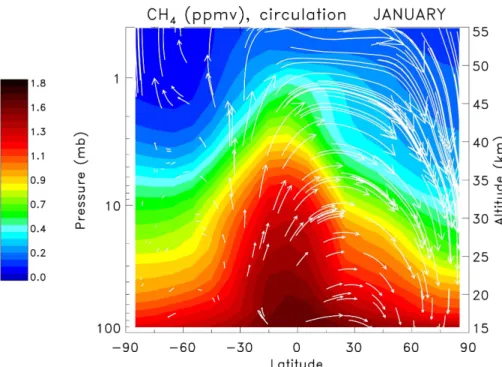
Figure 2 is an example of the zonally-averaged distribution of CH4 for January from
a NASA/Goddard chemistry and transport model simulation (Fleming et al., 1999). The white arrows show the stratospheric Brewer–Dobson circulation, which is strongest in the winter hemisphere (longer arrows), and weak in the summer stratosphere. Tracer fields such as CH4reflect the circulation, i.e., bulging upward in the tropics and
down-25
ACPD
14, 24183–24220, 2014Methane as a diagnostic tracer
E. E. Remsberg
Title Page
Abstract Introduction
Conclusions References
Tables Figures
◭ ◮
◭ ◮
Back Close
Full Screen / Esc
Printer-friendly Version Interactive Discussion
Discussion
P
a
per
|
Discus
sion
P
a
per
|
Discussion
P
a
per
|
Discussion
P
a
per
|
differs for the upper vs. the lower stratosphere and depends on whether the polar vortex is undisturbed and centered on the Pole or disturbed by Rossby-wave activity.
A current issue is whether the observed, seasonal net circulation is changing in the presence of the steady increases in the so-called “greenhouse gases”, like CO2(e.g., Butchart, 2014). Early on, Rind et al. (1990) conducted a series of simulation studies
5
of those effects, and their results indicated that there will be an acceleration of the net circulation, particularly in the Northern Hemisphere. Lin and Fu (2013) analyzed more recent results from a collection of chemistry/climate models (CCM), and they found that the diabatic effects from changes in the ozone and CO2 are likely driving
observed changes in the meridional temperature gradients and of the BDC of the lower
10
stratosphere. Based on the results of the CCM studies, they decomposed the BDC into a transition (100–70 hPa) branch, a shallow (70–30 hPa) branch, and a deep (30 hPa and higher) branch. Further, the CCM studies predict an acceleration of the BDC that will affect the rate of recovery for the ozone layer in the lower stratosphere.
Observational evidence of a long-term acceleration of the several branches of the
15
BDC is not so clear from time series of temperature or chemical tracers (Butchart, 2014). Garcia et al. (2011) recommend using observed tracers that are well sampled and have a near-linear growth rate. Hydrogen fluoride (HF) is a stratospheric end prod-uct of the photochemical conversion from chlorofluorocarbon molecules but has been increasing non-linearly, so it is not a good candidate for such studies. H2O has shown
20
long-term increases of about 0.6 % yr−1 (Scherer et al., 2008), but H2O entering the
stratosphere from below is subject to seasonal and occasional episodic changes of the temperature at the tropical tropopause. CH4 exhibits a small, monotonic, and nearly linear, annually-averaged trend in the troposphere, and it is unaffected during upward transport through the tropical tropopause, unlike H2O.
25
The modeled CH4distribution in Fig. 2 is very similar to observed wintertime distri-butions of CH4 from satellite datasets. CH4decreases with pressure-altitude and with
latitude because CH4 is oxidized in a multi-step process to H2O in the middle and
ACPD
14, 24183–24220, 2014Methane as a diagnostic tracer
E. E. Remsberg
Title Page
Abstract Introduction
Conclusions References
Tables Figures
◭ ◮
◭ ◮
Back Close
Full Screen / Esc
Printer-friendly Version Interactive Discussion
Discussion
P
a
per
|
Discus
sion
P
a
per
|
Discussion
P
a
per
|
Discussion
P
a
per
|
data from the Stratospheric and Mesospheric Sounder (SAMS) on Nimbus 7, Stanford and Ziemke (1991) determined empirically that the minimum lifetime for its chemical conversion to H2O is of the order of 3 to 4 months at low latitudes in the upper
strato-sphere or somewhat longer than the time constants for meridional transport. Holton and Choi (1988) and Stanford et al. (1993) used the three-years of SAMS CH4data as
5
a tracer for the characterization of the vertical and meridional components of the sea-sonal net transport. The present analysis study makes use of time series of CH4mixing ratio data as a function of pressure-altitude for 1992–2005 from the Halogen Occulta-tion Experiment (HALOE) aboard the Upper Atmosphere Research Satellite (UARS). While not ideal, atmospheric sampling via solar occultation is adequate for obtaining
10
the large-scale variations of CH4.
The HALOE instrument obtained sunrise and sunset profiles of CH4 in the
strato-sphere and lower mesostrato-sphere, and a number of researchers have made use of its CH4 data for studies of middle atmosphere transport. Ruth et al. (1997), Randel et al. (1998), and later Shu et al. (2013) used the multi-year distributions of the HALOE
15
CH4mixing ratio as a tracer for the effects of semi-annual oscillation (SAO) and
quasi-biennial oscillation (QBO) forcings. Youn et al. (2006) analyzed time series of CH4, H2O, and HF from HALOE for their trends at 10 hPa and at one latitude zone, 40 to
45◦, and they found differences for their trends between the two hemispheres. They related the trends that they found for the Northern Hemisphere to an intensification of
20
stratospheric wave activity over that 14 yr time span.
2 Objectives and analysis approach
The present study is an analysis of time series of the HALOE CH4 for an increasing trend in the subtropical ascent and for a correspondingly increasing trend in the extra-tropical descent in the same hemisphere. Multiple linear regression (MLR) techniques
25
ACPD
14, 24183–24220, 2014Methane as a diagnostic tracer
E. E. Remsberg
Title Page
Abstract Introduction
Conclusions References
Tables Figures
◭ ◮
◭ ◮
Back Close
Full Screen / Esc
Printer-friendly Version Interactive Discussion
Discussion
P
a
per
|
Discus
sion
P
a
per
|
Discussion
P
a
per
|
Discussion
P
a
per
|
Specifically, CH4 time series are considered for separate subtropical and extratropi-cal latitude zones of each hemisphere, as depicted in the simple schematic of Plumb (2007, Fig. 13). The coefficients of the trend terms and their statistical significance are given and discussed in Sect. 3 for the separate latitude zones and as a function of pressure-altitude.
5
Trends from analyses of the HALOE H2O are shown in Sect. 4 and compared with
those from CH4for consistency, since H2O is the primary chemical product of the CH4 oxidation at the upper altitudes. Section 4 also relates the time series of residuals from the analysis of CH4in the lower mesosphere to the de-seasonalized variations in HCl,
another tracer-like molecule for the stratosphere and mesosphere. In particular, it is
10
shown that the residuals from the separate MLR fits to the CH4and HCl series have small, irregular variations of opposite sign. It will be posited that the somewhat anoma-lous variations in the multi-year time series of HALOE HCl for the lower mesosphere that have been analyzed and reported by others are due to effects from non-periodic, wave forcings during 1992–2005. Section 5 is a summary of findings from the present
15
analyses.
The effects of the seasonal, net circulation are apparent from monthly, zonal-mean cross sections of CH4, as shown by Holton and Choi (1988) from the SAMS data and by
Randel et al. (1998) and Shu et al. (2013) from the HALOE data. Qualitatively, there is a net upward transport of CH4at the low latitudes, a net poleward transport throughout
20
the stratosphere, plus a descent of CH4-poor air within the polar vortex beginning at
upper altitudes (cf., Fig. 2). The monthly CH4distributions also often exhibit a significant
mixing ratio gradient from the subtropics to higher latitudes along pressure surfaces in the middle and upper stratosphere. The exact latitude location of the maximum gradient varies seasonally, most likely according to the amount of meridional mixing of the air
25
masses that occurred in the weeks before. The latitude vs. pressure-altitude images of HALOE CH4 at the HALOE Website (http://haloe.gats-inc.com/home/) for October
of successive years indicate that the net vertical transport of the CH4was suppressed
ACPD
14, 24183–24220, 2014Methane as a diagnostic tracer
E. E. Remsberg
Title Page
Abstract Introduction
Conclusions References
Tables Figures
◭ ◮
◭ ◮
Back Close
Full Screen / Esc
Printer-friendly Version Interactive Discussion
Discussion
P
a
per
|
Discus
sion
P
a
per
|
Discussion
P
a
per
|
Discussion
P
a
per
|
1998, 2002, and 2003. Net effects for 1996, 2000, and 2001 are intermediate to those of the other years. Shu et al. (2013) showed that the strength or upward extent of the net circulation is related to the phase of the QBO and/or to the effects of the Rossby-wave forcing. To first order, the isolines for CH4in Fig. 2 and in the HALOE data also indicate that there are distinct BDC branches in the Northern Hemisphere and in the
5
Southern Hemisphere. The sense of that net circulation is upward in the tropics and subtropics and downward in the extratropics.
Points for the data time series of the present study are generated using the HALOE version 19, Level 2 CH4profiles from occurrences of the HALOE sunrise (SR) or sunset
(SS) tangent-point observations within a latitude zone for 1992–2005, as in Remsberg
10
(2008). The SR and SS profiles are binned into extratropical (55±15◦) and subtropical
(14±14◦) zones for the southern and the Northern Hemispheres and at 12
pressure-altitudes, giving a total of 48 separate time series for analysis. Example time series for the southern and northern extratropics are shown in Fig. 3a and b at 7 hPa (near 35 km). Each data point in Fig. 3 is an approximate snapshot of the zonally-averaged
15
CH4 for the latitude zone (cf., Fig. 2). The oscillating curves in Fig. 3 are the MLR
fits to the data points from mid-1992 onward and based on the terms indicated at the lower left of the figure. The near horizontal line is the sum of the constant and linear trend terms. Data in the first year following the Mt. Pinatubo eruption of June 1991 often appear to have been perturbed and are not included for the MLR fittings. Initial
20
analyses indicated that the only significant periodic terms for the extratropics are SAO, annual oscillation (AO), and QBO. Generally, a QBO term of 28 month (or 853 day) pe-riod is dominant in each data series. An additional term is added for the subtropical time series, having a period of 21 months (or 640 days) and labeled IA, or analogous to a modulation of the AO and QBO terms (Dunkerton, 2001). A gap of 12◦ in latitude is
25
imposed between the adjacent edges of the extratropical and subtropical bins to mini-mize effects of the rather large meridional gradients in CH4that may occur between the
two zones. Otherwise a term for the variation of CH4with latitude must be considered
ACPD
14, 24183–24220, 2014Methane as a diagnostic tracer
E. E. Remsberg
Title Page
Abstract Introduction
Conclusions References
Tables Figures
◭ ◮
◭ ◮
Back Close
Full Screen / Esc
Printer-friendly Version Interactive Discussion
Discussion
P
a
per
|
Discus
sion
P
a
per
|
Discussion
P
a
per
|
Discussion
P
a
per
|
MLR models. The accounting for AR-1 effects corrects for minor biases between the MLR model and the CH4points that may occur within short segments of a data series.
Nedoluha et al. (1998) reported that solar cycle (SC) effects on CH4are very small
even near the stratopause; thus, no 11 yr or SC-proxy term was included in the MLR models. However, there is a cooling of the middle atmospheric during this 14 yr time
5
span, due to the increasing atmospheric CO2. Therefore, the analyses are conducted
for time series of the CH4 mixing ratio at pressure-altitudes rather than geometric al-titudes. In this way, the added effects from the contraction of a pressure surface with altitude and time are avoided. To first order then, the variations of CH4 with time at
a pressure level represent the effects of the net diabatic transport both vertically within
10
a zone and horizontally to adjacent latitude regions.
Compare the time series of Fig. 3 for the two extratropical zones. Their variations with time may be interpreted qualitatively with the aid of Fig. 2 showing the nominal distribution of CH4. One can see that the amplitudes of the seasonal terms are different for the two hemispheres. The effects of the SAO and the AO are clear in the Southern
15
Hemisphere in Fig. 3a, where the variations are mainly a result of a radiative relaxation from the effects of the net seasonal heating rather than from the effects of Rossby-wave forcings. The MLR seasonal cycle has its maximum in late autumn, and the constant term has a mean mixing ratio of 0.72 ppmv. Minimum data values of about 0.5 ppmv are apparent for some years in the south and most often in late winter, but they are
20
not fit well by the model. They occur when the measurements for this zone extend into the polar vortex region, where the wintertime diabatic circulation is transporting low values of CH4 downward. Figure 3b shows that a seasonal maximum occurs in late autumn to early winter in the northern extratropics, and its minimum is in late summer. The combined effects of the SAO and AO are of smaller amplitude in the north and
25
ACPD
14, 24183–24220, 2014Methane as a diagnostic tracer
E. E. Remsberg
Title Page
Abstract Introduction
Conclusions References
Tables Figures
◭ ◮
◭ ◮
Back Close
Full Screen / Esc
Printer-friendly Version Interactive Discussion
Discussion
P
a
per
|
Discus
sion
P
a
per
|
Discussion
P
a
per
|
Discussion
P
a
per
|
slightly positive in the south but negative in the north, and that difference is discussed in Sect. 3.
The corresponding CH4time series at 7 hPa are shown for the two subtropical zones
in Fig. 4. Periodic variations in Fig. 4a for the Southern Hemisphere are primarily from the annual and QBO cycles; its average CH4 is about 1.1 ppmv. Effects from the SAO
5
term are not clearly apparent until the upper stratosphere (not shown). The data for the northern subtropics in Fig. 4b indicate a seasonal cycle that is weaker than in the south; interannual effects (QBO and IA) are present, too. There are also occasional data points that appear as low outliers in winter. In general, there is less periodic struc-ture in the CH4of the northern subtropics at this level, most likely because of the mixing
10
effects from the dissipation of Rossby waves and gravity waves. The mixing of air from the middle latitudes is likely responsible for the occurrence of the occasional, low win-tertime data values. Trend coefficients are weakly positive in both hemispheres. At this point it is also noted that changes in the net circulation based on the CH4variations in the southern subtropics may also be affected some by the extratropical wave forcings
15
of the Northern Hemisphere (see also Sect. 3).
Another example time series is shown in Fig. 5 for the northern subtropics at 30 hPa. The dominant periodic term in the data is a weak annual cycle, whose wintertime min-imum reflects the effect of a mixing with older air from the extratropics. A weak QBO-like term is also present in the data, and the mean mixing ratio is 1.43 ppmv. This
20
region ought to be affected most by the air that ascended from the tropical upper tro-posphere to the mid-stratosphere several years earlier. Tropospheric CH4was
increas-ing from 1990–2003 at an average rate of 0.3 % yr−1(or 3 % decade−1) (Dlugokencky
et al., 2009). The linear trend term from the MLR model is increasing and at a rate of 3.7±2.6 % decade−1or essentially equal to that of the tropospheric CH4. Trends in
25
the CH4 time series at higher altitudes are interpreted as indicating a change in the strength of the BDC, when they are positive and significantly larger than 3 % decade−1
ACPD
14, 24183–24220, 2014Methane as a diagnostic tracer
E. E. Remsberg
Title Page
Abstract Introduction
Conclusions References
Tables Figures
◭ ◮
◭ ◮
Back Close
Full Screen / Esc
Printer-friendly Version Interactive Discussion
Discussion
P
a
per
|
Discus
sion
P
a
per
|
Discussion
P
a
per
|
Discussion
P
a
per
|
The retrieved HALOE CH4 mixing ratios in Fig. 5 are only of order 1.2 ppmv in late 1991. Such low values may have been affected by a slight bias error in the lower strato-sphere at that time, due to a reduced accuracy for the measured and retrieved CH4
in the presence of the aerosol layer following the eruption of Mt. Pinatubo. However, Thomason (2012) reported that HALOE CH4 does not appear to be affected by
con-5
tamination from other minor or trace species from its retrieval algorithm, at least after that early volcanic period. The present study considers data points from mid-1992 and onward in the MLR analyses at all latitudes and pressure-altitudes, primarily to avoid contaminating effects in the lower stratosphere and/or anomalous net transport effects at higher altitudes for some months following the eruption.
10
3 Linear trends in CH4
Time series of CH4, like those in Figs. 3 through 5, are analyzed at 55◦S, 14◦S, 14◦N,
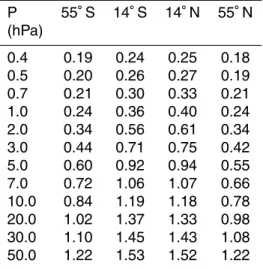
and 55◦N. Table 1 contains the mean mixing ratio profiles of CH4 from the constant terms for each of the four latitude zones. The mean mixing ratio profiles show very good symmetry between the two hemispheres for the subtropics; there is also more
15
CH4 in the subtropics than in the extratropics for both hemispheres. In the middle to lower stratosphere there is slightly more CH4in the southern than in the northern
extra-tropics, an indication that the net wintertime descent is prolonged and/or a bit stronger in the north. At 50 hPa the mixing ratios are very nearly identical between the two hemispheres for the subtropics (1.52 ppmv) and for the extratropics (1.22 ppmv),
indi-20
cating that the tropospheric CH4 that entered the lowest part of tropical stratosphere
was transported poleward and mixed about equally with the higher latitude air. There is also a monotonic decrease of the CH4with altitude in each latitude zone, due to the chemical oxidation of CH4 to H2O. The mean CH4mixing ratio profiles in Table 1
rep-resent qualitatively the effects of the seasonal BDC transport within each hemisphere.
25
ACPD
14, 24183–24220, 2014Methane as a diagnostic tracer
E. E. Remsberg
Title Page
Abstract Introduction
Conclusions References
Tables Figures
◭ ◮
◭ ◮
Back Close
Full Screen / Esc
Printer-friendly Version Interactive Discussion
Discussion
P
a
per
|
Discus
sion
P
a
per
|
Discussion
P
a
per
|
Discussion
P
a
per
|
as in Fig. 2, is indicated here by trends that are positive by more than 3 % decade−1 in the subtropics, but more weakly positive (or negative) in the extratropics. Thus, an acceleration of the BDC leads to a higher CH4value in the subtropics and a lower value in the extratropics or a steepening of its Equator-to-Pole gradient with time for a given pressure-altitude. On the other hand, the effects of meridional mixing can transport
ex-5
tratropical air back to the subtropical zone and cause a net recirculation of CH4(Garny et al., 2014). It is not possible to quantify those separate effects based on the CH4
observations alone. The analyzed trend terms (% decade−1) and the accompanying confidence intervals or CI (in %) that they are present in the time series are given in Table 2. The trend terms indicate only where there is an acceleration of the overall
10
net circulation. Note that the highly significant trends are shown by boldface type; they have a CI equal to or greater than 95 % of being present in the time series. The trend coefficients of the low to middle stratosphere are generally significant in the northern but not the Southern Hemisphere. It is noted that some of the relatively large trends for the CH4time series of the upper stratosphere also carry fairly small uncertainties
15
from the MLR analysis, but those trends are not highly significant because there is non-periodic structure in the time series of their residuals that has not been accounted for. Checking for structure in the residuals is an important part of the MLR analysis.
Figure 6 is a plot of the trend profiles in % decade−1
from Table 2 for the subtropics and the extratropics of the Southern Hemisphere. Their 2σ uncertainties are shown
20
as horizontal bars at selected levels, and the only highly significant trends are in the subtropics at 7 hPa or 7.0 (2.2) and at 10 hPa or 4.0 (2.2). The vertical dashed line represents a trend of 3 % decade−1or equivalent to that of the tropospheric CH4. First,
it appears that the shallow branch of the BDC may have experienced a deceleration at 30 and 20 hPa (or a negative trend in the subtropics and a positive trend in the
ex-25
ACPD
14, 24183–24220, 2014Methane as a diagnostic tracer
E. E. Remsberg
Title Page
Abstract Introduction
Conclusions References
Tables Figures
◭ ◮
◭ ◮
Back Close
Full Screen / Esc
Printer-friendly Version Interactive Discussion
Discussion
P
a
per
|
Discus
sion
P
a
per
|
Discussion
P
a
per
|
Discussion
P
a
per
|
they carry the correct signs for an acceleration of the BDC – larger and positive in the subtropics and large and negative in the extratropics. Still, it is stressed that none of those upper level CH4trend terms are highly significant.
Figure 7 is a plot of the subtropical and extratropical trend profiles from Table 2 for the Northern Hemisphere. The highly significant, northern subtropical trends and their
5
2σ uncertainties are 4.5 (2.6) at 10 hPa, 6.7 (2.5) at 20 hPa, 3.7 (2.6) at 30 hPa, and 2.9 (2.8) at 50 hPa. Significant trends for the northern extratropics are −7.9 (3.9) at
7 hPa, −12 (2.6) at 10 hPa, 2.5 (3.0) at 30 hPa, and 3.8 (2.2) at 50 hPa. The trends
at 50 and 30 hPa vary within 2.5 to 3.8 % decade−1, but they carry the same sign and disagree with the picture of an acceleration of the net circulation or BDC. Instead, they
10
are consistent with the average trend of 3 % decade−1
for the tropospheric CH4, and they indicate that the trends in the extratropics are merely reflecting a net transport of tropical air to the higher latitudes. The CH4trends from 20 hPa to 7 hPa are larger and
positive in the subtropics, and the corresponding extratropical trends are increasingly negatively up to 10 hPa and remain negative even at 7 hPa. Thus, the signs of the
15
trends from those two northern zones imply that there was an acceleration of the BDC in the middle stratosphere. In other words, an acceleration is indicated during this time span for the lower part of the deep branch or for an upward extension of the shallow branch of the BDC.
Youn et al. (2006) obtained a positive linear trend at 10 hPa of 9 % decade−1 at
20
42.5◦S, but almost no trend at 42.5◦N. For comparison purposes, linear trends were also calculated at 10 hPa for the same latitude zones of 40 to 45◦in each hemisphere. Those trends are 8.6 % decade−1in the southern and
−9.4 % decade−1in the Northern
Hemisphere. A primary reason for the differing results for the Northern Hemisphere is that the MLR model of the present study includes periodic terms and the effects of
25
autocorrelation among all terms. The trends for the wider latitude zones herein are 4.8 % decade−1in the south and−12 % decade−1in the north (Table 2).
ACPD
14, 24183–24220, 2014Methane as a diagnostic tracer
E. E. Remsberg
Title Page
Abstract Introduction
Conclusions References
Tables Figures
◭ ◮
◭ ◮
Back Close
Full Screen / Esc
Printer-friendly Version Interactive Discussion
Discussion
P
a
per
|
Discus
sion
P
a
per
|
Discussion
P
a
per
|
Discussion
P
a
per
|
the time constant for the net transport. The trends in Fig. 7 are small (−1.9 % decade−1)
and not significant at 2 hPa in the northern subtropics. This result is inconsistent with the decreasing trends for CH4at low latitudes reported by Nedoluha et al. (1998, their Fig. 1) for the time span of 1991–1997. As a check, a selected re-analysis of the HALOE data was carried out for their latitude zone of 10◦S to 10◦N, but for the
en-5
tire time period of 1991–2005; the MLR fit to that particular time series is shown in Fig. 8. Qualitatively, the structure in the respective time series is the same from late 1991 to early 1997. Yet, Fig. 8 indicates that the HALOE CH4 exhibits a peak value
of order 0.9 ppmv in the spring of 1997 or equivalent to the value in early 1992. Thus, if Nedoluha et al. (1998) had extended their time series for another six months or so,
10
they should not have found a decreasing trend for the HALOE CH4.
Table 2 and Fig. 7 show a negative trend (−5.7 % decade−1) at 1 hPa in the northern
subtropics, indicating that there may have been a deceleration of the net circulation at the uppermost levels of the deep branch of the BDC. Even so, that negative trend is not highly significant because its time series residuals have non-periodic structures
15
that are unaccounted for (see also Sect. 4). The role of changes in the wave forcing on the net circulation is more complicated near the tropical stratopause. It depends on the altitude region for the wave dissipation, as well as effects of the meridional transport and mixing on the CH4. In support of that prospect, Randel et al. (2000) reported that there was a minimum in stratospheric wave forcing for the years 1993–1997, followed
20
by an increase in 1998–1999. An inspection of the latitude vs. pressure-altitude cross sections of CH4 at the HALOE Website indicates that the seasonal BDC (as defined by the character of its monthly CH4 distributions) extends to higher altitudes in the
northern than in the Southern Hemisphere in the early and middle 1990s than for later in the time series (cf., September/October distributions for 1992 and 1994 with those of
25
ACPD
14, 24183–24220, 2014Methane as a diagnostic tracer
E. E. Remsberg
Title Page
Abstract Introduction
Conclusions References
Tables Figures
◭ ◮
◭ ◮
Back Close
Full Screen / Esc
Printer-friendly Version Interactive Discussion
Discussion
P
a
per
|
Discus
sion
P
a
per
|
Discussion
P
a
per
|
Discussion
P
a
per
|
of the SAO or with stratospheric warming events are often pronounced (Hitchman and Leovy, 1986). For example, the qualitative effect during and just following a warming event is to enhance meridional transport of a tracer (like CH4) in the upper stratosphere
and mesosphere. Pawson and Naujokat (1999) recorded no midwinter warming events for the Northern Hemisphere in the middle 1990s; Manney et al. (2005) reported that
5
midwinter warming events were more prevalent after that. Thus, it may be that the subtropical trend profiles are merely reflecting the effects of changes in stratospheric wintertime warming activity during 1992–2005, rather than representing any longer-term trend for a change of the deep branch of the BDC at those upper levels. Such dynamical forcings would tend to be of large amplitude, but somewhat episodic, and
10
they may explain most of the structure that is present in the MLR model residuals for the upper stratosphere and lower mesosphere of the Northern Hemisphere.
4 Trends in H2O and HCl
Supporting evidence is sought from the concurrent trends in HALOE H2O. Trend
pro-files are obtained from HALOE H2O using the same terms that were applied in the
15
MLR models for CH4, and the results are compared for the extratropics in Figs. 9 and 10. First, it is noted that the mean mixing ratio profiles for H2O are nearly symmetric
for each latitude zone between the two hemispheres (not shown). H2O values for the
subtropics increase from about 3.9 ppmv at 50 hPa to about 6.2 ppmv at 0.3 hPa. H2O increases in the upper stratosphere from the subtropics to the extratropics, due mostly
20
to the oxidation of CH4 to H2O and to its net transport poleward. To first order, half of
the H2O in the upper stratosphere and lower mesosphere is the result of the chemical
oxidation of CH4 to H2O, and the sum of 2CH4+H2O is nearly conserved (Brasseur and Solomon, 2005). Therefore, it is expected that the trends for CH4 vs. those for
H2O will have a 2 : 1 ratio at those altitudes but be opposite in sign. The remaining
25
ACPD
14, 24183–24220, 2014Methane as a diagnostic tracer
E. E. Remsberg
Title Page
Abstract Introduction
Conclusions References
Tables Figures
◭ ◮
◭ ◮
Back Close
Full Screen / Esc
Printer-friendly Version Interactive Discussion
Discussion
P
a
per
|
Discus
sion
P
a
per
|
Discussion
P
a
per
|
Discussion
P
a
per
|
3.5 ppmv. Seasonally-varying, entry-level values have been reported for the HALOE H2O of the lower stratosphere (see Randel et al., 2006). Therefore, the H2O and CH4
trends are shown for the extratropics only, and the H2O trends are not plotted for the
lower stratosphere.
The trend terms for H2O are highly significant in the extratropics of the Southern
5
Hemisphere from 2 hPa to 0.3 hPa in Fig. 9. The trends for CH4 in that altitude region
also have a fairly high CI of between 73 and 92 %, and they vary from−8.4 to−11 % in
Fig. 6 (and in Table 2). The trends for H2O are opposite in sign and vary between 3.0
and 4.6 % in Fig. 9 and are in good accord with expectations from the methane oxida-tion chemistry. The respective trends for the extratropics of the Northern Hemisphere
10
also have opposing signs, but their magnitudes do not agree as well with the simple estimates from the conversion of CH4to H2O (cf., Figs. 7 and 10).
Trends in H2O in the middle stratosphere in Fig. 9 are slightly negative in the
south-ern extratropics and they are more negative in the subtropics (not shown). This finding reflects changes for the H2O entering the stratosphere during 1992–2005. In fact,
Ran-15
del et al. (2006) reported observing a sharp decrease in HALOE H2O in 2001 that
persisted through 2005, and they ascribed that decrease to a change in the BDC near the tropopause. The linear trends for H2O from the current study are also negative and
highly significant at 50 hPa and at most other levels of the lower stratosphere. However, there are large differences in the H2O trends at 7 and 10 hPa across the two subtropical
20
zones of each hemisphere (cf., Figs. 9 and 10), indicating differences for the net trans-port within the hemispheres. Further, the H2O trend in the Northern Hemisphere at
5 hPa is positive and highly significant or 4.6 (0.3) % decade−1. Taking into account the
age-of-air for 55◦N, that finding agrees with the long-term trend of about 6 % decade−1 that was reported as representative of H2O for the years prior to 2001 (Scherer et al.,
25
2008).
To summarize the joint findings from CH4 and H2O, the trends from CH4 are
ACPD
14, 24183–24220, 2014Methane as a diagnostic tracer
E. E. Remsberg
Title Page
Abstract Introduction
Conclusions References
Tables Figures
◭ ◮
◭ ◮
Back Close
Full Screen / Esc
Printer-friendly Version Interactive Discussion
Discussion
P
a
per
|
Discus
sion
P
a
per
|
Discussion
P
a
per
|
Discussion
P
a
per
|
a change in the BDC in the Southern Hemisphere, except perhaps for the extratrop-ics of the lower mesosphere. The weakly positive CH4 trends of the lowest part of the
stratosphere (or below the 20-hPa level) are merely indicative of the slow increases of tropospheric CH4 during 1992–2005. The concurrent trends for CH4 and H2O are highly significant in the lower stratosphere of the Northern Hemisphere, but the trend
5
for H2O is judged as mainly a result of the episodic change in 2001 for the entry-level
H2O. The H2O trends for the middle stratosphere are negative in the southern but not in the Northern Hemisphere, most likely because of a more vigorous meridional mixing of the air masses in the Northern Hemisphere. Together then, the trends from both CH4
and H2O indicate that the low altitude part of the deep branch of the BDC underwent
10
an acceleration up to near 7 hPa in the Northern Hemisphere during 1992–2005. Figure 11 is the MLR model fit to the CH4time series data at 0.7 hPa of the northern
extratropics and subtropics. Note that the IA term is not important at 0.7 hPa and is excluded in the subtropical MLR model of Fig. 11. The extratropical minimum occurs in late summer, due to the nearly complete oxidation of the CH4at that time. Conversely,
15
there is a maximum in the subtropics in late summer in response to the diabatic circula-tion associated with the radiative relaxacircula-tion away from the very warm temperatures of the polar summer stratopause. Upon closer inspection, one can readily see that these predominant, annual cycle variations in the data of the extratropics are underestimated by the MLR model terms in 1992, in 1998–1999, and in 2003–2005 and overestimated
20
in 2000 and 2001. The late summer maximum of the subtropics is overestimated by the model in 1996 and in 2000–2001; the model also clearly underestimates the data in the winter of 1997–1998. Occasional seasonal amplitude anomalies are also present in the CH4analysis for the southern subtropics, but are nearly absent in the southern
extratropics (not shown). Of course, the seasonal terms of the MLR model simply
pro-25
vide an average fit to the data across all the years. Thus, the time series of HALOE CH4 of the Northern Hemisphere indicate that there must be a connection to effects
ACPD
14, 24183–24220, 2014Methane as a diagnostic tracer
E. E. Remsberg
Title Page
Abstract Introduction
Conclusions References
Tables Figures
◭ ◮
◭ ◮
Back Close
Full Screen / Esc
Printer-friendly Version Interactive Discussion
Discussion
P
a
per
|
Discus
sion
P
a
per
|
Discussion
P
a
per
|
Discussion
P
a
per
|
MLR/data mismatch with the aid of a model study for a CH4-like tracer, transported with the aid of assimilated temperature and ozone fields for those years.
A number of investigators have analyzed time series of HCl in the lower mesosphere to verify concurrent changes in the effects of reactive chlorine on ozone (e.g., Froide-vaux et al., 2006). HCl is the primary product of the chemical conversion of free chlorine
5
from methyl chloride and from CFC molecules in the upper stratosphere (Brasseur and Solomon, 2005). For this reason HCl may also be considered as a tracer-like species for studying transport and age-of-air, particularly for the uppermost stratosphere and lower mesosphere. Model studies show peak values of HCl occurring in the lower mesosphere in 1999, while the HCl time series from HALOE at 0.46 hPa and up to
10
2001 indicated that the observed maximum occurred a year of two earlier or in 1997 (e.g., Waugh et al., 2001). However, the complete time series of HALOE HCl shows two maxima – one in 1997 and another from 2001–2002 (WMO, 2007, Figs. 1–12). It may be that there were significant variations in the observed HCl due to dynamical forcings at those altitudes, and the transport models do not represent them so well.
15
The MLR models of the present study are fitting the periodic terms in the observed data fairly well. But as indicated in the CH4time series of Fig. 11, some forcing effects are not periodic. In particular, major stratospheric, midwinter warming events can alter the distributions of tracers, but not in the same way each year and perhaps not ev-ery winter. Further, the usual method of de-seasonalizing a data time series can also
20
impart significant structure to the MLR model residuals.
Spatial gradients for CH4and HCl in the lower mesosphere are opposite in sign both
vertically and in the meridional direction, such that any anomalies in their respective residuals should have opposing features that would tend to confirm effects from dy-namical forcings. Therefore, MLR analyses are applied to time series of both CH4and
25
dur-ACPD
14, 24183–24220, 2014Methane as a diagnostic tracer
E. E. Remsberg
Title Page
Abstract Introduction
Conclusions References
Tables Figures
◭ ◮
◭ ◮
Back Close
Full Screen / Esc
Printer-friendly Version Interactive Discussion
Discussion
P
a
per
|
Discus
sion
P
a
per
|
Discussion
P
a
per
|
Discussion
P
a
per
|
ing 1992–2005. Figure 12 shows time series of the residuals (data minus MLR model curve) for HCl in the northern extratropical zone at 0.7 hPa (near 52 km). In general, the residuals indicate a good fit to the data, although they tend to be mostly negative from late 1998 through 1999 and mostly positive in 1995–1996 and in 2001. Figure 13 shows the corresponding residuals for CH4; they indicate little to no bias from 1992
5
to mid-1999, but then a clear negative bias in 2000 and 2001, or opposite to that from HCl. Thus, there is aperiodic structure remaining in the residuals for both HCl and CH4, and their opposing signs indicate that the net circulation at this level is being altered by dynamical forcings. In fact, it should be clear that one ought to achieve more consistent HCl model/data comparisons by analyzing time series of the HCl within a latitude zone
10
but referenced to a constant CH4level instead of to an altitude or even a pressure level. A corollary is that it is important to know how well a given chemistry/climate model is able to simulate the observed time series of the CH4, too. Further, it should be possible
to extend the HALOE CH4 and HCl time series by considering data from the Atmo-spheric Chemistry Experiment (ACE), which began providing operational data early in
15
2004 (Bernath, 2013) and/or data from the Michelson Interferometer for Passive Atmo-spheric Sounding (MIPAS) that began operations in 2002 (Fischer and Oelhaf, 1996).
5 Conclusions
Time series of the tracer-like molecule CH4 obtained with the UARS HALOE exper-iment are analyzed using MLR techniques for their periodic and trend terms during
20
1992–2005. The sunset and sunrise profile data are binned according to subtropical and extratropical latitude zones in both the southern and Northern Hemispheres. Time series are generated and analyzed from 50 to 0.4 hPa. Based on an examination of the data time series, both seasonal and interannual terms are included in the MLR models, in addition to a linear trend term. The trend terms are examined to see whether there
25
hemi-ACPD
14, 24183–24220, 2014Methane as a diagnostic tracer
E. E. Remsberg
Title Page
Abstract Introduction
Conclusions References
Tables Figures
◭ ◮
◭ ◮
Back Close
Full Screen / Esc
Printer-friendly Version Interactive Discussion
Discussion
P
a
per
|
Discus
sion
P
a
per
|
Discussion
P
a
per
|
Discussion
P
a
per
|
spheric BDC. The adoption of that concept suggests that an acceleration of the circu-lation is indicated whenever the CH4 trends are positive by more than 3 % decade−
1
in the subtropics and less than that or negative in the extratropics. Further, since the analyses are conducted at pressure levels rather than at geometric altitudes, it is pre-sumed that any significant trends must be due mainly to changes in the effects of wave
5
forcings on the distributions of CH4.
The primary findings of this study are as follows. The CH4trend terms for the North-ern Hemisphere are significant from 50 to 7 hPa. They are positive in the subtropics and larger than the tropospheric CH4 trends of about 3 % decade−
1
from 20 to 7 hPa. In the northern extratropics the trends are clearly negative at 10 and 7 hPa. At those
10
levels the overall trend signature across those two zones represents an acceleration of the BDC for the Northern Hemisphere. The CH4trends are positive and significant at
7 and 10 hPa for the southern subtropics, but the corresponding trends in the southern extratropics are also positive; thus, their combination is not in the proper sense for in-dicating an acceleration or deceleration of the southern hemispheric BDC. CH4trends
15
are not highly significant for the stratosphere above the 7-hPa level in either zone of both hemispheres. The early climate model simulations of Rind et al. (1990) are quali-tatively consistent with these findings, in that their model runs show more wave activity and dissipation throughout the winter in the northern than in the Southern Hemisphere for their model scenario of steady increases of CO2in the atmosphere. Still, it may be
20
that estimates of the net circulation from HALOE are only representative of 1992–2005. The trends for HALOE H2O are compared for the extratropics with those from CH4
in the upper stratosphere and lower mesosphere because H2O is the primary product of the oxidation of CH4at those altitudes. An approximate inverse and 2 : 1 relationship
between their trends (CH4: H2O) is found near the stratopause in both hemispheres,
25
ACPD
14, 24183–24220, 2014Methane as a diagnostic tracer
E. E. Remsberg
Title Page
Abstract Introduction
Conclusions References
Tables Figures
◭ ◮
◭ ◮
Back Close
Full Screen / Esc
Printer-friendly Version Interactive Discussion
Discussion
P
a
per
|
Discus
sion
P
a
per
|
Discussion
P
a
per
|
Discussion
P
a
per
|
The variation of CH4 with time in the lower mesosphere also provides some clues about the effects of aperiodic wave forcings in the lower mesosphere. Others have noted that there are modest disagreements in the modeled trends for HCl compared to those observed with HALOE, particularly from about 1996 to 2002. But both CH4and HCl should serve as tracers of changes due to dynamical forcings. It is shown that their
5
respective time series residuals are anti-correlated. A part of the anomalies in the CH4
residuals is due to the significant variations in the seasonal amplitudes of the observed CH4, and they are ascribed to wave-driven, secondary residual circulations associated
with the SAO and QBO. Therefore, a better approach would be to analyze for trends in HCl as referenced to constant CH4values. In summary, it is concluded that near-global
10
distributions of CH4, as remotely measured from a satellite, are an excellent diagnostic of the effects of seasonal and longer-term changes in the transport within the middle atmosphere.
Acknowledgements. Figure 1 is attributed to Ted Shepherd, Doug Degenstein, and the Optical Spectrograph and InfraRed Imager System (OSIRIS) satellite experiment Team. Figure 2 was 15
kindly provided by Eric Fleming of SSAI and NASA Goddard. The author (EER) carried out this work while serving as a Distinguished Research Associate within the Science Directorate at NASA Langley.
References
Bernath, P. F. (ed.): The Atmospheric Chemistry Experiment ACE at 10: A Solar Occultation 20
Anthology, A. Deepak Publ., Hampton, Virginia, 532 pp., 2013.
Brasseur, G. and Solomon, S.: Aeronomy of the middle atmosphere, 3rd Edition, in Atmospheric and Oceanographic Sciences Library, vol. 32, Springer, the Netherlands, 644 pp., 2005. Butchart, N.: The Brewer–Dobson circulation, Rev. Geophys., 52, 157–184, 2014.
Dlugokencky, E. J., Bruhwiler, L., White, J. W. C., Emmons, L. K., Novelli, P. C., Montzka, S. A., 25
ACPD
14, 24183–24220, 2014Methane as a diagnostic tracer
E. E. Remsberg
Title Page
Abstract Introduction
Conclusions References
Tables Figures
◭ ◮
◭ ◮
Back Close
Full Screen / Esc
Printer-friendly Version Interactive Discussion
Discussion
P
a
per
|
Discus
sion
P
a
per
|
Discussion
P
a
per
|
Discussion
P
a
per
|
Dunkerton, T. J.: On the mean meridional mass motions of the stratosphere and mesosphere, J. Atmos. Sci., 35, 2325–2333, 1978.
Dunkerton, T. J.: Quasi-biennial and subbiennial variations of stratospheric trace constituents derived from HALOE observations, J. Atmos. Sci., 58, 7–25, 2001.
Fischer, H. and Oelhaf, H.: Remote sensing of vertical profiles of atmospheric trace constituents 5
with MIPAS limb emission spectrometers, Appl. Opt., 35, 2787–2796, 1996.
Fleming, E. L., Jackman, C. H., Stolarski, R. S., and Considine, D. B.: Simulation of strato-spheric tracers using an improved empirically based two-dimensional model transport for-mulation, J. Geophys. Res., 104, 23911–23934, 1999.
Froidevaux, L., Livesey, N. J., Read, W. G., Salawitch, R. J., Waters, J. W., Brouin, B., MacKen-10
zie, I. A., Pumphrey, H. C., Bernath, P., Boone, C., Nassar, R., Montzka, S., Elkins, J., Cun-nold, D., and Waugh, D.: Temporal decrease in upper atmospheric chlorine, Geophys. Res. Lett., 33, L23812, doi:10.1029/2006GL027600, 2006.
Garcia, R. R, Randel, W. J., and Kinnison, D. E.: On the determination of age of air trends from atmospheric trace species, J. Atmos. Sci., 68, 139–154, doi:10.1175/2010JAS3527.1, 2011. 15
Garny, H., Birner, T., Boenisch, H., and Bunzel, F.: The effects of mixing on age of air, J. Geo-phys. Res., 119, 7015–7034, doi:10.1002/2013JD021417, 2014.
Hitchman, M. H. and Leovy, C. B.: Evolution of the zonal mean state in the equatorial middle atmosphere during October 1978–May 1979, J. Atmos. Sci., 43, 3159–3176, 1986.
Holton, J. R. and Choi, W- K.: Transport circulation deduced from SAMS trace species data, J. 20
Atmos. Sci., 45, 1929–1939, 1988.
Lin, P. and Fu, Q.: Changes in various branches of the Brewer–Dobson circulation from an ensemble of chemistry climate models, J. Geophys. Res., 118, 73–84, doi:10.1029/2012JD018813, 2013.
Manney, G. L., Zurek, R. W., O’Neill, A., and Swinbank, R.: On the motion of air through the 25
stratospheric polar vortex, J. Atmos. Sci., 51, 2973–2994, 1994.
Manney, G. L., Krüger, K., Sabutis, J. L., Sena, S. A., and Pawson, S.: The remarkable 2003– 2004 winter and other recent warm winters in the Arctic stratosphere since the late 1990s, J. Geophys. Res., 110, 1–14, doi:10.1029/2004JD005367, 2005.
Nedoluha, G. E., Siskind, D. E., Bacmeister, J. T., Bevilacqua, R. M., and Russell III, J. M.: 30
ACPD
14, 24183–24220, 2014Methane as a diagnostic tracer
E. E. Remsberg
Title Page
Abstract Introduction
Conclusions References
Tables Figures
◭ ◮
◭ ◮
Back Close
Full Screen / Esc
Printer-friendly Version Interactive Discussion
Discussion
P
a
per
|
Discus
sion
P
a
per
|
Discussion
P
a
per
|
Discussion
P
a
per
|
Okamoto, K., Sato, K., and Akiyoshi, H.: A study on the formation and trend of the Brewer– Dobson circulation, J. Geophys. Res., 116, D10117, doi:10.1029/2010JD014953, 2011. Pawson, S. and Naujokat, B.: The cold winters of the middle 1990s in the northern lower
strato-sphere, J. Geophys. Res., 104, 14209–14222, 1999.
Plumb, R. A.: Tracer interrelationships in the stratosphere, Rev. Geophys., 45, RG4005, 5
doi:10.1029/2005RG000179, 2007.
Plumb, R. A. and Ko, M. K. W.: Interrelationships between mixing ratios of long-lived strato-spheric constituents, J. Geophys. Res., 97, 10145–10156, 1992.
Randel, W. J., Wu, F., Russell III, J. M., Roche, A., and Waters, J. W.: Seasonal cycles and QBO variations in stratospheric CH4and H2O observed in UARS HALOE data, J. Atmos. Sci., 55, 10
163–185, 1998.
Randel, W. J., Wu, F., Russell III, J. M., Zawodny, J. M., and Nash, J.: Interannual changes in stratospheric constituents and global circulation derived from satellite data, in: Atmo-spheric Science Across the Stratopause, edited by: Siskind, D. E., Eckermann, S. D., and Summers, M. E., American Geophysical Union, Washington, DC, doi:10.1029/GM123p0271, 15
271–285, 2000.
Randel, W. J., Wu, F., Voemel, H., Nedoluha, G. E., and Forster, P.: Decreases in stratospheric water vapor after 2001: links to changes in the tropical tropopause and the Brewer–Dobson circulation, J. Geophys. Res., 111, D12312, doi:10.1029/2005JD006744, 2006.
Remsberg, E. E.: On the response of Halogen Occultation Experiment (HALOE) stratospheric 20
ozone and temperature to the 11-yr solar cycle forcing, J. Geophys. Res., 113, D22304, doi:10.1029/2008JD010189, 2008.
Rind, D., Suozzo, R., Balachandran, N. K., and Prather, M. J.: Climate changes and the middle atmosphere. Part I: the doubled CO2climate, J. Atmos. Sci., 47, 475–494, 1990.
Ruth, S., Kennaugh, R., Gray, L. J., and Russell III, J. M.: Seasonal, semiannual, and interan-25
nual variability seen in measurements of methane made by the UARS Halogen Occultation Experiment, J. Geophys. Res., 102, 16189–16199, 1997.
Scherer, M., Vömel, H., Fueglistaler, S., Oltmans, S. J., and Staehelin, J.: Trends and variability of midlatitude stratospheric water vapour deduced from the re-evaluated Boulder balloon se-ries and HALOE, Atmos. Chem. Phys., 8, 1391–1402, doi:10.5194/acp-8-1391-2008, 2008. 30
Shaw, T. A. and Shepherd, T. G.: Raising the roof, Nat. Geosci., 1, 12–13, 2008.
ACPD
14, 24183–24220, 2014Methane as a diagnostic tracer
E. E. Remsberg
Title Page
Abstract Introduction
Conclusions References
Tables Figures
◭ ◮
◭ ◮
Back Close
Full Screen / Esc
Printer-friendly Version Interactive Discussion
Discussion
P
a
per
|
Discus
sion
P
a
per
|
Discussion
P
a
per
|
Discussion
P
a
per
|
Shu, J., Tian, W., Hu, D., Zhang, J., Shang, L., Tian, H., and Xie, F.: Effects of the quasi-biennial oscillation and stratospheric semiannual oscillation on tracer transport in the upper stratosphere, J. Atmos. Sci., 70, 1370–1389, doi:10.1175/JAS-D-12-053.1, 2013.
Solomon, S., Kiehl, J. T., Garcia, R. R., and Grose, W.: Tracer transport by the diabatic circula-tion deduced from satellite observacircula-tions, J. Atmos. Sci., 43, 1603–1617, 1986.
5
Stanford, J. L. and Ziemke, J. R.: CH4 and N2O photochemical lifetimes in the upper strato-sphere: in situ estimates using SAMS data, Geophys. Res. Lett., 18, 677–680, 1991. Stanford, J. L., Ziemke, J. R., and Gao, S. Y.: Stratospheric circulation features deduced from
SAMS constituent data, J. Atmos. Sci., 50, 226–246, 1993.
Thomason, L. W.: Toward a combined SAGE II-HALOE aerosol climatology: an evaluation of 10
HALOE version 19 stratospheric aerosol extinction coefficient observations, Atmos. Chem. Phys., 12, 8177–8188, doi:10.5194/acp-12-8177-2012, 2012.
Waugh, D. W., Considine, D. B., and Fleming, E. L.: Is upper stratospheric chlorine decreasing as expected?, Geophys. Res., Lett., 28, 1187–1190, 2001.
World Meteorological Organization: Scientific assessment of ozone depletion: 2006, Global 15
Ozone Research and Monitoring Project, Report No. 50, Geneva, Switzerland, 2007. Youn, D., Choi, W., Lee, H., and Wuebbles, D. J.: Interhemispheric differences in changes of
ACPD
14, 24183–24220, 2014Methane as a diagnostic tracer
E. E. Remsberg
Title Page
Abstract Introduction
Conclusions References
Tables Figures
◭ ◮
◭ ◮
Back Close
Full Screen / Esc
Printer-friendly Version Interactive Discussion
Discussion
P
a
per
|
Discus
sion
P
a
per
|
Discussion
P
a
per
|
Discussion
P
a
per
|
Table 1.Mean CH4mixing ratio profiles (ppmv).
P 55◦S 14◦S 14◦N 55◦N (hPa)
0.4 0.19 0.24 0.25 0.18
0.5 0.20 0.26 0.27 0.19
0.7 0.21 0.30 0.33 0.21
1.0 0.24 0.36 0.40 0.24
2.0 0.34 0.56 0.61 0.34
3.0 0.44 0.71 0.75 0.42
5.0 0.60 0.92 0.94 0.55
7.0 0.72 1.06 1.07 0.66
10.0 0.84 1.19 1.18 0.78
20.0 1.02 1.37 1.33 0.98
30.0 1.10 1.45 1.43 1.08
ACPD
14, 24183–24220, 2014Methane as a diagnostic tracer
E. E. Remsberg
Title Page
Abstract Introduction
Conclusions References
Tables Figures
◭ ◮
◭ ◮
Back Close
Full Screen / Esc
Printer-friendly Version Interactive Discussion
Discussion
P
a
per
|
Discus
sion
P
a
per
|
Discussion
P
a
per
|
Discussion
P
a
per
|
Table 2.CH4trend profiles (% decade−1) and their confidence intervals (%) per latitude zone.
Pressure 55◦S 14◦S 14◦N 55◦N
(hPa)
0.4 −8.4, 73 7.2, 2 8.0, 24 −15.0, 89 0.5 −10.0, 80 7.2, 2 5.5, 20 −16.0, 90 0.7 −11.0, 91 6.6, 2 −2.6, 36 −16.0, 90 1.0 −11.0, 92 5.2, 6 −5.7, 34 −14.0, 88 2.0 −6.3, 64 2.7, 18 −1.9, 33 −8.1, 78 3.0 −1.2, 19 8.2, 52 0.9, 16 −5.7, 72
5.0 3.5, 43 7.0, 88 6.7, 48 −4.7, 89
7.0 4.3, 82 7.0, 98 4.7, 83 −7.9, 97
10.0 4.8, 93 4.0, 98 4.5, 98 −12.0, 97
20.0 5.0, 56 −0.3, 36 6.7, 99 −3.0, 68
30.0 2.1, 9 −1.1, 46 3.7, 99 2.5, 95
ACPD
14, 24183–24220, 2014Methane as a diagnostic tracer
E. E. Remsberg
Title Page
Abstract Introduction
Conclusions References
Tables Figures
◭ ◮
◭ ◮
Back Close
Full Screen / Esc
Printer-friendly Version Interactive Discussion
Discussion
P
a
per
|
Discus
sion
P
a
per
|
Discussion
P
a
per
|
Discussion
P
a
per
|
Figure 1.Brewer–Dobson circulation (BDC) and stratospheric ozone. The sense of this net
ACPD
14, 24183–24220, 2014Methane as a diagnostic tracer
E. E. Remsberg
Title Page
Abstract Introduction
Conclusions References
Tables Figures
◭ ◮
◭ ◮
Back Close
Full Screen / Esc
Printer-friendly Version Interactive Discussion
Discussion
P
a
per
|
Discus
sion
P
a
per
|
Discussion
P
a
per
|
Discussion
P
a
per
|
Figure 2.Methane distribution (ppmv) for January based on a chemistry and transport model
ACPD
14, 24183–24220, 2014Methane as a diagnostic tracer
E. E. Remsberg
Title Page
Abstract Introduction
Conclusions References
Tables Figures
◭ ◮
◭ ◮
Back Close
Full Screen / Esc
Printer-friendly Version Interactive Discussion
Discussion
P
a
per
|
Discus
sion
P
a
per
|
Discussion
P
a
per
|
Discussion
P
a
per
|
Figure 6.Subtropical and extratropical trend profiles for CH4 in the Southern Hemisphere.
ACPD
14, 24183–24220, 2014Methane as a diagnostic tracer
E. E. Remsberg
Title Page
Abstract Introduction
Conclusions References
Tables Figures
◭ ◮
◭ ◮
Back Close
Full Screen / Esc
Printer-friendly Version Interactive Discussion
Discussion
P
a
per
|
Discus
sion
P
a
per
|
Discussion
P
a
per
|
Discussion
P
a
per
|
Figure 8. Time series of HALOE CH4 at 2 hPa at low latitudes for comparison with that of
ACPD
14, 24183–24220, 2014Methane as a diagnostic tracer
E. E. Remsberg
Title Page
Abstract Introduction
Conclusions References
Tables Figures
◭ ◮
◭ ◮
Back Close
Full Screen / Esc
Printer-friendly Version Interactive Discussion
Discussion
P
a
per
|
Discus
sion
P
a
per
|
Discussion
P
a
per
|
Discussion
P
a
per
|