Predictors of 10-year hospital use in a
community-dwelling population of Brazilian
elderly: the Bambuí Cohort Study of Aging
Fatores associados à hospitalização em 10 anos
entre uma coorte de idosos brasileiros: Estudo de
Coorte de Idosos de Bambuí
1 New York University, New
York, USA.
2 Programa de Pós-graduação em Saúde Pública, Universidade Federal de Minas Gerais, Belo Horizonte, Brasil.
3 Núcleo de Estudos
em Saúde Pública e Envelhecimento, Fundação Oswaldo Cruz/Universidade Federal de Minas Gerais, Belo Horizonte, Brasil.
Correspondence J. Macinko New York University. 35 W 4th Street, 12th Floor, New York, NY 10012, USA. [email protected]
James Macinko 1 Vitor Camargos 2 Josélia O. A. Firmo 3
Maria Fernanda Lima-Costa 3
Abstract
We use data from a population-based cohort of elderly Brazilians to assess predictors of hospi-talizations during ten years of follow-up. Partici-pants were 1,448 persons aged 60 years and over at baseline (1997). The outcome was self-reported number of hospitalizations per year. Slightly more than a fifth (23%) experienced no hospi-talizations during the 10 year follow-up. About 30% had 1-2 events, 31% had between 3 and 7 events, and about 18% had 8 or more events dur-ing this time. Results of multivariable hurdle and Cox proportional hazards models showed that the risk of hospitalization was positively associ-ated with male sex, increased age, chronic condi-tions, and visits to the doctors in the previous 12 months. Underweight was a predictor of any hos-pitalization, while obesity was an inconsistent predictor of hospitalization.
Aged; Hospitalization; Cohort Studies
Introduction
In Brazil as in other countries around the world, planning for the health needs of rapidly aging populations is a priority. But there is a shortage of data available on how populations use health services as they age, given previous exposures, risk factors, and chronic conditions. The need to gather both descriptive and predictive data on hospital use is particularly relevant in Brazil where the government pays for about 80% of all hospitalizations, which in turn consume nearly 70% of all national health expenditures 1,2.
Methods
The Bambuí Cohort Study of Aging has been car-ried out in the town of Bambuí (with approxi-mately 15,000 inhabitants), situated in South-eastern Brazil, which in 1997 (the baseline year) had a human development index (HDI) of 0.70 and life expectancy at birth of 70.2 years 4,5. The study population comprised all inhabitants aged 60 and above residing in the town on 1 January, 1997. A complete census was carried out for enu-meration and identification of participants: 1606 (92.2%) from all 1,742 residents participated in the cohort baseline. Blood collection and other examinations were performed in 85.8% of the eligible elderly. The study objectives, design and procedures have been described previously 4,5. Cohort members undergo annual follow-up vis-its, which consist of an interview and verification of death certificates. In the present analysis, we used data from the baseline to the 2007 inter-views, yielding a ten-year follow-up period.
In terms of health services, Bambuí had one general hospital with 62 beds, 15 physicians (around 1 per 1,000 inhabitants), and a govern-ment polyclinic providing 24 hour access to ur-gent care. At baseline, the town had 545 public hospital admissions among those aged 60 or over, the principal causes of which were heart failure and bacterial pneumonia 6. Principal causes of death were stroke, Chagas disease, and coronary heart disease during this period 4,5. Demographic variables measured at baseline considered in this study included age (measured in five-year age groups versus 60-64 years), sex, and marital status (married or cohabiting versus single, divorced or widowed). Socioeconomic conditions included self-reported private health insurance, number of completed years of schooling (< 3 years, 4-7 years,
≥ 8 years), and family monthly income in Brazil-ian minimum wages in tertiles (equal to about US$120 in 1997). Health status measures include underweight (measured body mass index – BMI
≤ 18.5kg/m2), obesity (BMI ≥ 30kg/m2), current smoking (those reporting having smoked at least 100 cigarettes during their lifetime and were still smokers at baseline), hypertension (systolic blood pressure ≥ 140mm/Hg, diastolic blood pressure ≥
90mm/Hg, and/or antihypertensive medication use), diabetes mellitus (fasting blood glucose level ≥ 126mg/dL and/or current use of insulin or oral antidiabetic drug treatment), prior stroke (response to lifetime history of stroke instrument) 7, previous medical diagnosis of arthritis or coro-nary heart disease, infection with Trypanosoma cruzi [defined by seropositivity in three assays performed concurrently: a hemagglutination as-say (Bio-Mérieux, Craponne, France), and two
enzyme-linked immunoabsorbent assays (Ab-bott, Abbott Park, USA and Wiener, Rosario, Ar-gentina)], and the self-reported number of doc-tor visits during the baseline year (divided into quartiles). Further details are described elsewhere 4,5. Each of these factors has been associated with hospitalization in previous cross-sectional and/ or cohort studies 6,8,9,10,11.
Participants signed an informed consent and authorized death certificate and hospital records verification. The Bambuí cohort study was ap-proved by the Ethics Research Committee of the Oswaldo Cruz Foundation (Fundação Oswaldo Cruz), Brazil.
Statistical analysis
The main outcome was a self-report of the num-ber of hospitalizations per year. We excluded hospitalizations for the baseline year in order to assess risk factors for subsequent hospital use. We also excluded individuals with missing base-line measures to yield a final sample size of 1,448. Statistically significant characteristics of those with any missing data included older age, fewer chronic conditions, lower income, and lower schooling. In sensitivity tests, including those with missing data did not alter any of the main findings of the study.
We present descriptive statistics, means and proportions for all explanatory variables, strati-fied by number of hospitalizations. Then, to identify factors associated with having any hos-pitalization during follow up, we employ a hur-dle model 12. This model assumes that different factors may determine whether someone is ever hospitalized as opposed to the total number of hospitalizations (or the intensity of use) they might have. The first stage models the likelihood of any hospitalization using logistic regression. The second stage uses a zero-inflated negative binomial model to estimate predictors of the numbers of subsequent hospitalizations among those who have had at least one. We present odds ratios (for logistic regression) and prevalence ra-tios (for negative binomial regression along with 95% confidence intervals – 95%CI).
For failure time analysis, we constructed a measure of the time, in years, to first hospitaliza-tion from baseline. Subsequent hospitalizahospitaliza-tions were also measured from baseline. When mul-tiple hospitalizations were reported for the same year, we assumed these were equally spaced throughout the year since we did not have the exact date for each admission.
plan, income, schooling), and health/risk fac-tors (smoking, weight, chronic conditions, doc-tor visits), as defined above. Although traditional event history models have only a single possible failure (usually the subject’s death), our model allows for repeated failures, since an individual can be hospitalized multiple times per year and in multiple years. We assessed two different ap-proaches to modeling such data. The first, known as the Anderson-Gill model 13 for repeated events includes all subjects, handles dependence of events through clustering among individuals (us-ing robust standard errors), assumes a common exposure effect is sustained over time, and also assumes a common baseline hazard function – that is, that prior hospitalization will not influ-ence one’s chances of a subsequent hospitaliza-tion 13,14,15. The second approach (proposed by Prentice, Williams, and Peterson) is known as a gap time model. It assumes that the individual is not at risk for the second event until the first has already occurred and estimates the failure time between each event 16.
For failure time models, both death and drop-out were considered censoring events. The as-sumption of proportional hazards was tested and confirmed using Stata 11’s “phtest” (Stata Corp., College Station, USA) command and examina-tion of the Schoenfeld residuals 17. We also tested alternative methods for handling tied events. Since the Breslow and Efron approaches yielded identical results, we used the Breslow method for final estimation since it made it more likely that models would converge. Model fit was ascer-tained by inspection of Cox-Snell residuals 17.
Results
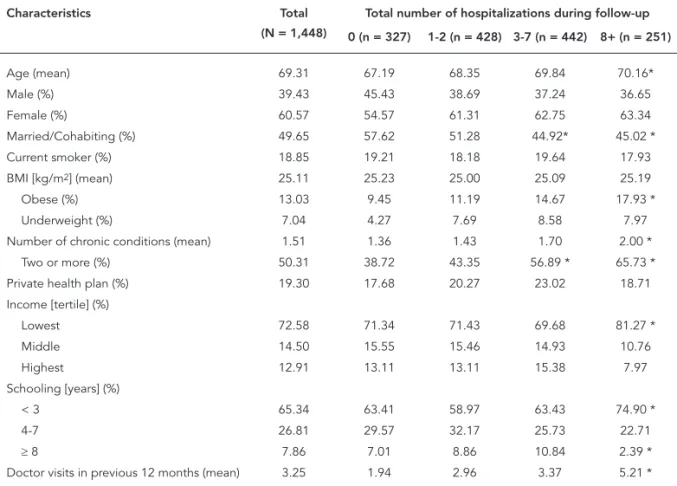
Table 1 presents descriptive data on respon-dents. The mean age was 69 years at baseline, 61% of respondents were female and about half were married or cohabiting. Nearly three quar-ters (73%) were in the lowest income category, and 65% had three years of schooling or less. The average BMI was 25, but 7% were underweight and 13% were obese. Almost three-quarters (73%) had at least one and 50% had at least two chronic conditions. 19% were current smokers. Participants had an average of three doctor visits during the previous 12 months at baseline. Over the 10-year follow-up period, there were a total of 28,664 hospitalizations, with an average rate of four hospitalizations per person. Over the 10-year follow-up, 512 subjects died and six percent were lost to follow-up.
Slightly more than a fifth (23%) experienced no hospitalizations during the 10 year
follow-up. About 30% had 1-2 events, 31% had between 3 and 7 events, and about 17% had 8 or more events during this time. Fewer individuals having over 3 events were in the youngest age (60-69) category as compared to those experiencing no events. Married or cohabiting individuals experi-enced fewer hospitalizations overall. Both obese and underweight individuals were more likely to be in the highest hospitalization categories, as were those with one or more chronic condition. Although the overall population was both low income and had low educational levels, higher income categories were associated with lower numbers of hospitalizations as was the highest educational level. In terms of doctor visits, those with no hospitalizations were most likely to have had fewer visits, while those using more hospital-izations were more likely to have had more doc-tor visits in the 12 months preceding baseline.
Table 2 presents the hurdle model of factors associated with hospital use over the 10-year follow-up period. In the first column, predictors of the dichotomous indicator of any hospital use suggest that individuals over 75 had almost twice the odds of hospitalization than those aged 60-64. Being married lowered the odds of hospitaliza-tion, while being underweight, having a chronic disease, and larger number of doctor visits in the baseline year all raised the likelihood of at least one hospitalization episode. When examin-ing predictors of the intensity of hospitalization (column 2), males had a 20% higher likelihood of multiple hospitalizations as did those aged 70 and over. Although schooling was not associated with the first hospitalization, it was negatively associated with the intensity of hospitalization among those who had at least one event. Obe-sity was not associated with the first hospitaliza-tion, but obese individuals were 15% more likely to be more frequent users of hospital care. Each additional chronic disease raised the likelihood of subsequent hospitalization by 17%. Previous doctor visits also raised the likelihood of more intense hospital use.
Table 3 presents multivariable failure time models predicting hospitalizations over time. The first four models are nested together to assess the effect of adding additional blocks of covariates to the baseline model (model 1) containing only sex and age groups. In the fully adjusted model (model 4), males have about a 40% higher haz-ard of hospitalization, once other covariates are included in the model. Older ages (as compared with the 60-64 year old group) raise the likelihood of hospital admission although the relationship in a stepwise fashion. Being married is associated with about a 17% lower likelihood of hospitaliza-tion. Higher income and more years of formal schooling lower hospitalization risk. Having pri-vate health insurance and being a current smok-er are not significant predictors of subsequent hospitalization. Being underweight raises hospi-talization risk by about 44%, each chronic disease raises the risk by about 27% and each quartile of previous doctor visits raises hospitalization risk by 24 percent.
Model 5 (Table 3) presents conditional risk models for repeated events that assume that in-dividuals are at risk of a subsequent event only
Table 1
Baseline characteristics of participants, by total number of incident hospitalizations. The Bambuí Cohort Study of Aging, 1997.
Characteristics Total
(N = 1,448)
Total number of hospitalizations during follow-up
0 (n = 327) 1-2 (n = 428) 3-7 (n = 442) 8+ (n = 251)
Age (mean) 69.31 67.19 68.35 69.84 70.16*
Male (%) 39.43 45.43 38.69 37.24 36.65
Female (%) 60.57 54.57 61.31 62.75 63.34
Married/Cohabiting (%) 49.65 57.62 51.28 44.92* 45.02 *
Current smoker (%) 18.85 19.21 18.18 19.64 17.93
BMI [kg/m2] (mean) 25.11 25.23 25.00 25.09 25.19
Obese (%) 13.03 9.45 11.19 14.67 17.93 *
Underweight (%) 7.04 4.27 7.69 8.58 7.97
Number of chronic conditions (mean) 1.51 1.36 1.43 1.70 2.00 *
Two or more (%) 50.31 38.72 43.35 56.89 * 65.73 *
Private health plan (%) 19.30 17.68 20.27 23.02 18.71 Income [tertile] (%)
Lowest 72.58 71.34 71.43 69.68 81.27 *
Middle 14.50 15.55 15.46 14.93 10.76
Highest 12.91 13.11 13.11 15.38 7.97
Schooling [years] (%)
< 3 65.34 63.41 58.97 63.43 74.90 *
4-7 26.81 29.57 32.17 25.73 22.71
≥ 8 7.86 7.01 8.86 10.84 2.39 *
Doctor visits in previous 12 months (mean) 3.25 1.94 2.96 3.37 5.21 *
BMI: body mass index.
* p < 0.05 difference from zero hospitalization category.
after the first one has already occurred and ex-plicitly models the gap between each hospital-ization episode. Males and higher age groups experienced shorter gaps between hospitaliza-tions, but having private health insurance and being a current smoker are associated with lon-ger gaps. Obesity, a greater number of chronic diseases, and more doctor visits in the baseline year were also associated with shorter gaps be-tween hospitalizations.
Discussion
Table 2
Predictors of any hospitalization and subsequent number of hospitalizations. The Bambuí Cohort Study of Aging, 1997-2007.
Baseline characteristics Hospitalization (yes or no) Number of hospitalizations
(given at least one)
OR (95%CI) PR (95%CI)
Male (vs. female) 1.06 (0.77; 1.47) 1.20 (1.06; 1.36) * Age [years]
65-69 (vs. 60-64) 1.03 (0.75; 1.41) 1.02 (0.90; 1.17) 70-74 (vs. 60-64) 1.42 (0.98; 2.06) 1.17 (1.02; 1.35) **
75-79 (vs. 60-64) 2.06 (1.26; 3.37) * 1.30 (1.10; 1.52) *
≥ 80 (vs. 60-64) 2.11 (1.21; 3.68) *** 1.20 (1.00; 1.43) **
Married/Cohabiting (vs. single, divorced, widowed) 0.75 (0.56; 1.00) ** 0.95 (0.85; 1.06) Private health plan (vs. none) 1.20 (0.83; 1.73) 1.04 (0.91; 1.18) Income in highest tertiles (vs. lowest tertile) 1.03 (0.74; 1.43) 0.89 (0.78; 1.01)
Schooling ≥ 4 years (vs. < 3 years) 1.08 (0.91; 1.29) 0.91 (0.85; 0.97) ** Current smoker (vs. no) 1.02 (0.72; 1.44) 0.94 (0.83; 1.07) BMI [kg/m2]
Obese (BMI ≥ 30) (vs. other BMI) 1.35 (0.87; 2.07) 1.15 (1.00; 1.32) ** Underweight (BMI ≤ 18.5) (vs. other BMI) 1.95 (1.08; 3.54) ** 1.03 (0.86; 1.23)
Chronic conditions (0-6 conditions) 1.25 (1.09; 1.44) * 1.17 (1.12; 1.23) * Doctor visits, last 12 months (in quartiles) 1.35 (1.23; 1.48) * (1.11; 1.19) *
95%CI: 95% confi dence interval; BMI: body mass index; OR: odds ratio; PR: prevalence ratio.
Note: the analysis was based on 1,448 individuals. Column one present results modeling the likelihood of any hospitalization versus none (logistic regression) and column 2 presents results of models predicting the number of subsequent
hospitalizations after the fi rst (zero-infl ated negative binomial regression). * p < 0.001;
** p < 0.05; *** p < 0.01.
Studies on factors associated with hospi-talizations in older adults in Brazil are few, and they were restricted to cross-sectional or ad-ministrative data. Two of these studies used data from the baseline of the Bambuí Cohort Study of Aging. The first study, using information ob-tained by interview, showed that indicators of need (health conditions, use of health services and use of medications) were associated with both self-reported hospital admission, and with multiple admissions in the preceding year. Be-ing male, livBe-ing alone, and the existence of fi-nancial constraints in obtaining medications were associated with multiple hospital admis-sions 8. Another study showed that the introduc-tion of biomedical factors did not modify the above mentioned associations 6. Another cross-sectional study identified prior hospitalization, recent doctor visits, the presence of chronic dis-ease (particularly diabetes and heart disdis-ease), sex, and age as associated with hospitalization among a private health maintenance organiza-tion in Brazil 10.
Figure 1
Kaplan-Meier estimates of time until hospitalization, by number of chronic conditions at baseline. The Bambuí Cohort Study of Aging, 1997-2007.
Figure 2
Kaplan-Meier estimates of time until hospitalization, by number of years of schooling. The Bambuí Cohort Study of Aging, 1997-2007.
Underweight emerged as an important pre-dictor of any hospitalization, as well as with the hazard of subsequent hospitalization, and may be an important marker of frailty and may be associated with injuries due to falls 19. In
Table 3
Ten-year hazard of hospitalization. The Bambuí Cohort Study of Aging, 1997-2007.
Model 1 * Model 2 * Model 3 * Model 4 * Model 5 **
HR (95%CI) HR (95%CI) HR (95%CI) HR (95%CI) HR (95%CI)
Male (vs. female) 0.94 (0.81; 1.09) 1.06 (0.90; 1.25) 1.22 (1.02; 1.46) *** 1.40 (1.17; 1.67) # 1.20 (1.13; 1.28) #
Age [years]
65-69 (vs. 60-64) 1.03 (0.84; 1.26) 1.00 (0.82; 1.22) 0.99 (0.81; 1.20) 1.01 (0.83; 1.22) 1.00 (0.94; 1.07) 70-74 (vs. 60-64) 1.35 (1.11; 1.65) # 1.28 (1.05; 1.56) *** 1.21 (1.00; 1.48) *** 1.21 (1.00; 1.47) *** 1.12 (1.04; 1.20) #
75-79 (vs. 60-64) 1.75 (1.41; 2.17) # 1.65 (1.32; 2.04) # 1.63 (1.31; 2.03) # 1.63 (1.32; 2.00) # 1.18 (1.09; 1.28) #
≥ 80 (vs. 60-64) 1.94 (1.52; 2.47) # 1.80 (1.42; 2.29) # 1.88 (1.49; 2.37) # 1.80 (1.43; 2.27) # 1.34 (1.23; 1.47) #
Married/Cohabiting (vs. single, divorced, widowed)
0.85 (0.73; 0.99) *** 0.83 (0.71; 0.97) *** 0.83 (0.71; 0.96) *** 0.98 (0.93; 1.04)
Private health insurance plan (vs. none) 1.04 (0.88; 1.22) 1.04 (0.88; 1.22) 0.96 (0.82; 1.14) 0.91 (0.85; 0.97) ##
Income in highest tertiles (vs. lowest tertile)
0.83 (0.70; 0.98) *** 0.84 (0.71; 0.99) *** 0.87 (0.74; 1.03) ## 0.95 (0.89; 1.01)
Schooling ≥ 4 years (vs. < 3 years) 0.86 (0.79; 0.94) ## 0.91 (0.84; 0.99) *** 0.91 (0.84; 0.99) *** 0.98 (0.94; 1.01)
Current smoker (vs. no) 1.00 (0.82; 1.22) 0.96 (0.79; 1.16) 0.93 (0.87; 0.99) *** BMI [kg/m2]
Obese (BMI ≥ 30) (vs. other BMI) 1.21 (0.99; 1.47) 1.17 (0.97; 1.42) 1.01 (0.95; 1.08)
Underweight (BMI ≤ 18.5) (vs. other BMI)
1.39 (1.08; 1.78) ## 1.44 (1.15; 1.81) # 1.17 (1.06; 1.28) #
Chronic conditions (0-6 conditions) 1.33 (1.24; 1.44) # 1.27 (1.18; 1.36) # 1.05 (1.03; 1.08) #
Doctor visits, last 12 months (in quartiles)
1.24 (1.19; 1.29) # 1.05; 1.08) #
95%CI: 95% confi dence interval; BMI: body mass index; HR: hazard ratios.
Note: the analysis was based on 1,448 individuals. All models are variations on Cox proportional hazards models. Models 1-4 are nested models, based on sequential additional of blocks of covariates as shown.
* Anderson-Gill repeated events model;
** Prentice, Williams, Peterson repeated events model for gap time (between events); *** p < 0.05;
# p < 0.001;
## p < 0.01.
Having had a higher number of doctor vis-its was consistently associated with hospitaliza-tion in all models. This is not surprising, since many individuals are likely to consult with their doctor before being referred to the hospital and those with more severe chronic conditions may be more likely to have had multiple doctor visits, a finding consistent with other studies 21.
Chronic conditions were important and con-sistent predictors of hospital use, the intensity of use, and shorter gaps between episodes, a find-ing consistent with other studies 22,23,24. This study also showed the importance of comorbid-ity: each additional chronic condition raised hos-pitalization risk by as much as 27 percent.
This study has some limitations. We rely on individual self-report of hospital use. While it is likely that people’s yearly recall about hospital-izations is fairly accurate, we were not able to
confirm hospitalizations, length of stay, or the reason for the hospitalization. It is also not possi-ble to determine how many were re-admissions for the same health problem. For some individu-als for some years, a proxy (usually a family mem-ber) reported the number of hospitalizations. To assess the level of bias, we dropped all proxy re-ports and re-ran the analyses. Results were gen-erally consistent with those obtained from the models reported here. We used only values from baseline and did not include time-varying fac-tors, such chronic disease incidence or changing age. Thus, our results are subject to the effects of regression to the mean, and these changes in exposure status over time were not captured. Both tend to underestimate the strength of the associations found.
follow-up period of ten years. Measurements included objective assessments of illness at baseline and benefited from ongoing yearly interviews with participants to gather information on hospital use. We used analytic methods to assess various aspects of hospitalizations, including predictors of any use and predictors of intensity of use, and we employed failure time models to measure an individual’s risk of hospitalization over time, while controlling for the fact that some subjects either died or dropped out during follow-up.
Conclusions
This study has quantified the volume of hospital use and identified a number of important pre-dictors of hospitalization among a population-based cohort of elderly Brazilians. Consistent
with other studies, we confirmed that risk factors such as age, the number of chronic illnesses, and previous doctor visits were important predictors of hospital use. The study also found that even very small differences in social factors, such as additional years of schooling, were important in lowering hospitalization risk among a popula-tion of very low socioeconomic status. Future studies should link users with their actual hos-pital records to assess the most common causes of hospitalization and permit the estimation of costs associated with hospital use based on different patient profiles and assess the impact of hospitalization on long-term morbidity and quality of life. Such information can then be used to help validate models used to project future needs for hospital, rehabilitation, and long-term care services appropriate for Brazil’s rapidly age-ing population.
Resumo
Foram utilizados dados de uma coorte brasileira de base populacional para examinar os fatores prognós-ticos para hospitalizações entre idosos ao longo de dez anos de seguimento. Os participantes foram 1.448 idosos com 60 ou mais anos de idade na linha de base (1997). O evento estudado foi a ocorrência de hospita-lizações informadas pelo participante. Um pouco mais de um quinto (22%) dos idosos não foi hospitalizado ao longo de dez anos de seguimento. Cerca de 30% ti-veram 1-2 internações, 31% titi-veram 3-7 internações e 18% tiveram 8 ou mais hospitalizações durante o perí-odo estudado. Resultados de regressões multivariáveis e modelos de Cox mostraram que o risco de hospitali-zações apresentou associação positiva com o sexo mas-culino, idade avançada, número de doenças crônicas e número de consultas médicas nos 12 meses preceden-tes. O baixo peso apresentou associação significante com a ocorrência de uma hospitalização, enquanto a obesidade não apresentou uma associação consistente com esse evento.
Idoso; Hospitalização; Estudos de Coortes
Contributors
J. Macinko conceived the study, analyzed data and wro-te the wro-text. V. Camargos contribuwro-ted to the study design, data analysis, article revisions, and approving the final draft. J. O. A. Firmo participated in the data collection and management and reviewing the text. M. F. Lima-Costa contributed to the analysis and interpretation of the data and writing the text.
Acknowledgments
References
1. La Forgia GM, Couttolenc BF. Hospital perfor-mance in Brazil: the search for excellence. Wash-ington DC: The World Bank; 2008.
2. La Forgia GM, Harding A. Public-private partner-ships and public hospital performance in São Pau-lo, Brazil. Health Aff (Millwood) 2009; 28:1114-26. 3. Macinko J, Oliveira VB, Turci MA, Guanais FC,
Bonolo PF, Lima-Costa MF. The influence of pri-mary care and hospital supply on ambulatory care sensitive hospitalizations among adults in Brazil, 1999-2007. Am J Public Health; in press.
4. Lima-Costa MF, Firmo JOA, Uchôa E. The Bambuí Health and Aging Study: methodology and health profile of participants at baseline. Cad Saúde Pública 2011; 27 Suppl 3:S327-35.
5. Lima-Costa MF, Firmo JOA, Uchôa E. Cohort pro-file: the Bambui (Brazil) Health and Aging Study. Int J Epidemiol; in press.
6. Guerra HL, Vidigall PG, Lima-Costa MF. Biomedi-cal factors associated with hospitalization of old-er adults: The Bambuí Health and Aging Study (BHAS). Cad Saúde Pública 2003; 19:829-38. 7. Plan and operation of the Third National Health
and Nutrition Examination Survey, 1988-94. Se-ries 1: programs and collection procedures. Vital Health Stat 1 1994; (32):1-407.
8. Guerra HL, Firmo JOA, Uchôa E, Lima-Costa MFF. The Bambuí Health and Aging Study (BHAS): fac-tors associated with hospitalization of the elderly. Cad Saúde Pública 2001; 17:1345-56.
9. Kennedy BS, Kasl SV, Vaccarino V. Repeated hos-pitalizations and self-rated health among the el-derly: a multivariate failure time analysis. Am J Epidemiol 2001; 153:232-41.
10. Estrella K, Oliveira CEF, Sant’anna AA, Caldas CP. Detecção do risco para internação hospitalar em população idosa: um estudo a partir da porta de entrada no sistema de saúde suplementar. Cad Saúde Pública 2009; 25:507-12.
11. Castro MSM, Carvalho MS, Travassos C. Factors associated with readmission to a general hospital in Brazil. Cad Saúde Pública 2005; 21:1186-200. 12. Gurmu S. Generalized hurdle count data
regres-sion models. Econ Lett 1998; 58:263-8.
13. Andersen PK, Gill RD. Cox regression model for counting processes: a large sample study. Ann Stat 1982; 10:1100-20.
14. Jahn-Eimermacher A. Comparison of the Anders-en-Gill model with Poisson and negative binomial regression on recurrent event data. Computational Statistics & Data Analysis 2008; 52:4989-97.
15. Castro MS, Travassos C, Carvalho MS. Efeito da oferta de serviços de saúde no uso de internações hospitalares no Brasil. Rev Saúde Pública 2005; 39:277-84.
16. Box-Steffensmeier JM, De Boef S, Joyce KA. Event dependence and heterogeneity in duration mod-els: the conditional frailty model. Political Analysis 2007; 15:237-56.
17. Cleves M, Gould W, Gutierrez RG, Marchenko Y. An introduction to survival analysis using Stata. 2nd Ed. College Station: Stata Press; 2008.
18. Louvison MC, Lebrão ML, Duarte YA, Santos JL, Malik AM, Almeida ES. Desigualdades no uso e acesso aos serviços de saúde entre idosos do mu-nicípio de São Paulo. Rev Saúde Pública 2008; 42:733-40.
19. Ringbäck Weitoft G, Eliasson M, Rosén M. Un-derweight, overweight and obesity as risk factors for mortality and hospitalization. Scand J Public Health 2008; 36:169-76.
20. Sichieri R, Nascimento S, Coutinho W. The burden of hospitalization due to overweight and obesity in Brazil. Cad Saúde Pública 2007; 23:1721-7. 21. Inouye SK, Zhang Y, Jones RN, Shi P, Cupples LA,
Calderon HN, et al. Risk factors for hospitalization among community-dwelling primary care older patients: development and validation of a predic-tive model. Med Care 2008; 46:726-31.
22. Guerra IC, Ramos-Cerqueira ATA. Risco de hos-pitalizações repetidas em idosos usuários de um centro de saúde escola. Cad Saúde Pública 2007; 23:585-92.
23. Lima-Costa MF, Barreto SM, Giatti L. Condições de saúde, capacidade funcional, uso de serviços de saúde e gastos com medicamentos da população idosa brasileira: um estudo descritivo baseado na Pesquisa Nacional por Amostra de Domicílios. Cad Saúde Pública 2003; 19:735-43.
24. Lima-Costa MF, Barreto SM, Firmo JOA, Uchôa E. Socioeconomic position and health in a popula-tion of Brazilian elderly: the Bambuí Health and Aging Study (BHAS). Rev Panam Salud Pública 2003; 13:387-94.
Submitted on 18/Aug/2010