ABSTRACT
ORIGINAL AR
of upper-body fat distribution
Department of Surgery, Faculdade de Medicina de Botucatu (FMB),
Universidade Estadual Paulista (Unesp), Botucatu, São Paulo, Brazil
CONTEXT AND OBJECTIVE: Pulmonary dysfunc-tion in obese individuals may be associated with respiratory muscle impairment, and may be infl uenced by predominance of upper-body fat distribution. The objective of this study was to evaluate the strength of respiratory muscles in obese individuals and to analyze the infl uence of adipose tissue distribution.
DESIGN AND SETTING: Cross-sectional study on the preoperative period prior to bariatric surgery. Research developed within the Post-graduate General Surgery Program, Faculdade de Medicina de Botucatu, Universidade Estadual Paulista (Unesp).
METHOD: Respiratory muscle strength was quantifi ed by measuring maximum inspiratory and expiratory pressures (PImax and PEmax) in obese candidates for bariatric surgery. Adipose tissue distribution was assessed using the waist-hip circumference ratio (WHR). PImax, PEmax and WHR were compared with normal reference values and also in groups with different body mass index (BMI).
RESULTS: We evaluated 23 men and 76 women. All underwent PImax evaluation and 86 under-went PEmax. The mean BMI was 44.42 kg/m2. PImax and PEmax were within normal values; WHR showed that there was predominance of upper-body fat distribution; and there were no correlations among the variables studied. There was no signifi cant variance among the variables PImax, PEmax and WHR when the study population was divided into groups with different BMI.
CONCLUSION: In the obese population studied, the excess weight did not result in impairment of respiratory muscle strength, and their pre-dominant upper-body fat distribution also did not infl uence respiratory muscle strength.
KEY WORDS: Obesity. Respiratory muscles. Body constitution. Waist-hip ratio. Surgery. INTRODUCTION
Obesity is a complex, multifactorial disease that develops from an interaction of genetic, metabolic, social, cultural and behavioral factors. The universally accepted means for classifying obesity is the body mass index (BMI), which describes the weight (kg) divided by the square of the height (m2).1
It has been estimated that the global epidemic of overweight and obesity affects 1.7 billion people.2 Brazil is one of the South
American countries with more complete national research on nutrition and health, and these studies began in the 1970s. The results from IBGE’s (Instituto Brasileiro de Geografi a e Estatística) Family Budget Survey (2002-2003), in partnership with the Brazilian Ministry of Health, showed that, out of a total of 95.5 million Brazilians aged 20 years or over, there were 3.8 million underweight individuals (4.0%) and 38.8 million overweight individuals (40.6%), of whom 10.5 million were consid-ered to be obese.3
Obesity still presents a high rate of unsuccessful treatment by means of medi-cations or diets, but generally responds to surgical treatment (bariatric surgery).4
This disease is associated with increased prevalence of comorbid conditions, such as diabetes mellitus, dyslipidemia, systemic ar-terial hypertension, obstructive sleep apnea and pulmonary dysfunction.5,6
Respiratory dysfunction in obese indi-viduals may occur because of alteration of the relationship between the lungs, chest wall and diaphragm, thereby causing respiratory mechanical damage and abnormalities in gas exchanges.7,8 Most pulmonary dysfunction
studies among obese individuals have shown the presence of restrictive patterns, with reduction of pulmonary volumes and capaci-ties, but with a normal Tiffeneau index.9
With regard to the effects of body-fat dis-tribution on cardiopulmonary function, most
studies have suggested that individuals with predominance of upper-body fat distribution may have greater impairment of pulmonary function (volume and capacity reductions) and greater rates of cardiopulmonary failure than those with predominance of lower-body fat distribution.10,11
Studies on the respiratory muscles of obese individuals are rare and have produced conflicting results. Previous studies have demonstrated that, among obese individuals, the respiratory system is subjected to mechani-cal overload and that, when faced with this, some individuals increase the activity of their respiratory muscles, although few studies have related body weight to maximum respiratory pressures.12 Some studies have affi rmed that
maximum respiratory pressures in obese indi-viduals are often normal,12 except when they
develop obesity-hypoventilation syndrome,13,14
which is commonly characterized by severe obesity. On the other hand, Wadström et al.15
reported that obese individuals have lower maximum respiratory pressures.
The respiratory muscles in obese indi-viduals have been characterized as ineffi cient, and their endurance has also been found to be lower.16 According to several authors, this
ineffi ciency results from reduced chest wall compliance, smaller pulmonary volumes, greater metabolic demand on the respiratory musculature and increased work required for breathing.17,18
In the same way as for other skeletal muscles of the body, the performance of the ventilatory muscles can be described in terms of strength and endurance, such that strength is analyzed through measurement of maximum static mouth pressures against a closed airway.19-21 However, studies on this
OBJECTIVE
Thus, the objective of the present study was to investigate the strength of the respira-tory muscles in obese individuals, through measurement of maximum inspiratory and expiratory pressures (PImax and PEmax) and to analyze whether the distribution of adipose tissue, as determined by measuring the waist-hip ratio, has any infl uence on respiratory muscle strength.
METHOD
Studied population
Studied population
This was a cross-sectional study on obese patients that was undertaken during the preoperative period before these pa-tients underwent bariatric surgery. These patients had been referred to Hospital das Clínicas, Faculdade de Medicina de Botuca-tu, Universidade Estadual Paulista (Unesp) and to the Regional University Hospital of Maringá, Paraná, between August 2003 and December 2004. The sample size (80 indi-viduals) was calculated by utilizing a 95% confi dence interval and taking a precision of 10%. The present research was approved by the Research Ethics Committees of the participating institutions.
Inclusion criteria
Inclusion criteria
Only individuals aged more than 20 years were included, since the reference val-ues utilized in the present study were those described by Neder et al.,22 in which the age
range of the population studied was from 20 to 80 years. All the patients included presented obesity with an indication for surgical treatment (BMI ≥ 40 kg/m2 or BMI
≥ 35 kg/m2 associated with comorbidities).
They had no personal antecedents of pulmo-nary or neuromuscular diseases, or
impair-ment of abdominal or diaphragmatic muscu-lature, and their cognition was suffi cient to ensure the effi cacy of the tests applied.
Parameters evaluated
Parameters evaluated
Respiratory muscle strength: Respiratory muscle strength: PImax and PEmax
PImax and PEmax
PImax and PEmax were measured using a digital mouth pressure meter (± 300 cm
H2O) (Micro RPM
,Micro Medical, United Kingdom). The manometer was calibra-ted every six months, in accordance with the manufacturer’s recommendations. A tube containing a unidirectional valve and a small air leak was coupled to a rigid mouthpiece. The purpose of this small air leak was to impede the generation of pressures by facial muscles and to prevent glottic closure. Dur-ing the test, the individual remained seated with the nasal airfl ow impeded by a nose clip. The measurement procedure and refer-ence normal maximum respiratory pressures (PImax and PEmax) were as described in the method used by Neder et al.22
Body mass index (BMI) Body mass index (BMI)
The BMI was obtained by collecting height and weight data from the individuals participating in the study. For weight measure-ments, a Filizola
digital balance of maximum capacity 300 kg was used. Height was obtained using a ruler that was coupled to the balance. The BMI was obtained by dividing the weight (kg) by the square of the height (m2).
Waist and hip circumference Waist and hip circumference ratio (WHR)
ratio (WHR)
The measurements of waist and hip cir-cumferences followed the norms established by the World Health Organization,23 which
specify that the location for measuring the waist should be the circumference line halfway between the lowest costal margin and the iliac crest and that the hip circumference should be
measured at the level of the greater femoral trochanter. It must be emphasized that the par-ticipants in the present study were positioned orthostatically, wearing only underclothes, and the measurements were made at the mo-ment of respiration at the functional residual capacity (FRC) level. The circumferences were measured using a tape of 300 cm in length, to the nearest 1 mm. The waist-to-hip ration (WHR) was obtained as the quotient between the waist and hip circumferences.
Statistical analysis
Statistical analysis
The attributes studied (PImax, PEmax and WHR) were compared with the normal reference values by means of Student’s t test. These attributes were also compared in groups with different BMI, using analysis of variance (ANOVA). To analyze correlations among the quantitative variables, the Pear-son correlation coeffi cient was used, with a 5% signifi cance level.
RESULTS
Population
Population
The present study evaluated 109 individu-als, of whom 10 were excluded because they did not fulfi ll the inclusion criteria, for the following reasons: age (1), sequelae of facial paralysis (1), chronic pulmonary disease (3), abdominal hernia (1) and failure to compre-hend the tests (4). Among the 99 participants in the study, 76 were female; the participants’ ages ranged from 20 to 64 years (mean ±
standard deviation, SD = 40.17 ± 10.07)
and the BMI ranged from 35 to 66.28 kg/m2
(mean ± standard deviation, SD = 44.42 ± 7.36). All the patients underwent PImax
evaluation, but only 86 underwent PEmax. Maximum respiratory pressures Maximum respiratory pressures
PImax and PEmax are presented in subgroups, according to age range and sex, for comparison with reference values (Tables 1 and 2). The comparison shows that obesity did not impair these variables in any age group.
Waist and hip circumference ratio Waist and hip circumference ratio
Analysis of the variable WHR showed that the individuals presented statistically signifi cant predominance of upper-body fat distribution, in comparison with the standard for normality established by Huang et al.24 (Table 3).
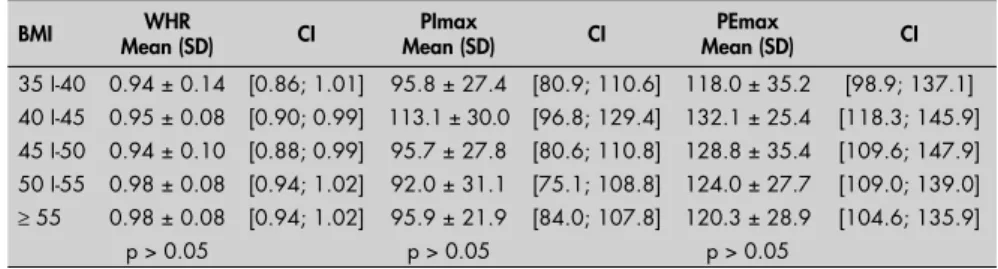
Study variable comparisons Study variable comparisons between different BMI groups between different BMI groups
There were no signifi cant differences in relation to the variables PImax, PEmax and WHR for any of the population studied,
Table 1. Means and standard deviations relating to maximum inspiratory pressure
(PImax) among 99 obese individuals according to age group, in relation to reference values, Student’s t test and confi dence interval
Age group (n) PImax
Mean (SD) Reference values* t p CI sex: female
20-29 (16) -103.60 ± 27.00 -101.6 ± 13.1 0.30 0.77 [-120.3; -86.8;]
30-39 (19) -93.89 ± 24.98 -91.5 ± 10.1 0.42 0.68 [-107.8; -79.9]
40-49 (26) -101.46 ± 25.73 -87.0 ± 9.1 2.87 0.005 [-113.5; -89.4]
50-59 (15) -79.93 ± 26.00 -79.3 ± 3.9 0.09 0.93 [-118.6;- 39.9]
sex: male
20-29 (3) -107.67 ± 31.77 -129.3 ± 17.6 - 1.18 0.24 [-153.7; -61.6;]
30-39 (7) -124.10 ± 34.46 -136.1 ± 22.0 - 0.92 0.36 [-155.8; -92.4]
40-49 (7) -113.28 ± 27.52 -115.8 ± 8.7 4.76 0.81 [-138.6; -87.9]
50-59 (6) -105.17 ± 36.67 -118.1 ± 17.6 1.35 0.18 [-141.6; -68.7]
when divided into groups with different BMI (Table 4).
Analysis of correlations between Analysis of correlations between WHR, PImax and PEmax
WHR, PImax and PEmax
There was no linear correlation in this study population between WHR and PImax or between WHR and PEmax (WHR versus PImax: r = 0.006; p = 0.95; WHR versus PEmax: r = 0.05; p = 0.62). The only linear correlation found was between PImax and PEmax (r = 0.67; p = 0.0001).
DISCUSSION
It could be seen that, in the study popu-lation, for all age groups and both sexes, the PImax and PEmax values were within normal patterns. This is in agreement with some reports12-14 and in disagreement with
others15,16,18 in which respiratory muscle
impairment among obese individuals was described. Sarikaya et al.25 reported that
obese individuals presented a reduction only in PImax.
Although some of these studies15,16
reported that respiratory muscle strength was reduced with obesity, it is important to consider that they were observing massively obese individuals who often also presented obesity-hypoventilation syndrome. This is important in relation to understanding the results obtained in the present study, since our study population consisted of obese sub-jects without any known underlying com-plication that could have had any impact on their lung function, and without extremely massive obesity (BMI > 55 kgm2).
Some studies have analyzed the effects of weight loss on the respiratory muscles. Weiner et al.26 reported that the PImax and PEmax
values before gastroplasty were slightly but signifi cantly lower than the predicted normal, while muscle endurance values were more markedly reduced. After the weight loss, there was a signifi cant increase and return to nor-mal reference values, with regard to both the strength and endurance of respiratory muscles, with the latter showing greater increases. These authors suggested that the improvement in respiratory muscle endurance was probably related to increased chest wall compliance and pulmonary volumes, as a consequence of weight reduction. Krotkiewski et al.27
demon-strated that weight reduction was associated with increased skeletal muscle endurance, which was probably associated with increased glycogen synthesis activity.
With regard to the WHR, the majority of studies show a greater tendency towards development of pulmonary dysfunction in
Table 2. Means and standard deviations relating referent to maximum expiratory
pressure (PEmax) among 86 obese individuals according to age group, in relation to reference values, Student’s t test and confi dence interval
Age group (n) PEmax
Mean (SD) Reference values* t p CI sex: female
20-29 (14) 116.50 ± 21.33 114.1 ± 14.8 0.42 0.67 [102.2; 130.8]
30-39 (19) 123.26 ± 26.82 110.6 ± 12.1 2.06 0.04 [108.3; 138.2]
40-49 (21) 118.14 ± 31.54 85.4 ± 13.6 4.76 0.0000 [101.5; 134.8]
50-59 (13) 118.50 ± 27.47 83.0 ± 6.2 4.48 0.0000 [98.2; 138.8]
sex: male
20-29 (3) 161.00 ± 46.89 147.3 ± 11.0 0.51 0.61 [93.1; 228.9]
30-39 (6) 143.17 ± 33.64 140.3 ± 21.7 0.21 0.84 [109.8; 176.6]
40-49 (5) 147.00 ± 48.26 126.3 ± 18.0 0.96 0.34 [74.8; 177.8]
50-59 (5) 135.40 ± 34.37 114.7 ± 6.9 1.35 0.18 [97.9; 172.8]
SD = standard deviation; *According to Neder et al.22; t = Student’s t test; p = signifi cance level; CI = 95% confi dence interval.
Table 3. Means and standard deviations relating to waist-hip ratio (WHR), according to
gender, in relation to reference values, Student’s t test and confi dence interval among 99 obese individuals
Gender (n) WHR
Mean (SD) Reference value* t p CI
Female (76) 0.93 ± 0.11 < 0.86 5.49 < 0.001 [0.90; 0.96]
Male (23) 1.02 ± 0.08 < 0.96 3.74 < 0.001 [0.98; 1.06]
SD = standard deviation; *According to Huang et al.24; t = Student’s t test; p = signifi cance level; CI = 95% confi dence interval.
Table 4. Means, standard deviations and confi dence intervals relating to waist-hip
ratio (WHR), maximum inspiratory pressure (PImax) and maximum expiratory pressure (PEmax), according to body mass index (BMI) among 99 obese individuals
BMI Mean (SD)WHR CI Mean (SD)PImax CI Mean (SD)PEmax CI
35 I-40 0.94 ± 0.14 [0.86; 1.01] 95.8 ± 27.4 [80.9; 110.6] 118.0 ± 35.2 [98.9; 137.1] 40 I-45 0.95 ± 0.08 [0.90; 0.99] 113.1 ± 30.0 [96.8; 129.4] 132.1 ± 25.4 [118.3; 145.9] 45 I-50 0.94 ± 0.10 [0.88; 0.99] 95.7 ± 27.8 [80.6; 110.8] 128.8 ± 35.4 [109.6; 147.9] 50 I-55 0.98 ± 0.08 [0.94; 1.02] 92.0 ± 31.1 [75.1; 108.8] 124.0 ± 27.7 [109.0; 139.0]
≥ 55 0.98 ± 0.08 [0.94; 1.02] 95.9 ± 21.9 [84.0; 107.8] 120.3 ± 28.9 [104.6; 135.9]
p > 0.05 p > 0.05 p > 0.05
SD = standard deviation; CI = 95% confi dence interval. obese individuals with adipose tissue distribu-tion predominantly in the abdominal and/or thoracic region. The present study showed that upper-body fat distribution was predominant, but without impairment of respiratory muscle strength. Domingos-Benício et al.12 and
Sari-kaya et al.25 also did not report a correlation
between maximum respiratory pressures and either WHR or even BMI.
Previous studies have examined the linear association between PImax and body com-position in adults, but with variable results. Vincken et al.20 found that height, weight
and percentage of ideal body weight did not contribute towards explaining PImax vari-ability, Enright et al.28 reported that weight
and waist circumference were negatively related to PImax. Carpenter et al.29 found a
lower mean PImax in individuals with higher WHR and BMI.
1. World Health Organization (WHO). Obsesity. Preventing and managing the global epidemic. Report of a WHO. Consultation on Obesity. Geneva, 3-5 June 1997. Available from: http://whqlibdoc. who.int/hq/1998/WHO_NUT_NCD_98.1_(p1-158).pdf. Ac-cessed in 2007 (May 28).
2. Deitel M. Overweight and obesity worldwide now estimated to involve 1.7 billion people. Obes Surg. 2003;13(3):329-30. 3. Brasil. Ministério do Planejamento, Orçamento e Gestão. Instituto
Brasileiro de Geografi a e Estatística. Pesquisa de orçamentos famil-iares — POF 2002-2003. Análise da disponibilidade domiciliar de alimentos e do estado nutricional no Brasil. Available from: http://www.ibge.gov.br/home/estatistica/populacao/condi-caodevida/pof/2002analise/. Accessed in 2007 (May 28). 4. Puglia CR. Indicações para o tratamento operatório da obesidade
mórbida. Rev Assoc Med Bras. 2004;50(2):118. Available from: http://www.scielo.br/scielo.php?script=sci_arttext&pid=S0104-42302004000200015. Accessed in 2007 (May 25).
5. Buchwald H, Avidor Y, Braunwald E, et al. Bariatric surgery: a sys-tematic review and meta-analysis. JAMA. 2004;292(14):1724-37. 6. Kac G, Velásquez-Meléndez G. A transição nutricional e a
epidemiologia da obesidade na América Latina. [The nutritional transition and the epidemiology of obesity in Latin América]. Cad Saúde Pública = Rep Public Health. 2003;19(suppl 1):S4-S5. 7. Ray CS, Sue DY, Bray G, Hansen JE, Wasserman K. Effects of obesity
on respiratory function. Am Rev Respir Dis. 1983;128(3):501-6. 8. Zerah F, Harf A, Perlemuter L, Lorino H, Lorino AM,
Atlan G. Effects of obesity on respiratory resistance. Chest. 1993;103(5):1470-6.
9. Sociedade Brasileira de Pneumologia e Tisiologia. Diretrizes para testes de função pulmonar. J Pneumol. 2002;28(Suppl 3):S1-S238. 10. De Lorenzo A, Maiolo C, Mohamed EI, Andreoli A,
Petrone-De Luca P, Rossi P. Body composition analysis and changes in airways function in obese adults after hypocaloric diet. Chest. 2001;119(5):1409-15.
11. Collins LC, Hoberty PD, Walker JF, et al. The effect of body fat distribution on pulmonary function tests. Chest. 1995;107(5):1298-302.
12. Domingos-Benício NC, Gastaldi AC, Perecin JC, et al. Medi-das espirométricas em pessoas eutrófi cas e obesas nas posições ortostática, sentada e deitada. [Spirometric values of obese and non-obese subjects in orthostatic, sitting and supine positions]. Rev Assoc Med Bras (1992). 2004;50(2):142-7.
13. Sampson MG, Grassino AE. Load compensation in obese patients during quiet tidal breathing. J Appl Physiol. 1983;55(4):1269-76.
14. Kelly TM, Jensen RL, Elliott CG, Crapo RO. Maximum respiratory pressures in morbidly obese subjects. Respiration. 1988;54(2):73-7.
15. Wadstrom C, Muller-Suur R, Backman L. Infl uence of excessive weight loss on respiratory function. A study of obese patients following gastroplasty. Eur J Surg. 1991;157(5):341-6.
REFERENCES
phosphates, glycogen and enzymes related to anaerobic metabolism and greater exertion potential. Type IIa fi bers are considered to be intermediate, because their capacity for fast twitching is combined with a moderately well developed capacity for transference of both aerobic and anaerobic energy. Type IIb fi bers possess greater anaerobic and exertion potential and constitute the “true” fast glyco-lytic fi bers.30
Some studies31,32 have reported greater
quantities of type II muscle fi bers and smaller quantities of type I fi bers in obese individu-als. This may represent an adaptation of the skeletal muscle in response to the chronic overload imposed by obesity and/or the metabolic alterations (resistance to insulin and altered metabolism of fatty acids) imposed by excess weight. Thus, if type II skeletal-muscle fi bers are predominant, and particularly those in subgroup IIb, the exertion potential of the respiratory muscles of obese individuals can be maintained within normal levels, without changes in PImax and PEmax, since these fi bers have greater potential for generating muscle strength.
Studies of human skeletal muscle im-pairment in obese individuals usually fi nd associations with insulin resistance, metabolic syndrome and/or type II diabetes mellitus. Excess of body fat, particularly in the ab-dominal compartment, is directly related to changes in the lipid profi le, systemic arterial hypertension and dyslipidemia, and these are considered to be risk factors for developing chronic diseases such as type II diabetes mel-litus and cardiovascular diseases. High levels of leptin and uric acid, and also alterations in fi brinolytic factors, have been observed
in obese individuals. The combination of these alterations has been named metabolic syndrome or insulin resistance syndrome, since hyperinsulinemia has an important role in the development of other components of metabolic syndrome.33 According to Hittel et
al.,34 obesity-related diseases such as metabolic
syndrome and type II diabetes originate par-tially from progressive metabolic deterioration of the skeletal muscles.
Some studies35-37 have reported that
the skeletal muscles in obese individuals show markedly lower oxidative capacity and numbers of mitochondria, and also increased intracellular lipid concentration and a ten-dency towards insulin resistance. One of the explanations for the presence of adaptations in the skeletal muscle fi bers of obese individu-als is impairment of the oxidative capacity of fatty acids, which forces the skeletal muscles to obtain ATP predominantly through anaerobic metabolism of slow muscle fi bers (type II).35 Skeletal muscle biopsies from
obese individuals have been shown to present greater activity of enzyme markers from anaerobic metabolism and lower activity of enzyme markers from aerobic metabolism.35
When obese individuals lose weight, the impairment of aerobic metabolism disap-pears.38 Through this, the probable muscle
adaptations are reinforced, thereby making it possible for obese individuals to maintain their exertion capacity in their skeletal mus-cles, which may explain the results from the present study.
Another hypothesis that may explain the normal PEmax observed in the obese patients who took part in the present study is that obese individuals’ muscles have specifi c histological
and metabolic characteristics, such that these individuals generally have more muscle mass and greater contraction strength than do non-obese individuals, as suggested by some physiological studies.39 However, it is not
known whether muscle quality (defi ned as the ratio between muscle strength and mus-cle mass) is less in obese than in non-obese individuals. These specifi c characteristics of obese individuals’ muscles may also contrib-ute towards understanding the results from the present study, since their greater fat-free muscle mass may compensate for the increased work of breathing imposed by obesity, without impairing muscle strength. Some studies have shown precisely that overweight individuals have higher peripheral muscle strength than do lean individuals,39-41 and this is probably
associated with greater fat-free mass.41
With regard to the clinical application of the results obtained from the present study, it can be noted that, although obesity imposes a respiratory mechanical disadvantage, not all obese individuals present impaired respiratory muscle strength. This possibly shows that some physiological adjustments to muscle fi bers or lean mass gain could partially compensate for such overload. Moreover, measurement of maximum inspiratory and expiratory pres-sures would help in identifying which obese individuals have respiratory impairment.
CONCLUSIONS
AUTHOR INFORMATION
Karla Luciana Magnani. Physiotherapist. Postgraduate
student in the Postgraduate General Surgery Program, Universidade Estadual Paulista (Unesp), Botucatu, São Paulo, Brazil.
Antônio José Maria Cataneo, MD, PhD.Adjunct full professor
in the Thoracic Surgery Division, Department of Surgery. Coordinator of the Postgraduate General Surgery Program, Universidade Estadual Paulista (Unesp), Botucatu, São Paulo, Brazil.
Address for correspondence: Antônio José Maria Cataneo
Disciplina de Cirurgia Torácica, Departamento de Cirurgia e Ortopedia
Faculdade de Medicina de Botucatu, Universidade Estadual Paulista (Unesp)
Botucatu (SP) — Brasil — CEP 18618-970 Tel. (+55 14) 3811-6091
Fax. (+55 14) 3815-7615 E-mail: [email protected]
Copyright © 2007, Associação Paulista de Medicina
RESUMO Força dos músculos respiratórios em obesos e infl uência da distribuição do tecido adiposo
CONTEXTO E OBJETIVO:A disfunção pulmonar no obeso pode estar associada a comprometimento mus-cular respiratório e também pode ser infl uenciada pelo predomínio de distribuição de gordura corporal na região toraco-abdominal. O objetivo foi avaliar a força dos músculos respiratórios em obesos e analisar a infl uência da distribuição do tecido adiposo.
TIPO DE ESTUDO E LOCAL: Estudo transversal no período pré-operatório de Cirurgia Bariátrica. Estudo desenvolvido no Programa de Pós-Graduação em Bases Gerais da Cirurgia da Universidade Estadual Paulista (Unesp) — Faculdade de Medicina de Botucatu.
MÉTODO: Mensuração da força dos músculos respiratórios através das medidas das pressões inspiratórias e expiratórias máximas (PImax e PEmax) em obesos candidatos à cirurgia bariátrica. Avaliar a distribuição do tecido adiposo através da relação entre as circunferências da cintura e quadril (RC/Q). Comparar esses atributos com os valores de referência de normalidade e também entre grupos com diferentes índices de massa corpórea (IMC).
RESULTADOS: Foram avaliados 23 homens e 76 mulheres. Todos foram submetidos à avaliação de PImax e 86 realizaram a PEmax. O IMC médio foi de 44,42 kg/m2. Os valores de PImax e de PEmax estavam dentro dos padrões de normalidade, a relação cintura-quadril mostrou distribuição do tecido adiposo na porção superior corporal e não houve correlação entre as variáveis estudadas.
CONCLUSÃO: Na população de obesos estudada, o excesso de peso não provocou alterações na força dos músculos respiratórios, e as modifi cações não foram infl uenciadas pela distribuição de gordura pre-dominante em porção superior corporal.
PALAVRAS-CHAVE:Obesidade. Músculos respiratórios. Constituição corporal. Relação cintura-quadril. Cirurgia.
16. Sahebjami H, Gartside PS. Pulmonary function in obese subjects with a normal FEV1/FVC ratio. Chest. 1996;110(6):1425-9. 17. Poole DC, Sexton WL, Farkas GA, et al. Diaphragm structure
and function in health and disease. Med Sci Sports Exerc. 1997;29(6):738-54.
18. Mancini MC, Carra MK. Difi culdade diagnóstica em pacientes obesos – parte 1. Associação Brasileira para o Estudo da Obesi-dade e da Síndrome Metabólica. Revista Abeso. 2001;3(II). Available from: http://www.abeso.org.br/revista/revista3/ dif_parte1.htm. Accessed in 2007 (May 28).
19. Rochester DF. Tests of respiratory muscle function. Clin Chest Med. 1988;9(2):249-61.
20. Vincken W, Ghezzo H, Cosio MG. Maximal static respiratory pressures in adults: normal values and their relationship to determinants of respiratory function. Bull Eur Physiopathol Respir. 1987;23(5):435-9.
21. Wohlgemuth M, van der Kooi EL, Hendriks JC, Padberg GW, Folgering HTet al. Face mask spirometry and respiratory pres-sures in normal subjects. Eur Respir J. 2003;22(6):1001-6. 22. Neder JA, Andreoni S, Lerario MC, Nery LE. Reference values
for lung function tests. II. Maximal respiratory pressures and voluntary ventilation. Braz J Med Biol Res. 1999;32(6):719-27. 23. World Health Organization (WHO). The World Health Report, 2002. Reducing risks, promoting healthy life. Available from: http://www.who.int/whr/2002/en/whr02_en.pdf. Accessed in 2007 (May 28).
24. Huang KC, Lin WY, Lee LT, et al. Four anthropometric indices and cardiovascular risk factors in Taiwan. Int J Obes Relat Metab Disord. 2002;26(8):1060-8.
25. Sarikaya S, Cimen OB, Gokcay Y, Erden R. Pulmonary function tests, respiratory muscle strength, and endurance of persons with obesity. Endocrinologist. 2003;13(2):136-41. Available from: http://www.theendocrinologist.org/pt/re/endocrinologist/ab-stract.00019616-200303000-00012.htm;jsessionid=GRZNhVB dFTJYQCS4JdQn3y2lzynnt6YQPNcRpT1bQXvqRP62zd2Z!-650888129!-949856144!8091!-1. Accessed in 2007 (May 28).
26. Weiner P, Waizman J, Weiner M, Rabnet M, Magadle R, Zamir D. Infl uence of excessive weight loss after gastroplasty for morbid obesity on respiratory muscle performance. Thorax. 1998;53(1):39-42.
27. Krotkiewski M, Grimby G, Holm G, Szczepanik J. Increased muscle dynamic endurance associated with weight reduction on a very-low-calorie diet. Am J Clin Nutr. 1990;51(3):321-30. 28. Enright S, Chatham K, Ionescu AA, Unnithan VB, Shale DJ.
Inspira-tory muscle training improves lung function and exercise capacity in adults with cystic fi brosis. Chest. 2004;126(2):405-11. 29. Carpenter MA, Tockman MS, Hutchinson RG, Davis
CE, Heiss G. Demographic and anthropometric correlates of maximum inspiratory pressure: The Atherosclerosis Risk in Communities Study. Am J Respir Crit Care Med. 1999;159(2):415-22.
30. McArdle WD. Fisiologia do exercício. In: McArdle WD, Katch FI, Katch VL, editors. Fisiologia do exercício: energia, nutrição e desempenho. 4rd ed. Rio de Janeiro: Guanabara-Koogan; 1996. p.
75-8.
31. Tanner CJ, Barakat HA, Dohm GL, et al. Muscle fi ber type is associated with obesity and weight loss. Am J Physiol Endocrinol Metab. 2002;282(6):E1191-6.
32. Hickey MS, Carey JO, Azevedo JL, et al. Skeletal muscle fi ber composition is related to adiposity and in vitro glucose transport rate in humans.Am J Physiol. 1995;268(3 Pt 1):E453-7. 33. Oliveira CL, Mello MT, Cintra IP, Fisberg M. Obesidade e
síndrome metabólica na infância e adolescência. [Obesity and metabolic syndrome in infancy and adolescence]. Rev Nutr. 2004;17(2):237-45.
34. Hittel DS, Hathout Y, Hoffman EP, Houmard JA. Proteome analysis of skeletal muscle from obese and morbidly obese women.Diabetes. 2005;54(5):1283-8.
35. Simoneau JA, Veerkamp JH, Turcotte LP, Kelley DE. Markers of capacity to utilize fatty acids in human skeletal muscle: rela-tion to insulin resistance and obesity and effects of weight loss. FASEB J. 1999;13(14):2051-60.
36. Felber JP, Ferrannini E, Golay A, Meyer H, et al. Role of lipid oxidation in pathogenesis of insulin resistance of obesity and type II diabetes. Diabetes. 1987;36(11):1341-50. 37. Kelley DE, Reilly JP, Veneman T, Mandarino LJ. Effects of
insu-lin on skeletal muscle glucose storage, oxidation, and glycolysis in humans. Am J Physiol. 1990;258(6 Pt 1):E923-9. 38. Newcomer BR, Larson-Meyer DE, Hunter GR, Weinsier
RL. Skeletal muscle metabolism in overweight and post-overweight women: an isometric exercise study using (31)P magnetic resonance spectroscopy. Int J Obes Relat Metab Disord. 2001;25(9):1309-15.
39. Rolland Y, Lauwers-Cances V, Pahor M, Fillaux J, Grandjean H, Vellas B. Muscle strength in obese elderly women: effect of recreational physical activity in a cross-sectional study. Am J Clin Nutr. 2004;79(4):552-7.
40. Hulens M, Vansant G, Lysens R, Claessens AL, Muls E, Bru-magne S. Study of differences in peripheral muscle strength of lean versus obese women: an allometric approach. Int J Obes Relat Metab Disord. 2001;25(5):676-81.
41. Lafortuna CL, Maffi uletti NA, Agosti F, Sartorio A. Gender vari-ations of body composition, muscle strength and power output in morbid obesity. Int J Obes (Lond). 2005;29(7):833-41.
Sources of funding:Not declared
Confl icts of interest: None
Date of fi rst submission:February 22, 2006
Last received:June 12, 2007