Relationships between fetal body weight
of Wistar rats at term and the extent of
skeletal ossification
Institute of Clinical Pharmacology and Toxicology, Department of Toxicology, Charité University Medical School, Campus Benjamin Franklin, Berlin, Germany I. Chahoud and
F.J.R. Paumgartten
Abstract
We investigated the relationship between fetal body weight at term (pregnancy day 21) and the extent of ossification of sternum, metacar-pus, metatarsus, phalanges (proximal, medial and distal) of fore- and hindlimbs and cervical and coccygeal vertebrae in Wistar rats. The relationships between fetal body weight and sex, intrauterine position, uterine horn, horn size, and litter size were determined using historical control data (7594 fetuses; 769 litters) of untreated rats. Relationships between body weight and degree of ossification were examined in a subset of 1484 historical control fetuses (154 litters) which were subsequently cleared and stained with alizarin red S. Fetal weight was independent of horn size, uterine horn side (left or right) or intrauter-ine position. Males were heavier than females and fetal weight de-creased with increasing litter size. Evaluation of the skeleton showed that ossification of sternum, metacarpus and metatarsus was exten-sively complete and independent of fetal weight on pregnancy day 21. In contrast, the extent of ossification of fore- and hindlimb phalanges and of cervical and sacrococcygeal vertebrae was dependent on fetal body weight. The strongest correlation between body weight and degree of ossification was found for hindlimb, medial and proximal phalanges. Our data therefore suggest that, in full-term rat fetuses (day 21), reduced ossification of sternum, metacarpus and metatarsus results from a localized impairment of bone calcification (i.e., a malformation or variation) rather than from general growth retarda-tion and that ossificaretarda-tion of hindlimb (medial and proximal) phalanges is a good indicator of treatment-induced fetal growth retardation. Correspondence
I. Chahoud Garystraße, 5 14195 Berlin Germany
Fax: +49-30-8445-1761
E-mail: [email protected]
F.J.R. Paumgartten is the recipient of a CNPq research fellowship and his present address is Laboratório de Toxicologia Ambiental, Departamento de Ciências Biológicas, Escola Nacional de Saúde Pública, Fundação Oswaldo Cruz, Rio de Janeiro, RJ, Brasil.
Received June 18, 2004 Accepted January 20, 2005
Key words
•Ossification centers •Fetal skeleton •Delayed fetal growth •Prenatal growth retardation •Malformation
•Embryotoxicity
Introduction
In developmental toxicity studies, a re-duction of average fetal body weight at term is usually considered to result from a sub-stance-induced prenatal growth retardation. Spongy and incompletely or poorly ossified bones as well as unossified ossification
pro-cess had occurred. By definition, prenatal growth retardation means that the affected fetus developed slower than normal fetuses, so that at the end of pregnancy it was in a relatively earlier stage of development. Al-though fetal body weight increases progres-sively with gestational age, it also depends on other variables, such as genetic back-ground and environmental factors. A smaller and lighter fetus, therefore, does not neces-sarily mean that its growth was retarded, or that it is less mature than expected for the gestational age. The same holds true for a reduced degree of ossification of some fetal skeleton bones. Although bone ossification advances with gestational age, a substance-induced impairment of calcification of a par-ticular bone is not necessarily secondary to a slower development of the skeleton as a whole.
Aliverti et al. (1) studied the develop-ment of rat skeleton from pregnancy day 19 to 21 by counting the number of ossification centers in sternum, cervical and caudal ver-tebrae, metacarpus, metatarsus, and foand hindpaw proximal phalanges. Their re-sults clearly showed that, in each of the areas evaluated, the number of ossification cen-ters increased as gestation age increased from 19 to 21 days. Based on their findings, Aliverti et al. (1) suggested that the number of ossifi-cation centers in these areas would provide a reliable quantitative index for evaluating fe-tal growth retardation on pregnancy day 21. These authors, however, did not investigate the relationship between degree of skeleton ossification and fetal body weight.
Ariyuki et al. (2), on the other hand, examined the relationship between body weight and ossification of coccygeal verte-brae in full-term mouse and rat fetuses. In both species, a positive correlation was found between fetal body weight and number of sacrococcygeal ossified vertebrae. In a sub-sequent study, Ariyuki et al. (3) evaluated the relationship between body weight and degree of ossification of sternum,
sacrococ-cygeal vertebrae, forepaw proximal phalan-ges, and supraoccipital bone in rat fetuses removed by cesarean section on days 19, 20 and 21 of pregnancy. Although Ariyuki et al. (3) provided very interesting data demon-strating a parallel increase in body weight and extent of ossification of some skeleton areas between pregnancy days 19 and 21, they did not attempt to correlate body weight with degree of ossification in full-term rat fetuses. It is of note that a growth-retarded fetus at term is expected to present both a size (body weight) reduction as well as a decrease of ossification of certain skeleton areas.
In the present study, we examined the relationships between body weight and ex-tent of skeleton ossification in rat fetuses removed by cesarean section on pregnancy day 21. Dependency of fetal weight on other variables such as gender, litter size, uterine horn size, and relative position within the uterine horns was also evaluated.
Material and Methods
The relationship between rat fetal body weight and other parameters evaluated after cesarean section (sex, litter size, incidence of resorptions, intrauterine position, uterine horn side, horn size) was analyzed using our historical control records of 7594 fetuses from 769 litters. The relationship between body weight and degree of ossification was examined in a subset of 1484 historical con-trol fetuses (154 litters) which were subse-quently cleared and stained with alizarin red S for skeleton evaluation. All historical con-trol data were from untreated (Bor: Wistar spf; TNO) female rats, weighing approxi-mately 200 g, supplied by Fa. Winckelmann, Borchen, Germany. Upon arrival at the Insti-tute of Clinical Pharmacology and Toxicol-ogy (FU, Berlin) rats were housed in stan-dard plastic cages (Makrolon®) and kept in
1ºC), relative humidity (50 ± 5%) and a 12-h lig12-ht/dark cycle (lig12-hts on at 9:00 am in summer and at 10:00 am in winter). The animals received a standard diet for labora-tory rodents (Altromin® 1324, Lage,
Ger-many) and tap water ad libitum.
Mating procedure
Mating was accomplished by placing three females in the cage of one male for 3 h at the end of the dark period (6:00 to 9:00 h). The first 24 h after spermatozoa were found in the vaginal smears were considered as pregnancy day 0 (4).
Cesarean section
On pregnancy day 21 dams were killed by decapitation and gravid uteri were re-moved with their contents and weighed. Im-plantation sites were determined by the method of Salewski (5).The number of liv-ing and dead fetuses and resorptions, as well as their intrauterine positions were recorded. Living fetuses were individually weighed, sexed, numbered with a marker pen, exam-ined for external malformations under a ste-reomicroscope, and fixed in 5% (w/v) for-malin. Fetal sex was further confirmed by looking for testes or ovaries during micro-dissection or evisceration. For skeletal evalu-ation some litters were further cleared and stained with alizarin red S by the method of Dawson (6).
Statistical analysis
Data were analyzed statistically using a SAS software (7). The statistical significance of relationships between fetal body weight and number of ossification centers in the examined skeleton areas (sternum, metacar-pus, proximal, medial and distal phalanges of fore- and hindlimbs, as well as cervical and coccygeal vertebrae) was tested by mul-tifactorial analysis of variance and by the
Student t-test. Regression models were
em-ployed to test relationships between body weight and number of ossification centers in phalanges of fore- and hindlimbs, and in cervical and coccygeal vertebrae. A qua-dratic regression model was applied to test the relationships between body weight and degree of ossification of proximal and me-dial phalanges of fore- and hindlimbs, while a linear regression model was used for the remaining areas. Differences were consid-ered to be statistically significant when P < 0.05.
Results
Fetal body weight, resorption incidence and litter size
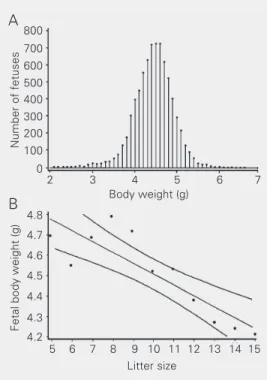
As shown in Figure 1A and Table 1, body weights of 7594 full-term live fetuses of our historical control records fit a normal distri-bution with a mean of 4.5 g and a standard deviation of 0.5 g. These fetuses were from 769 litters ranging in size from one to 16 fetuses, with a mean litter size (± SD) of 9.9
Number of fetuses
800
700
600
500 400
300
200
100
0
2 3 4 5 6 7
Body weight (g)
5 6 7 8 9 10 11 12 13 14 15
Litter size
Fetal body weight (g)
4.8
4.7
4.6
4.5
4.4
4.3
4.2
A
B
(%) according to litter size (taking into ac-count only live fetuses) and the number of resorptions, and shows that 468 (60.8%) of the examined uteri with at least one live fetus did not exhibit any resorption. Linear regres-sion analysis of data from litters without resorptions, and with 5 to 15 fetuses, indi-cated that fetal body weight correlated in-versely (r = -0.99) with litter size (Figure 1B).
Fetal body weight, sex, intrauterine position and horn side and size
The number of male fetuses was slightly higher than that of females, and males were also heavier than females (Table 1) and these sex-related differences were consistently noted when each horn side was analyzed separately or both were analyzed together, and horn side location had no influence on fetal body weight (Table 1). When litter size was controlled, horn size (data not shown) and relative position of the fetus within each uterine horn had no apparent effect on body weight at term as well (Table 3).
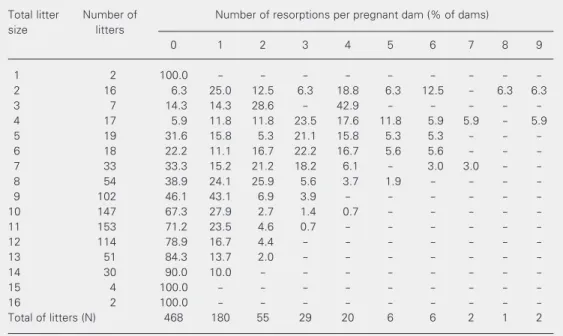
± 2.6 fetuses. The overall incidence of resorptions (mean ± SD) in the 769 litters evaluated in this study was 0.73 ± 1.28. Table 2 presents data on litter distribution
Table 2. Relationship between the number of fetuses (total litter size) and fetal resorptions per dam.
Total litter Number of Number of resorptions per pregnant dam (% of dams)
size litters
0 1 2 3 4 5 6 7 8 9
1 2 100.0 - - -
-2 16 6.3 25.0 12.5 6.3 18.8 6.3 12.5 - 6.3 6.3
3 7 14.3 14.3 28.6 - 42.9 - - - -
-4 17 5.9 11.8 11.8 23.5 17.6 11.8 5.9 5.9 - 5.9
5 19 31.6 15.8 5.3 21.1 15.8 5.3 5.3 - -
-6 18 22.2 11.1 16.7 22.2 16.7 5.6 5.6 - -
-7 33 33.3 15.2 21.2 18.2 6.1 - 3.0 3.0 -
-8 54 38.9 24.1 25.9 5.6 3.7 1.9 - - -
-9 102 46.1 43.1 6.9 3.9 - - -
-10 147 67.3 27.9 2.7 1.4 0.7 - - - -
-11 153 71.2 23.5 4.6 0.7 - - -
-12 114 78.9 16.7 4.4 - - -
-13 51 84.3 13.7 2.0 - - -
-14 30 90.0 10.0 - - -
-15 4 100.0 - - -
-16 2 100.0 - - -
-Total of litters (N) 468 180 55 29 20 6 6 2 1 2
Data are reported as the percentage of dams with litters of a given size that also exhibited 0 to 9 resorptions. A total of 468 (60.8%) of the examined uteri with at least one live fetus did not exhibit any resorption. Table 1. Sex, number and body weight of rat
fetuses located in the right and left uterine horns.
Uterine horn N % Fetal body weight (g) (mean ± SD)
Both horns
M + F 7594 100.0 4.5 ± 0.5
M 3816 50.3 4.6 ± 0.5
F 3775 49.7 4.4 ± 0.4*
Right horn
M + F 3792 49.9 4.5 ± 0.5
M 1906 25.1 4.6 ± 0.5
F 1884 24.8 4.4 ± 0.5*
Left horn
M + F 3802 50.1 4.5 ± 0.5
M 1910 25.2 4.6 ± 0.5
F 1891 24.9 4.4 ± 0.4*
All fetuses were from untreated Wistar rats and were obtained by cesarean section on pregnancy day 21. M = male; F = female.
Fetal body weight and extent of skeleton ossification
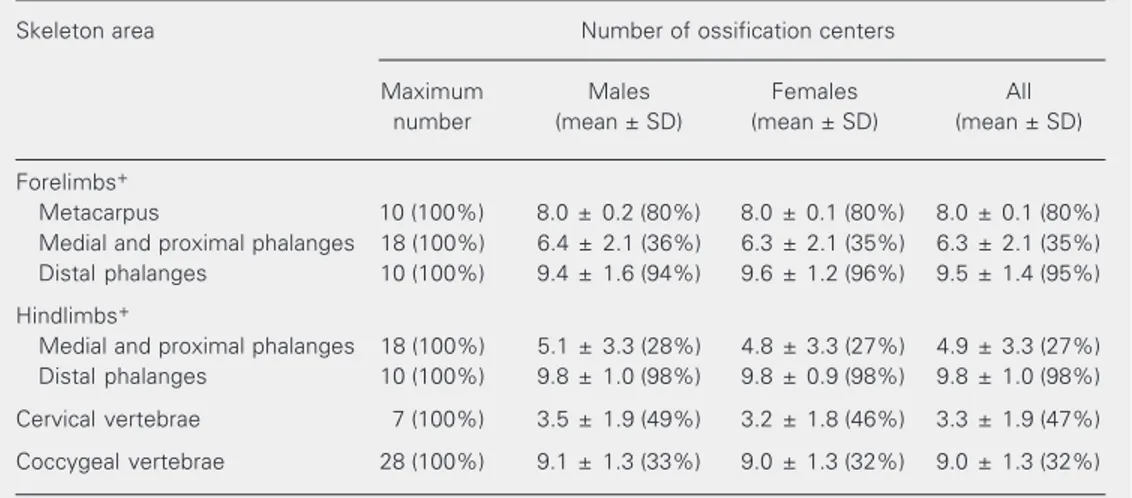
Metatarsus (10 ossification centers) as well as sternum (6 sternebrae) bones were already completely ossified (100%) in al-most all full-term fetuses examined in this study. Ossification of distal phalanges of both fore- and hindlimbs (95%) was nearly complete in most of the evaluated fetuses (Table 4) as well. The correlation coeffi-cients (r) of linear regression analysis for
fetal weight and number of ossification cen-ters in forepaw and hindpaw distal phalan-ges were 0.22 and 0.27, respectively. The degree of ossification of the foregoing skel-eton areas on pregnancy day 21, therefore, showed no dependence on fetal body weight (Tables 5, 6 and 7). Almost all fetuses exam-ined on pregnancy day 21 - irrespective of their body weights - had 80% of the maxi-mum number of metacarpal ossification cen-ters (Tables 4 and 5), a finding suggesting that the extent of ossification of this bone is
Table 4. Extent of skeleton ossification of male and female rat fetuses on pregnancy day 21.
Skeleton area Number of ossification centers
Maximum Males Females All
number (mean ± SD) (mean ± SD) (mean ± SD)
Forelimbs+
Metacarpus 10 (100%) 8.0 ± 0.2 (80%) 8.0 ± 0.1 (80%) 8.0 ± 0.1 (80%) Medial and proximal phalanges 18 (100%) 6.4 ± 2.1 (36%) 6.3 ± 2.1 (35%) 6.3 ± 2.1 (35%) Distal phalanges 10 (100%) 9.4 ± 1.6 (94%) 9.6 ± 1.2 (96%) 9.5 ± 1.4 (95%)
Hindlimbs+
Medial and proximal phalanges 18 (100%) 5.1 ± 3.3 (28%) 4.8 ± 3.3 (27%) 4.9 ± 3.3 (27%) Distal phalanges 10 (100%) 9.8 ± 1.0 (98%) 9.8 ± 0.9 (98%) 9.8 ± 1.0 (98%)
Cervical vertebrae 7 (100%) 3.5 ± 1.9 (49%) 3.2 ± 1.8 (46%) 3.3 ± 1.9 (47%)
Coccygeal vertebrae 28 (100%) 9.1 ± 1.3 (33%) 9.0 ± 1.3 (32%) 9.0 ± 1.3 (32%)
Data are reported as the number (mean ± SD) of ossification centers and as the percentage of the maximum number of ossification centers for the skeleton area. A total of 1484 fetuses were examined.
+Numbers of ossification centers are shown as the total number for both right and left limbs.
No statistically significant difference (P > 0.05) was found between males and females (Mann-Whitney U-test). Table 3. Body weight of rat fetuses according to their relative position within the uterine horn.
Horn Number Relative position of the fetus within the uterine horn+
size of litters
1 2 3 4 5 6 7 8
3 1 5.4 ± 0.3 5.3 ± 0.2 5.0 ± 0.2
4 5 5.0 ± 0.3 5.0 ± 0.4 5.0 ± 0.4 4.6 ± 0.4
5 33 4.5 ± 0.4 4.5 ± 0.4 4.6 ± 0.4 4.5 ± 0.4 4.6 ± 0.4
6 30 4.3 ± 0.4 4.4 ± 0.4 4.4 ± 0.4 4.1 ± 0.3 4.4 ± 0.3 4.2 ± 0.3
7 9 4.3 ± 0.3 4.3 ± 0.4 4.2 ± 0.3 4.3 ± 0.4 4.2 ± 0.4 4.1 ± 0.3 4.1 ± 0.4
8 1 4.2 ± 0.4 3.9 ± 0.3 4.0 ± 0.1 4.2 ± 0.5 4.1 ± 0.1 3.9 ± 0.2 4.0 ± 0.1 3.3 ± 1.2
Fetuses were obtained by cesarean section on pregnancy day 21. Analysis included only litters without resorptions and with the same number of fetuses in the right and left uterine horns. Data are reported as means ± SD, in grams.
+Numbers from 1 to 8 indicate relative position from cervix to ovary extremity. Horn size = number of fetuses
independent of fetal weight. The two meta-carpal bones that were not yet ossified at term were those of finger 1 (one on each forepaw) that, in the rat, ossify after birth. Proximal and medial phalanges of fore- and hindlimbs, on the other hand, were rather incompletely ossified on pregnancy day 21. It is of note that the degree of ossification of medial and proximal phalanges at near term pregnancy proved to be dependent on fetal body weight, varying from 14 to 39% from lighter to heavier fetuses, and from 5 to 48%
of the maximum number of ossification cen-ters in fore- and hindpaws, respectively (Tables 5 and 6, Figure 2A,B).
The extent of ossification of rat fore- and hindpaws on pregnancy day 21 and postnatal day 7 is illustrated in Figure 3. As shown in panel 3B, except for finger 1 (the smallest digit), metacarpal bones as well as proximal, medial and distal phalanges were usually ossified in forepaw fingers on postnatal day 7. On pregnancy day 21 (panel 3A), four metacarpal bones, four proximal and all
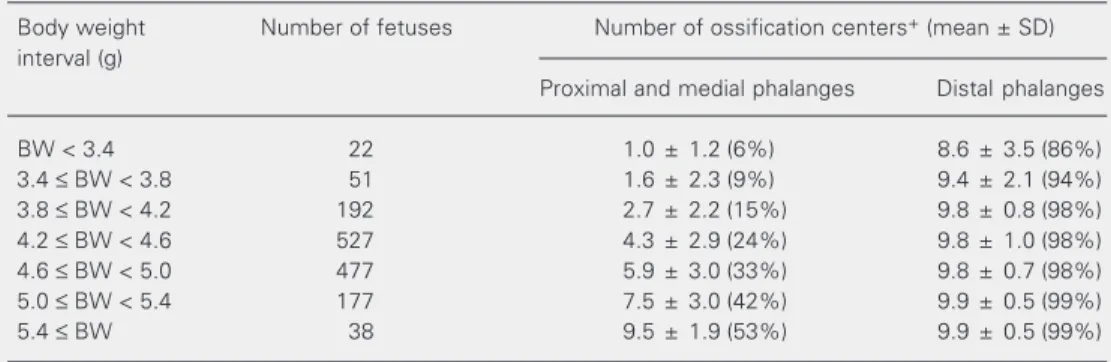
dis-Table 6. Relationship between body weight and extent of ossification of hindlimb phalanges in rat fetuses on pregnancy day 21.
Body weight Number of fetuses Number of ossification centers+ (mean ± SD)
interval (g)
Proximal and medial phalanges Distal phalanges
BW < 3.4 22 1.0 ± 1.2 (6%) 8.6 ± 3.5 (86%)
3.4 ≤ BW < 3.8 51 1.6 ± 2.3 (9%) 9.4 ± 2.1 (94%)
3.8 ≤ BW < 4.2 192 2.7 ± 2.2 (15%) 9.8 ± 0.8 (98%)
4.2 ≤ BW < 4.6 527 4.3 ± 2.9 (24%) 9.8 ± 1.0 (98%)
4.6 ≤ BW < 5.0 477 5.9 ± 3.0 (33%) 9.8 ± 0.7 (98%)
5.0 ≤ BW < 5.4 177 7.5 ± 3.0 (42%) 9.9 ± 0.5 (99%)
5.4 ≤ BW 38 9.5 ± 1.9 (53%) 9.9 ± 0.5 (99%)
Data are reported as the number (mean ± SD) of ossification centers and as the percentage of the maximum number of ossification centers for the skeleton area. A total number of 1484 fetuses were examined.
+Numbers of ossification centers are shown as the total number for both right and left limbs. BW = body
weight. Maximum number of ossification centers (100%): proximal + medial phalanges = 20; distal phalan-ges = 10.
Table 5. Relationship between body weight and extent of ossification of metacarpus and forelimb phalanges in rat fetuses on pregnancy day 21.
Body weight Number of fetuses Number of ossification centers+ (mean ± SD)
interval (g)
Metacarpus Proximal and medial phalanges Distal phalanges
BW < 3.4 22 7.7 ± 0.9 (77%) 2.8 ± 2.5 (16%) 9.1 ± 2.3 (91%)
3.4 ≤ BW < 3.8 51 8.0 ± 0.1 (80%) 4.0 ± 2.2 (22%) 9.5 ± 1.8 (94%) 3.8 ≤ BW < 4.2 192 8.0 ± 0.1 (80%) 5.4 ± 2.1 (30%) 9.4 ± 1.6 (94%) 4.2 ≤ BW < 4.6 527 8.0 ± 0.1 (80%) 6.1 ± 2.2 (34%) 9.5 ± 1.3 (95%) 4.6 ≤ BW < 5.0 477 8.0 ± 0.0 (80%) 6.9 ± 1.8 (38%) 9.5 ± 1.4 (95%) 5.0 ≤ BW < 5.4 177 8.0 ± 0.0 (80%) 7.4 ± 1.4 (41%) 9.6 ± 1.2 (96%)
5.4 ≤ BW 38 8.0 ± 0.0 (80%) 7.8 ± 0.7 (43%) 9.5 ± 1.8 (95%)
Data are reported as the number (mean ± SD) of ossification centers and as the percentage of the maximum number of ossification centers for the skeleton area. A total of 1484 fetuses were examined.
+Numbers of ossification centers are shown as the total number for both right and left limbs. BW = body
Number of ossification centers
9
8
7
6
5
4
3
2
1
0
7
6
5
4
3
2
1
0
10
9
8
7
6
5
4
3
2
1
0
14
13
12
11
10
9
8
7
6
5 11
2 3 4 5 6 2 3 4 5 6 7
2 3 4 5 6 7
2 3 4 5 6 7
A
B
C D
Fetal body weight (g)
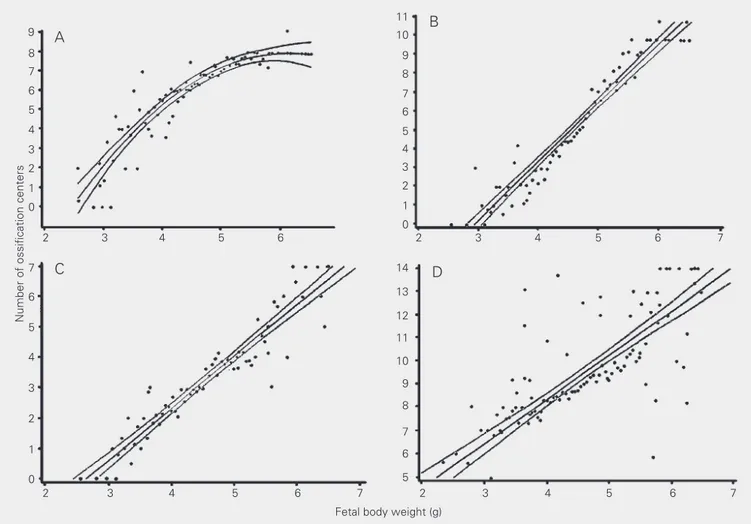
Figure 2. Relationship between fetal body weight (g) on pregnancy day 21 and extent of ossification (number of ossification centers) of proximal and medial phalanges of fore- (panel A) and hindpaws (panel B), as well as cervical vertebrae (panel C) and sacrococcygeal vertebrae (panel D). Regression lines are shown with their respective 95% confidence limits. Quadratic regression models were used for fore- and hindpaw phalanges (A and B) and linear regression was used for cervical and sacrococcygeal veterbrae (C and D). Correlation coefficients were 0.88, 0.97, 0.95, and 0.90 for A, B, C, and D, respectively. Data were for 1484 fetuses (154 litters) from untreated Wistar rats.
Table 7. Relationship between body weight and extent of ossification of cervical and sacrococcygeal vertebrae in rat fetuses on pregnancy day 21.
Body weight Number of fetuses Number of ossification centers (mean ± SD) interval (g)
Cervical vertebrae Sacrococcygeal vertebrae
BW < 3.4 22 0.8 ± 0.9 (12%) 7.0 ± 1.0 (25%)
3.4 ≤ BW < 3.8 51 1.9 ± 1.4 (27%) 7.9 ± 1.2 (28%)
3.8 ≤ BW < 4.2 192 2.4 ± 1.7 (34%) 8.3 ± 1.0 (30%)
4.2 ≤ BW < 4.6 527 3.0 ± 1.8 (43%) 8.7 ± 1.0 (31%)
4.6 ≤ BW < 5.0 477 3.8 ± 1.8 (55%) 9.3 ± 1.0 (33%)
5.0 ≤ BW < 5.4 177 4.0 ± 1.8 (57%) 9.7 ± 1.05 (35%)
5.4 ≤ BW 38 5.4 ± 1.6 (77%) 12.0 ± 2.0 (43%)
tal forepaw phalanges were already ossified in most fetuses. When day-21 fetuses exhib-ited fewer ossified proximal phalanges (panel 3E), the ossified ones were, as a rule, those of finger 3 (where ossification seems to be-gin) and the nearest fingers (fingers 4 and 2). On postnatal day 7 (panel 3D), hindpaw toes usually exhibited all five metatarsal bones and all fourteen phalanges ossified. As shown in panel 3C, all metatarsal bones and distal phalanges, and only three proximal
phalan-ges were ossified in the hindpaw of this pregnancy day 21 fetus. Although we had decided to count proximal and medial pha-langes together, we seldom found medial phalanges of fore- or hindpaws already ossi-fied on pregnancy day 21. Ossiossi-fied medial phalanges were found only among the heavi-est day-21 fetuses.
Ossification of cervical and sacrococ-cygeal vertebrae was also rather incomplete on pregnancy day 21 (Tables 4 and 7). In both cases, the number of ossified centers was found to be clearly dependent on fetal body weight, ranging from 12 to 77% from lighter to heavier fetuses and from 25 to 43% of the maximum number of ossified centers in the cervical and sacrococcygeal verte-brae, respectively (Table 7, Figure 2C,D).
No sex-related difference was found in any of the skeletal areas evaluated in the present study regarding the extent of ossifi-cation on pregnancy day 21 (Table 4). Com-parisons of the number of ossification cen-ters found in fetuses located in the left uter-ine horn with that of those located in the right horn - together and separately accord-ing to each body weight interval - also showed no difference between horn side locations (data not shown).
Discussion
The data reported in the present paper indicate that the body weight of full-term rat fetuses is independent of the uterine horn side where the fetus is located and, once litter size is controlled, it is also independent of horn size and of relative position of the fetus within the horn. The results clearly demonstrated, however, that males were slightly (approximately 4.5%) heavier than females and that fetal body weight at term was inversely correlated with litter size.
Data showing that rat fetal weight at term is not influenced by whether the fetus comes from the left or the right uterine horn were also reported by Barr et al. (8). Conflicting
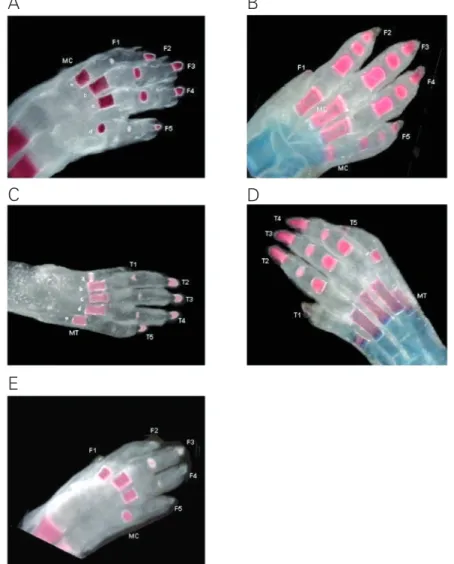
Figure 3. Extent of ossification of fore- and hindpaw bones in the rat on pregnancy day 21 and postnatal day 7. Panels A and D show the forepaws and panel C shows the hindpaws of pregnancy day-21 fetuses cleared and stained with alizarin red S. Panels B (forepaw) and E (hindpaw) show 7-day-old pups cleared and stained with alizarin red S (red color: calcified bones) and Alcian blue (blue color: cartilages). MC = metacarpus, MT = metatarsus, fingers (F1-F5), and toes (T1-T5) were numbered from the medial side.
D
B
A
C
results, however, have been published on a possible relation between fetal body weight and intrauterine horn position in mice, rats and rabbits. McLaren and Michie (9), for instance, reported a position effect in mice according to a U-shaped pattern, i.e., the heaviest fetuses were located toward the ends of the uterine horn and the lightest ones in the middle. von Domarus et al. (10), on the other hand, reported that mouse embryos (on pregnancy day 14) were lighter both at the ovarian and cervical ends (i.e., an inverted U pattern). A further paper by the same authors (11) reported a somewhat different position effect in mice (on day 19), i.e., fetuses on the cervical end were lighter, those in the middle were roughly the same and those of the ovarian end were heavier than the average. In rabbits, a weight gradient from the ovar-ian to the cervical end of the uterine horns was found by Rosahn and Green (12). A few studies performed on rats using different methods to define the position of the fetuses have apparently come to a common conclu-sion that fetuses located in the middle horn position are heavier than those at both ends of the uterine horn (8,13,14). Barr and Brent (15) also found that, in the rat, such an association between fetal body weight and intrauterine position may not be dependent on hemodynamic factors such as the loop-artery configuration that provides blood sup-ply to the uterine horn. Although several studies have reported a position effect on fetal weight in polytocous mammals, the nature of such a position effect has been shown to vary from species to species and, sometimes, between two studies on the same species, and its possible underlying causes remain obscure. In our rat strain, after con-trolling for possible confounding factors such as litter and horn sizes and occurrence of resorptions, we did not observe any trend toward an effect of intrauterine position on fetal body weight at term.
The present data clearly show that almost all fetuses examined had all six (100%)
hindpaws (Table 4). Our results also show that, in pregnancy day 21 fetuses, the num-ber of ossifiedproximal plus medial phalan-ges - both in fore- and hindpaws - was posi-tively correlated with body weight (Tables 5 and 6, Figure 2A,B). In the present study, the number of ossified cervical vertebrae also strongly correlated with fetal body weight (Table 7, Figure 2C). According to the re-sults reported by Aliverti et al. (1), no cervi-cal vertebra was ossified in day-19 fetuses, with the first signs of ossification of this area appearing on day 20, and 81.9% of all day-21 fetuses had at least 5 (i.e., >71.4%) of all cervical vertebrae ossified.
However, our results indicated that ossi-fication of the cervical vertebrae of day-21 fetuses depends on their body weights. The mean (± SD) number of ossified cervical vertebrae of all day-21 fetuses evaluated in this study was 3.3 ± 1.9 (Table 4), i.e., 47.1% of all cervical vertebrae, but the extent of ossification ranged from 12%, among fe-tuses weighing less than 3.4 g, to as much as 77%, among those with body weights equal to or higher than 5.4 g (Table 7).
As shown in the present study, and previ-ously reported in the literature (1-3), ossifi-cation of sacrococcygeal vertebral bodies is still in progress on pregnancy day 21. Our data indicated that, on average, only 32% of sacrococcygeal veterbrae are already ossi-fied in day-21 rat fetuses. As noted with proximal and medial phalanges and cervical vertebral bodies, the extent of ossification of sacrococcygeal vertebrae on day 21 also cor-related positively with fetal body weight, ranging from 25% in the lightest group to 43% among the heaviest fetuses (Table 7, Figure 2D).
In the present study, skeleton areas whose ossification was found to be dependent on
fetal weight were those that were still far from being completely ossified on day 21, i.e., medial and proximal phalanges of fore-paws (35%) and hindfore-paws (28%), as well as cervical (47%) and sacrococcygeal (32%) vertebrae. The extent of ossification of these four areas thus seemed to be the most sensi-tive and reliable index of delayed skeleton ossification in rat fetuses at term (day 21).
Based on the present data, it seems fair to conclude that a lower body weight on day 21 accompanied by a reduced ossification of the above four skeleton areas is a good indi-cator that fetal development is retarded for gestational age. By definition, prenatal growth retardation means that the extent of fetal development on day 21 corresponds to that observed at an earlier gestational age. In other words, retardation implies both a smaller fetal size and a lower body weight, as well as a less developed skeleton. If fetal body weight and skeleton development are differently affected by a treatment, the pro-cess underlying the adverse effect is not merely a prenatal growth retardation. On the other hand, signs of deficient ossification of bones or skeleton areas that, irrespective of fetal body weights, are already extensively ossified on pregnancy day 21 (e.g., sternum, distal phalanges, metacarpus, and metatar-sus), cannot be considered to result only from a treatment-induced prenatal growth retardation. This seems to be particularly true for those day-21 fetuses whose body weights are within the range analyzed in the present study.
Acknowledgments
References
1. Aliverti V, Bonanomi L, Giavini E, Leone VG & Mariani L (1979). The extent of fetal ossification as an index of delayed development in teratogenic studies on the rat. Teratology, 20: 237-242.
2. Ariyuki F, Higaki K & Yasuda M (1980). A study of fetal growth retardation in teratological tests: An examination of the relationship between body weight and ossification of coccygeal vertebrae in mouse and rat fetuses. Teratology, 22: 43-49.
3. Ariyuki F, Ishihara H, Higaki K & Yasuda M (1982). A study of fetal growth retardation in teratological tests: Relationship between body weight and ossification of the skeleton in rat fetuses. Teratology, 26: 263-267.
4. Chahoud I & Kwasigroch TE (1977). Controlled breeding of labora-tory animals. In: Neubert D, Merker HJ & Kwasigroch TE (Editors), Methods in Prenatal Toxicology. Georg Thieme, Stuttgart, Germany, 196-200.
5. Salewski E (1964). Faerbenmethoden zum makroskopischen Nachweis von Implantationsstellen am Uterus der Ratte. Naunyn-Schmiedebergs Archiv für Experimentelle Pathologie und Pharma-kologie, 247: 367.
6. Dawson AB (1926). A note on the staining of the skeleton of cleared specimens with alizarin red S. Stain Technology, 1: 123-124. 7. Ray AA (1985). Statistics. SAS User’s Guide. Version 5. SAS
Insti-tute Inc., Cary, NC, USA.
8. Barr M, Jensh RP & Brent RL (1970). Prenatal growth in the albino rat: Effects of number, intrauterine position and resorptions. Ameri-can Journal of Anatomy, 128: 413-428.
9. McLaren A & Michie D (1960). Control of prenatal growth in mam-mals. Nature, 187: 363-365.
10. von Domarus H, Louton T & Lange-Wühlisch F (1986). The position effect in mice on day 14. Teratology, 34: 73-80.
11. Louton T, von Domarus H & Hartmann P (1988). The position effect in mice on day 19. Teratology, 38: 67-74.
12. Rosahn PD & Green HSN (1936). The influence of intrauterine factors on the fetal weight of rabbits. Journal of Experimental Medicine, 63: 901-921.
13. Norman NA & Bruce NW (1979). Fetal and placental weight relation-ships in the albino rat near term. Teratology, 19: 245-250. 14. Padmanabhan R & Singh S (1981). Effect of intrauterine position on
foetal weight in CF rats. Indian Journal of Medical Research, 73: 134-139.