RAPID COMMUNICATION
Correlation of disability and pain with postural balance
among women with chronic low back pain
Guilherme Carlos Brech, Silvia Ferreira Andrusaitis, Gabriela Faller Vitale, Ju´lia Maria D’Andre´a Greve
Hospital das Clı´nicas da Faculdade de Medicina da Universidade de Sa˜o Paulo (HCFMUSP), Laboratory for Motion Study from the Orthopedics and Traumatology Institute (IOT), Sa˜o Paulo/SP, Brazil.
Email: [email protected] / [email protected] Tel.: 5511 2661-6041
INTRODUCTION
Low back pain is one of the most common musculoske-letal complaints and, from a public health perspective, is the most costly (1,2). In most cases, it is benign and disappears within six weeks, but approximately 20% of individuals with lumbar pain do not show any improvement in their condition, which may progress to chronic low back pain. This chronic condition is difficult to manage and is correlated with many mechanical alterations (3).
Maintenance of postural balance under static or dynamic conditions is essential for any functional activity (4). In individuals with chronic low back pain, the degree of control may change such that performing daily tasks becomes compromised and the chronic nature of the disease is sustained (4-7). The mechanisms that lead to such abnorm-alities of postural control remain unclear. Pain is an important factor in mechanical and neural alterations, but the extent to which it influences postural balance still cannot be determined. One of the hypotheses of this study is that the greater the lumbar pain and physical disability, the worse the patient’s maintenance of both static and dynamic posture.
Thus, the aim of this study was to investigate the correlations between lumbar pain and the degree of disability and postural balance among women with chronic low back pain.
METHODS
Ten sedentary female volunteers aged 30 to 55 years presenting with nonspecific chronic low back pain were studied between April 2008 and April 2009. These women did not have any significant radiological abnormalities and did not have any neurological impairment. For patients to be included in the study, they needed to be free from vestibular abnormalities and musculoskeletal disorders of the hips and lower limbs. The exclusion criteria were as follows: unable to do the evaluation or worsening of the symptoms during the tests. This study was conducted with approval from our institution’s ethics committee (no. 1248/07).
After the volunteers had been given an explanation of the study and had signed an informed consent, they were evaluated in accordance with an assessment protocol (8).
Assessment protocol
The assessment protocol was administered by two expe-rienced evaluators with training in handling the assessment instruments.
All volunteers gave responses to the Oswestry Disability Index (ODI) questionnaire, using the version that was translated and validated for the Portuguese language (9), and the visual analogue scale (VAS) for pain (10) with regard to the daily frequency and intensity of their low back pain. Both the intensity and frequency of pain were represented by a straight line of 10 cm; 0 represented no pain, and 10 represented the worst and most frequent pain imaginable (10). In addition to the questionnaire and the pain scale, four balance tests were conducted on the Balance MasterH force platform system (Neurocom International, Inc. Clackamas, Oregon, USA).
The tests performed included the following:
Clinical test of sensory interaction in balance Static balance was assessed by means of the modified clinical test of sensory interaction in balance. This consists of assessing body sway under four sensory conditions while the individual is on the force platform: eyes open and closed on a stable surface and eyes open and closed on an unstable surface. Each condition was repeated three times for ten seconds each, and the arithmetic mean of each of the attempts was used. The test measured the individual’s speed of movement from the pressure center in degrees per second. For this test, the force platform was used with four coupled sensors. Diminution of the size of this variable was considered to be a positive outcome.
The variables studied were the mean sway speeds with eyes open (EO) and eyes closed (EC) on a stable surface and an unstable surface. The mean sways in the anteroposterior direction and mediolateral direction were also assessed under the same conditions.
The next three tests were performed with the aim of assessing functional limitations in activities of daily living.
Single-leg test
This test was performed with the subject standing on one leg on the force platform under four conditions: with eyes open and closed, for the left and right legs. Like in the Clinical test of sensory interaction in balance, each condition was Copyrightß2012CLINICS– This is an Open Access article distributed under
the terms of the Creative Commons Attribution Non-Commercial License (http:// creativecommons.org/licenses/by-nc/3.0/) which permits unrestricted non-commercial use, distribution, and reproduction in any medium, provided the original work is properly cited.
No potential conflict of interest was reported.
CLINICS 2012;67(8):959-962 DOI:10.6061/clinics/2012(08)17
repeated three times for ten seconds each, and the arithmetic mean of each of the attempts was used. The variables evaluated in this protocol were the mean sway speeds under EO and EC conditions on the left and right legs.
Sit-to-stand test
The sit-to-stand transfer test was performed on a platform with the individual initially sitting on a bench (height of 30 cm) without a backrest and with the knees flexed at 90
˚
and the feet separated by 10 cm in relation to the heels. The arms were kept at the sides of the body throughout the test. The subjects were instructed to stand up safely and quickly. Three repetitions of the movement were made at intervals of 30 seconds between each attempt. The parameters measured were the mean weight transfer time, mean rising rate and sway speed while rising.
Step up-and-over
For this test, the subjects were instructed to go up a 10-cm high step, putting only one foot on the step. The other foot was expected to go directly over the step and down onto the platform without contacting the step. When both feet reached the platform, after going up the step, the subjects were instructed to remain as stationary as possible. Three attempts were made for each leg, starting with the left leg. The variables evaluated in this protocol were the mean weight transfer index, mean movement time and mean impact index.
In all of the balance tests performed in this study, the subjects could only make three attempts to perform each movement in each test. If they were unable to successfully perform the test after three incomplete attempts, the test was excluded.
Statistical analysis
Descriptive analyses (means and standard deviations, SD) were produced in relation to the following sample char-acteristics: age, VAS and ODI.
To verify that the data distribution was normal, the Kolmogorov-Smirnov test was used. Pearson correlations (weak, 0 to 0.3; moderate, 0.3 to 0.7 and strong,.0.7) were calculated between the VAS for pain intensity and frequency and the ODI of balance measurements (11).
The tests were conducted with a significance level of 5%.
RESULTS
The volunteers’ mean age was 46.2 years. The mean intensity and frequency of pain, as determined by the VAS, were 4.9¡3.1 and 6.5¡2.3, respectively; the mean degree of
disability measured by the ODI was 14.5¡7.1. The patients
were not taking any medication or on any treatment plan at the time of the study.
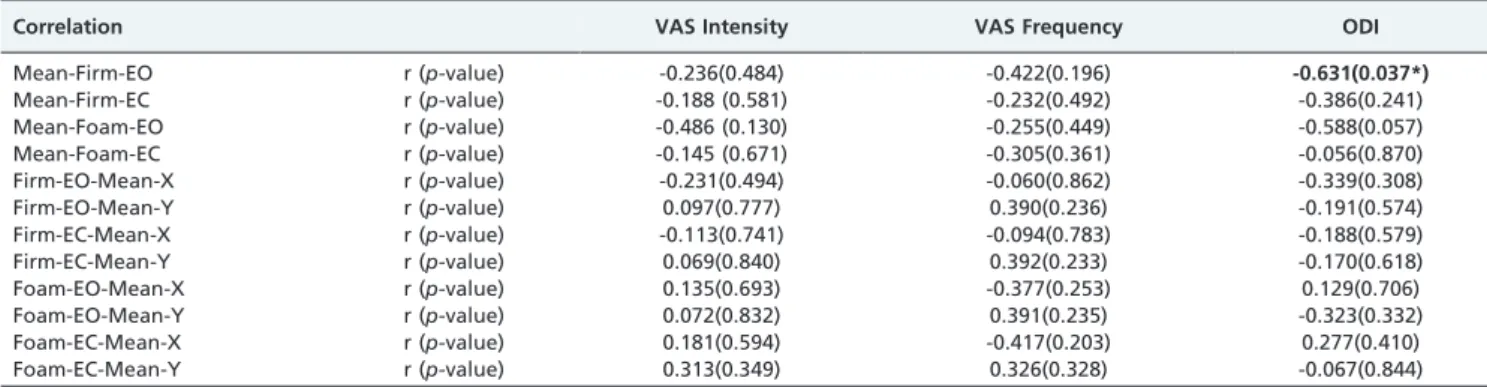
Table 1 shows that the ODI results were inversely correlated with the mean sway speed on a stable surface with eyes open (r = -0.631 andp =0.037).
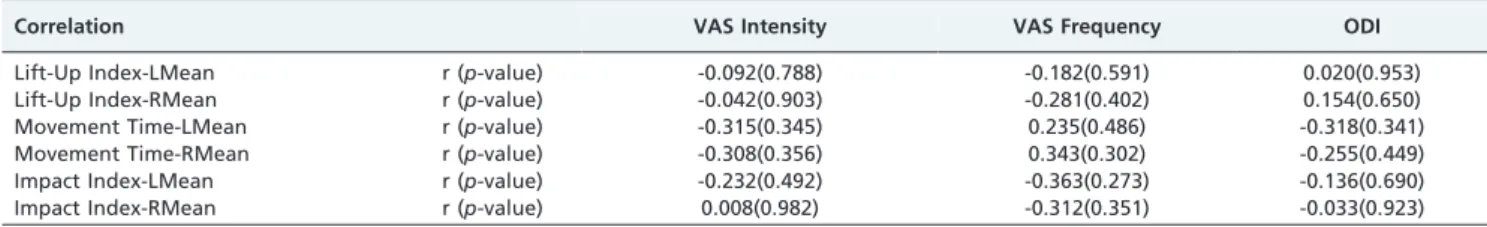
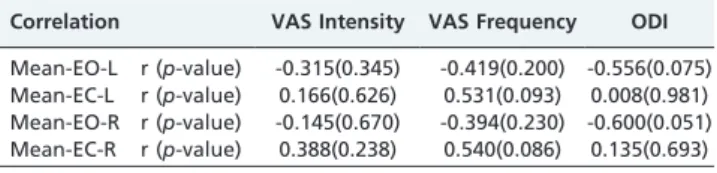
Tables 2 to 4 show that there were no correlations between the intensity and frequency of pain and the degree of disability for the balance measurements of the Step up-and-over, Single-leg and Sit-to-stand tests (p.0.05).
DISCUSSION
Chronic low back pain may be related to many causes, but poor neuromuscular control has been identified as an important factor in the occurrence and perpetuation of this musculoskeletal dysfunction (6,12). Nonetheless, no conclu-sion can yet be reached regarding the extent to which pain may be a determinant for postural control performance.
One of the hypotheses put forward in this study was that greater lumbar pain and physical disability would correlate with worse functional performance in terms of both static and dynamic posture maintenance. Thus, ten patients with chronic low back pain were selected to undergo four tests on the Balance MasterH force platform system. Two of these tests evaluated static posture (the Clinical test of sensory interaction in balance and the Single-leg test), and two evaluated functional activities (the Step up-and-over test and the Sit-to-stand test).
The results obtained from this study did not confirm that there was a correlation between pain and poorer main-tenance of postural balance. The mean sway speed on a stable surface with eyes open presented an inverse correla-tion with the degree of disability (ODI) (r = -0.631 and p =0.037); thus, the greater the value obtained in the ODI, the lower the sway speed. In principle, these data may signify good test performance given that there was less
Table 1 -Correlation between intensity and frequency of pain and degree of disability with the clinical test of sensory interaction in balance test.
Correlation VAS Intensity VAS Frequency ODI
Mean-Firm-EO r (p-value) -0.236(0.484) -0.422(0.196) -0.631(0.037*)
Mean-Firm-EC r (p-value) -0.188 (0.581) -0.232(0.492) -0.386(0.241)
Mean-Foam-EO r (p-value) -0.486 (0.130) -0.255(0.449) -0.588(0.057)
Mean-Foam-EC r (p-value) -0.145 (0.671) -0.305(0.361) -0.056(0.870)
Firm-EO-Mean-X r (p-value) -0.231(0.494) -0.060(0.862) -0.339(0.308)
Firm-EO-Mean-Y r (p-value) 0.097(0.777) 0.390(0.236) -0.191(0.574)
Firm-EC-Mean-X r (p-value) -0.113(0.741) -0.094(0.783) -0.188(0.579)
Firm-EC-Mean-Y r (p-value) 0.069(0.840) 0.392(0.233) -0.170(0.618)
Foam-EO-Mean-X r (p-value) 0.135(0.693) -0.377(0.253) 0.129(0.706)
Foam-EO-Mean-Y r (p-value) 0.072(0.832) 0.391(0.235) -0.323(0.332)
Foam-EC-Mean-X r (p-value) 0.181(0.594) -0.417(0.203) 0.277(0.410)
Foam-EC-Mean-Y r (p-value) 0.313(0.349) 0.326(0.328) -0.067(0.844)
VAS: visual analogue pain scale; ODI: Oswestry Disability Index; Mean: mean sway speed; EO: eyes open; EC: eyes closed; Firm: stable surface; Foam: unstable surface; Mean-Y: mean sway in the anteroposterior plane; Mean-X: mean sway in the mediolateral plane.
* p,0.05.
Back pain: Disability, pain and balance
Brech GC et al. CLINICS 2012;67(8):959-962
sway while maintaining the posture. This result is con-cordant with previous results from similar studies. Henry et al. (6) found that patients with low back pain presented with smaller magnitudes of peak movement from the pressure center and larger peak movements from the center of mass compared with individuals without a history of lumbar pain. These authors concluded that their results represented a choice made by these individuals with low back pain that involved a strategy for using their ankles to compensate for their balance.
Another strategy to correct postural balance among individuals without lumbar pain requires activation of the hip and lumbar spine muscles. In individuals with chronic low back pain, these muscles are activated (12). These findings were supported by the results from the study by Brumagne et al. (7), who determined that individuals with low back pain presented less variability in their choice of strategies. They observed that strategies using the ankles were most commonly used because of the inefficacy of their trunk muscles. Although the equipment used in this study did not have tools to confirm these balance compensation strategies, it can be presumed that the same events occurred among the patients in this study. Their smaller movements from the pressure center were due to a strategy for using the ankles, which was a more effective strategy than using their hips to maintain their balance, thereby resulting in move-ment through a smaller area. Among patients with chronic low back pain, this might be more effective while maintaining balance if the trunk and hip muscles were less active. Future studies must be performed to evaluate these suppositions.
The other balance measurements from the Step up-and-over, Single-leg and Sit-to-stand tests did not present any correlations with the intensity or frequency of pain as assessed through the VAS or with the degree of disability as assessed through the ODI. It has been shown that individuals with chronic lumbar pain have abnormal postural balance in
comparison with individuals without a history of pain, especially under conditions that require greater postural demands. Mientjes et al. (13) and Della Volpe et al. (4) did not observe any notable abnormalities in static balance among individuals with lumbar back pain; however, when these individuals were subjected to more challenging postures, such as with their eyes closed and staying upright on an unstable surface, the individuals with low back pain presented greater sway than the control group. Alternatively, in a systematic review study, Ruhe et al. (3) found that there was no correlation between pain intensity and the magnitude of excursion from the pressure center.
This study had certain limitations, especially with regard to the equipment used and the small sample size. The Balance MasterH system is not considered to be the gold standard for assessing postural balance, but it is capable of assessing functional balance, thereby reproducing activities of daily living. Regarding the small sample size, although the incidence of chronic low back pain is high, its multifactorial nature means that there will be subgroups of patients with different characteristics within a given group of individuals presenting with pain. Thus, these subgroups should not be grouped within the same study (14). We sought to demarcate the most homogenous study group possible.
Considering the results encountered, new studies should be performed using assessment methods of greater specifi-city, including the use of a force platform. The findings may possibly be correlated with trunk and ankle muscle activity using surface electromyography during tests that are more challenging to postural balance.
The intensity and frequency of lumbar pain were not correlated with postural balance in women with chronic low back pain. Regarding postural balance, the only significant correlation identified was between the degree of disability and the sway speed on a stable surface with eyes open.
Table 2 -Correlations between intensity and frequency of pain, degree of disability and balanced measurements in the Sit-to-stand test.
Correlation VAS Intensity VAS Frequency ODI
Lift-Up Index-LMean r (p-value) -0.092(0.788) -0.182(0.591) 0.020(0.953)
Lift-Up Index-RMean r (p-value) -0.042(0.903) -0.281(0.402) 0.154(0.650)
Movement Time-LMean r (p-value) -0.315(0.345) 0.235(0.486) -0.318(0.341)
Movement Time-RMean r (p-value) -0.308(0.356) 0.343(0.302) -0.255(0.449)
Impact Index-LMean r (p-value) -0.232(0.492) -0.363(0.273) -0.136(0.690)
Impact Index-RMean r (p-value) 0.008(0.982) -0.312(0.351) -0.033(0.923)
VAS: visual analogue pain scale; ODI: Oswestry Disability Index; Lift-Up Index Mean: mean weight transfer index; Movement Time-Mean: mean movement time; Impact Index-Mean: mean impact index; L: left leg; R: right leg.
Table 3 -Correlations between intensity and frequency of pain, degree of disability and balance measurements in the Sit-to-stand test.
Correlation VAS Intensity VAS Frequency ODI
WT Transfer-Mean r (p-value) -0.513(0.106) -0.595(0.054) -0.288(0.391)
Rising Index-Mean r (p-value) -0.245(0.468) -0.424(0.193) -0.266(0.430)
COG Sway Vel-Mean r (p-value) 0.361(0.275) 0.476(0.139) 0.241(0.476)
VAS: visual analogue pain scale; ODI: Oswestry Disability Index; WT Transfer-Mean: mean weight transfer; Rising Index-Mean: mean rising rate; COG Sway Vel-Mean: sway speed while rising.
CLINICS 2012;67(8):959-962 Back pain: Disability, pain and balance Brech GC et al.
AUTHOR CONTRIBUTIONS
Brech GH, Andrusaitis SF and Vitale GF performed the data collection, analysis and preparation of the manuscript. D’Andre´a Greve JM was supervisor and editor of the manuscript.
REFERENCES
1. Holm S, Indahl A, Solomonow M. Sensorimotor control of the spine. J Electromyogr Kinesiol. 2002;12(3):219-34, http://dx.doi.org/10.1016/ S1050-6411(02)00028-7.
2. Yahia A, Jribi S, Elleuch M, Baklouti S, Elleuch MH. Evaluation of the posture and muscular strength of the trunk and inferior members of patients with chronic lumbar pain. Joint Bone Spine. 78(3):291-297. 3. Ruhe A, Fejer R, Walker B. Center of pressure excursion as a measure of
balance performance in patients with non-specific low back pain compared to healthy controls: a systematic review of the literature. 2011;20(3):358-68.
4. Della Volpe R, Popa T, Ginanneschi F, Spidalieri R, Mazzochio R, Rossi A. Changes in coordination of postural control during dynamic stance in chronic low back pain patients. Gait Posture. 2006;24(3):349-55, http:// dx.doi.org/10.1016/j.gaitpost.2005.10.009.
5. Kuukkanen TM. An experimental controlled study on postural sway and therapeutic exercise in subjects with low back pain. Clinical Rehabilitation. 2000;14(2):192-202, http://dx.doi.org/10.1191/026921500667300454. 6. Henry SM, Hitt JR, Jones SL, Bunn JY. Decreased limits of stability in
response to postural perturbations in subjects with low back pain. Clin. Biomech (Bristol, Avon). 2006;21(9):881-92, http://dx.doi.org/10.1016/ j.clinbiomech.2006.04.016.
7. Brumagne S, Janssens L, Knapen S, Claeys K, Suuden-Johanson E. Persons with recurrent low back pain exhibit a rigid postural control strategy. Eur Spine J. 2008;17(9):1177-84, http://dx.doi.org/10.1007/ s00586-008-0709-7.
8. Andrusaitis SF, Brech GC, Vitale GF, Greve JMDA. Trunk stabilization among women with chronic lower back pain: a randomized, controlled, and blinded pilot study. Clinics. 2011;66(9):1645-50, http://dx.doi.org/ 10.1590/S1807-59322011000900024.
9. Vigatto R, Alexandre NMC, Correa Filho HR. Development of a Brazilian Portuguese Version of the Oswestry Disability Index. Spine. 2007;32(4): 481-6, http://dx.doi.org/10.1097/01.brs.0000255075.11496.47.
10. Dolan P, Greenfield K, Nelson R, Nelson I. Can exercise therapy improve the outcome of microdiscectomy? Spine (Phila Pa 1976). 2000;25(12):1523-32, http://dx.doi.org/10.1097/00007632-200006150-00011.
11. Kirkwood B, Sterne J. Essential medical statistics. 2nd ed. Oxford: Blackwell Science; 2003.
12. Mok NW, Brauer SG, Hodges PW. Hip strategy for balance control in quiet standing is reduced in people with low back pain. Spine (Phila Pa 1976). 2004;29(6):E107-12, http://dx.doi.org/10.1097/01.BRS.0000115134.97854. C9.
13. Mientjes MIV, Frank SJ (1999) Balance in chronic low back pain patients compared to healthy people under various conditions in upright standing. Clin Biomech (Bristol, Avon). 1999;14(10):710-6.
14. Dankaerts W, O’Sullivan P. The validity of O’Sullivan’s classification system (CS) for a sub-group of NS-CLBP with motor control impairment (MCI): overview of a series of studies and review of the literature. Manual Therapy. 2011;16(1):9-14, http://dx.doi.org/10.1016/j.math.2010.10.006.
Table 4 -Correlations between intensity and frequency of pain, degree of disability and balance measurements at the Step up-and-over test.
Correlation VAS Intensity VAS Frequency ODI
Mean-EO-L r (p-value) -0.315(0.345) -0.419(0.200) -0.556(0.075) Mean-EC-L r (p-value) 0.166(0.626) 0.531(0.093) 0.008(0.981) Mean-EO-R r (p-value) -0.145(0.670) -0.394(0.230) -0.600(0.051) Mean-EC-R r (p-value) 0.388(0.238) 0.540(0.086) 0.135(0.693)
VAS: visual analogue pain scale; ODI: Oswestry Disability Index; Mean: mean sway speed; EO: eyes open; EC: eyes closed; L: left leg; R: right leg.
Back pain: Disability, pain and balance
Brech GC et al. CLINICS 2012;67(8):959-962