Correlation between Body Composition and
Walking Capacity in Severe Obesity
G Correia de Faria Santarém1☯
*, R de Cleva1☯, Marco Aurélio Santo1☯, Aline
Biaseto Bernhard1☯, Alexandre Vieira Gadducci1☯, Julia Maria D’Andrea Greve2☯, Paulo Roberto Santos Silva2☯
1Department of Gastroenterology, University of São Paulo Medical School, São Paulo, São Paulo, Brazil, 2Department of Orthopedics and Traumatology, University of São Paulo Medical School, São Paulo, São Paulo, Brazil
☯These authors contributed equally to this work. *[email protected]
Abstract
Background
Obesity is associated with mobility reduction due to mechanical factors and excessive body fat. The six-minute walk test (6MWT) has been used to assess functional capacity in severe obesity.
Objective
To determine the association of BMI, total and segmental body composition with distance walked (6MWD) during the six-minute walk test (6MWT) according to gender and obesity grade.
Setting
University of São Paulo Medical School, Brazil; Public Practice.
Methods
Functional capacity was assessed by 6MWD and body composition (%) by bioelectrical impedance analysis in 90 patients.
Results
The mean 6MWD was 514.9±50.3 m for both genders. The male group (M: 545.2±46.9 m) showed a 6MWD higher (p = 0.002) than the female group (F: 505.6±47.9 m). The mor-bid obese group (MO: 524.7±44.0 m) also showed a 6MWD higher (p = 0.014) than the super obese group (SO: 494.2±57.0 m). There was a positive relationship between 6MWD and fat free mass (FFM), FFM of upper limps (FFM_UL), trunk (FFM_TR) and lower limbs (FFM_LL). Female group presented a positive relationship between 6MWD and FFM, FFM_UL and FFM_LL and male group presented a positive relationship between 6MWD and FFM_TR. In morbid obese group there was a positive relationship between 6MWD with
a11111
OPEN ACCESS
Citation:Correia de Faria Santarém G, de Cleva R, Santo MA, Bernhard AB, Gadducci AV, Greve JMD, et al. (2015) Correlation between Body Composition and Walking Capacity in Severe Obesity. PLoS ONE 10(6): e0130268. doi:10.1371/journal.pone.0130268
Academic Editor:Joseph Devaney, Children's National Medical Center, Washington, UNITED STATES
Received:February 12, 2015
Accepted:May 19, 2015
Published:June 22, 2015
Copyright:© 2015 Santarém et al. This is an open access article distributed under the terms of the Creative Commons Attribution License, which permits unrestricted use, distribution, and reproduction in any medium, provided the original author and source are credited.
Data Availability Statement:All relevant data are within the paper and its Supporting Information files.
Funding:The authors received no specific funding for this work.
FFM, FFM_UL, FFM_TR and FFM_LL. The super obese group presented a positive rela-tionship between 6MWD with FFM, FFM_TR and FFM_LL.
Conclusions
Total and segmental FFM is associated with a better walking capacity than BMI.
Introduction
The obesity has doubled worldwide and is considered the fifth risk factor for mortality. Future projections estimates a 33% increase in obesity and 130% increase in severe obesity prevalence in 2030 [1]. Obesity is associated with a reduction in individual mobility, aggravating previous sedentary lifestyle [2,3]. Activities of daily living (ADL) are impaired due not only to excessive body fat accumulation but also to mechanical factors that might reduce walking capacity. The ability to walk is a simple measure of physical function and an important component of quality of life, since it reflects the capacity to perform day-to-day activities [4,5]. The distance traveled during the six-minute walk test (6MWD) on a horizontal surface is an easy, validated and inex-pensive method to evaluate individual physical function [6,7].
Previous studies [8,9] demonstrated a negative relationship between the body mass index (BMI) and 6MWD. Although BMI is an index widely accepted to classify the severity of obe-sity, it is not considered the best index to determine body composition or fat free mass [10,11].
Some researchers suggested that women have greater total body fat than men for the same BMI [12]. Obese females tend to accumulate adipose tissue in lower extremity (gynoid adipos-ity) [13], while males tend to accumulate adipose tissue in the abdominal area (android adipos-ity). This segmental fat distribution can affect physical function [14].
Obese and super obese (BMI between 50 and 60 kg/m2) patients adapt to their greater body mass by slowing down walking velocity [2,5,15]. The severely obese tend to oscillate their trunk when walking and to increase the distance between ankles when stopping to compensate the extra body mass [15].
To the best of our knowledge there are no studies correlating the 6MWD with segmental body composition in severe obesity. The aim of our study was to correlate the 6MWD with BMI, total and segmental body composition in severe obesity according to gender and obesity grade.
Materials and Methods
Participant recruitment
Eligibility criteria for participants to be admitted to this study were: BMI between 40 and 60 kg/m2, aged between 18 and 60 years, test Timed Up and Go (TUG)10 seconds [16] and ability to understand and perform all procedures proposed. The study protocol was performed according to the ethical recommendations of the Declaration of Helsinki and was approved by the Ethical Committee of the Hospital das Clínicas, University of São Paulo Medical School (protocol number 01038912.6.0000.0068) and conducted after the participants signed the con-sent form.
Subjects were selected according to the exclusion criteria defined as follows: BMI>60 kg/
reach 80% of predicted values) (n = 2) [17], TUG test>10 s (n = 3), systemic corticosteroid
use, absolute contraindication for the 6MWT according to the guidelines of the American Tho-racic Society (ATS) [6] and subjects who did not agree to participate in the study (n = 7). On the basis of these criteria, 16 participants out of 106 were excluded. Then, 90 participants (69 women, age: 40.5 ± 9.6 years, BMI: 47.6 ± 5.4 kg/m2, and 21 men, age: 38.8 ± 10.7 years, BMI: 48.2 ± 4.9 kg/m2) were included and classified according to BMI in morbid obese (MO: BMI between 40 and 49.9 kg/m2) and super obese (SO: BMI between 50 and 60 kg/m2) groups.
Spirometry Test
Data were collected for identification, anthropometric measures and lung function test. Spi-rometry was assessed by maximal respiratory maneuvers and flow-volume curves (MIR, Spiro-bank II, Roma, Italy). Participants breathed in a sitting position through a disposable
mouthpiece positioned between the teeth and lips, ensuring that no leaks occurred during forced expiration. The adopted technical procedures and criteria for acceptability and repro-ducibility followed the recommendations of the European Respiratory Society/American Tho-racic Society (ERS/ATS) [17]. The maneuver of forced vital capacity was performed 3 times and the best performance curve was selected. Forced vital capacity (FVC), forced expiratory volume in one second (FEV1), FEV1/FVC ratio, and mean forced expiratory flow between 25
and 75% of the volume of FVC (FEF25-75%) were assessed in absolute and predicted values [18].
Anthropometric measurements and body mass composition
Body composition was evaluated by anthropometry and bioelectrical impedance analysis (BIA). Height and body weight were measured with participants to the nearest 0.5 cm and 0.1 kg, respectively. Body mass index (BMI) was calculated using the formula: [weight (kg)/height (m2)]. Body composition was determined by BIA (Biospace Co., InBody 230, USA) under con-stant conditions (proper hydration and same time of day). The participant was positioned in orthostatic position on a platform with lower electrodes for feet and the hands holding the upper electrodes. This equipment can measure the impedance of each body segment by using 2 different frequencies (20 KHz and 100 KHz). The chemical composition of lean body mass is conventionally assumed to be constant, with a density of 1.1 kg/m3at a temperature of 37°C and body water content of 73.3%. Thus, the fat free mass of the upper trunk and lower limbs were calculated by multiplying the value of water volume in the upper extremities (the sum of the right and left), trunk and lower limbs (the sum of the right and left) by 1.37. Each segmental of fat free mass was divided by the total body weight for body fat free mass estimate for the seg-ment body weight. BIA determined in percentage values (%): fat mass (FM), fat free mass (FFM), fat free mass of upper limps (FFM_UL), fat free mass of trunk (FFM_TR), fat free mass of lower limbs (FFM_LL), fat mass of upper limps (FM_UL), fat mass of trunk (FM_TR) and fat mass of lower limbs (FM_LL).
Six-minute walk test
were obtained from all participants before and after the test. The test was interrupted only for the following reasons: diaphoresis, pale or ashen appearance, leg cramps, staggering, chest pain and intolerance dyspnea.
Statistical analysis
Sample size was estimated using a linear regression analysis between 6MWD (response vari-able) with gender and obesity grade. The minimum sample size was calculated to be at least 90 subjects. A p<0.05 value was considered as significant.
All data were presented as mean, standard deviation and 95% confidence intervals.
Table 1. Spirometric data (absolute and predicted values) of the participants.
Variables Total (n = 90)
FVC (L) 3.2±0.9
FVC (%) 97.5±12.9
FEV1(ml) 2501.0±875.6
FEV1(%) 94.3±11.7
FEV1/FVC 81.2±7.5
FEV1/FVC (%) 100.1±8.9
FEF25-75%(L/s) 2.9±1.0
FEF25-75%(%) 88.5±7.4
Results are expressed as mean±SD.
FVC, forced vital capacity; FVC, percentage of predicted FVC; FEV1, forced expiratory volume in one
second; FEV1, percentage of predicted VEF1; FEV1/FVC, forced expiratory volume in one second/ forced
vital capacity; FEV1/FVC, percentage of predicted forced expiratory volume in one second/forced vital
capacity; FEF25-75%, forced expiratoryflow between 25 and 75% FVC; FEF25-75%, percentage of predicted
forced expiratoryflow between 25 and 75% FVC.
doi:10.1371/journal.pone.0130268.t001
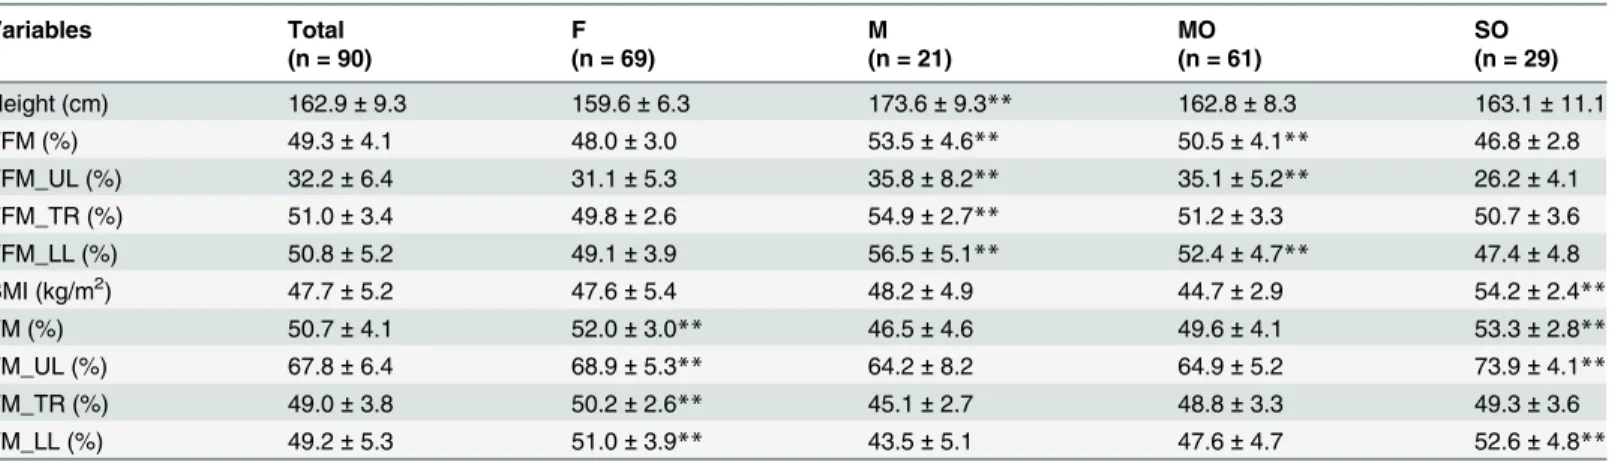
Table 2. Anthropometric characteristics and body composition of the study participants determined by BIA.
Variables Total F M MO SO
(n = 90) (n = 69) (n = 21) (n = 61) (n = 29)
Height (cm) 162.9±9.3 159.6±6.3 173.6±9.3** 162.8±8.3 163.1±11.1
FFM (%) 49.3±4.1 48.0±3.0 53.5±4.6** 50.5±4.1** 46.8±2.8
FFM_UL (%) 32.2±6.4 31.1±5.3 35.8±8.2** 35.1±5.2** 26.2±4.1
FFM_TR (%) 51.0±3.4 49.8±2.6 54.9±2.7** 51.2±3.3 50.7±3.6
FFM_LL (%) 50.8±5.2 49.1±3.9 56.5±5.1** 52.4±4.7** 47.4±4.8
BMI (kg/m2) 47.7±5.2 47.6±5.4 48.2±4.9 44.7±2.9 54.2±2.4
**
FM (%) 50.7±4.1 52.0±3.0** 46.5±4.6 49.6±4.1 53.3±2.8**
FM_UL (%) 67.8±6.4 68.9±5.3** 64.2±8.2 64.9±5.2 73.9±4.1**
FM_TR (%) 49.0±3.8 50.2±2.6** 45.1±2.7 48.8±3.3 49.3±3.6
FM_LL (%) 49.2±5.3 51.0±3.9** 43.5±5.1 47.6±4.7 52.6±4.8**
Results are expressed as mean±SD.
F, female group; M, male group; MO, morbid obese group; SO, super obese group; FFM, fat free mass; FFM_UL, fat free mass of upper limbs; FFM_TR, fat free mass of trunk; FFM_LL, fat free mass of lower limbs; BMI, body mass index; FM, fat mass; FM_UL, fat mass of upper limbs; FM_TR, fat mass of trunk; FM_LL, fat mass of lower limbs;
**p<0.001 between gender (M and F groups) and obesity grade (MO and SO groups).
The association of the studied variables (6MWD with variables: BMI, FFM, FM, FFM_UL, FFM_TR, FFM_LL, FM_UL, FM_TR, FM_LL) was evaluated through the Pearson and Spear-man correlation. Unpaired T-test and Mann-Whitney was used to determine intergroup (F and M, MO and SO groups) differences in numerical data.
Results
Spirometry Test
Ninety severe obese adults (age: 40.1 ± 9.8 years, BMI: 47.7 ± 5.2 kg/m2) were recruited at Met-abolic and Bariatric Surgery Unit, Hospital das Clínicas, University of São Paulo Medical School.
All participants included in this study did not show any significant alterations in spiromet-ric values as FVC, FEV1, FEV1/FVC and FEF25-75%. The spirometric data are summarized in Table 1.
Anthropometric measurements and body mass composition
The anthropometry data of the study participants are presented inTable 2. There was no sig-nificant difference (p = 0.557) in BMI between the male (M) and female (F) groups (M: 48.2 ± 4.9, F: 47.6 ± 5.4). There was a significant difference (p<0.001) between the M and F
groups in terms of FFM, FM, FFM_UL, FFM_TR, FFM_LL, FM_UL, FM_TR and FM_LL. Of the 90 participants studied, 61 (67.8%) were MO (BMI: 44.7 ± 2.9 kg/m2) and 29 (32.2%) were SO (BMI: 54.2 ± 2.4 kg/m2). There was a significant difference (p<0.001) between the
SO and MO groups in terms of FFM, FFM_UL, FFM_LL, FM, FM_UL and FM_LL. The FFM_TR and FM_TR were similar in both groups (p = 0.506).
Six-minute walk test
The 6MWT results are summarized inTable 3. All participants completed the 6MWT without premature end or breaks, and no complications have occurred during the test. The total 6MWD was 514.9 ± 50.3 m. The M group (545.2 ± 46.9 m) showed a 6MWD significantly higher (p = 0.002) than the F group (505.6 ± 47.9 m). The MO group (524.7 ± 44.0 m) also showed a 6MWD significantly higher (p = 0.014) than the SO group (494.2 ± 57.0 m).
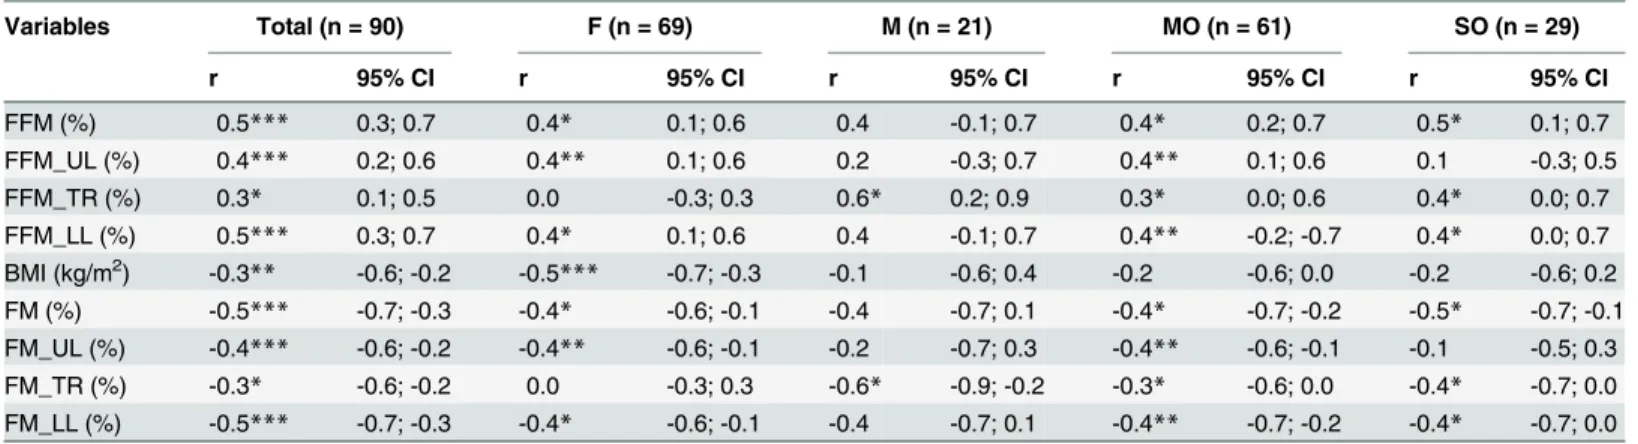
Correlation between body composition and 6MWD
The correlations between body composition and 6MWD are summarized inTable 4. A positive correlation was found between 6MWD and FFM, FFM_UL, FFM_TR, FFM_LL and a signifi-cant negative correlation were found between BMI, FM, FM_UL, FM_TR and FM_LL.
In female group the 6MWD presented a significant positive correlation with FFM,
FFM_UL, FFM_LL and a significant negative correlation with BMI, FM, FM_UL and FM_LL. In male group, 6MWD was significantly positive correlated with FFM_TR and was signifi-cantly negative correlated with FM_TR.
In morbid obese group, a significant positive correlation was found between 6MWD and FFM, FFM_UL, FFM_TR, FFM_LL and a significant negative correlation was found between FM, FM_UL, FM_TR, FM_LL.
Discussion
The objective of our study was to correlate the performance in 6MWT with BMI, total and seg-mental body composition according to gender and obesity grade. Severe obesity affects walking ability and the functional capacity of this population. The importance of functional assessment of morbidly obese patients is well documented [4,20,21]. Nowadays, the 6MWT is being used to evaluate the functional capacity of morbid obese patients to realize their ADL [8,9,21,22].
Table 3. 6MWT parameters of the study participants.
Variables Total F M MO SO
(n = 90) (n = 69) (n = 21) (n = 61) (n = 29)
6MWD (m) 514.9±50.3 505.6±47.9 545.2±46.9* 524.7±44.0* 494.2±57.0
HR (rpm) baseline 83.4±13.4 83.1±12.6 84.8±16.4 83.0±12.7 84.1±15.3
After 6 MWT 147.7±19.0** 147.5±17.4** 148.2±24.5** 147.4±18.9** 147.9±19.4**
SatO2 (%) baseline 96.3±1.9 96.5±1.8 95.6±2.2 96.5±1.6 95.9±2.5
After 6 MWT 96.7±1.6 96.9±1.5 96.0±1.6 96.7±1.4 96.7±2.0
SBP (mmHg) baseline 133.9±18.1 132.2±17.4 140.1±20.0 134.0±20.2 133.2±13.8
After 6 MWT 148.7±20.5** 146.5±20.0** 157.1±20.5** 149.7±19.8** 149.4±21.3**
DBP (mmHg) baseline 84.6±15.0 84.3±15.1 85.6±14.9 83.9±11.2 82.9±2.5
After 6 MWT 84.6±11.0 84.2±10.4 85.7±13.3 85.4±11.7 83.2±2.3
Dyspnea score baseline 1.5±2.1 1.7±2.2 0.9±1.6 1.8±2.7 2.0±2.0
After 6 MWT 4.2±2.8** 4.7±2.7** 2.47±2.1** 4.1±2.9** 4.6±2.4**
Fatigue score baseline 2.1±2.8 2.4±3.1 1.2±1.6 2.2±3.2 2.3±2.4
After 6 MWT 4.2±3.1** 4.6±3.1** 2.5±2.2** 3.9±3.0** 4.7±3.2**
Results are expressed as mean±SD.
6MWD, six-minute walk distance; HR, heart rate; SatO2, oxy-hemoglobin saturation; SBP, systolic blood pressure; DBP, diastolic blood pressure; *p<0.001 between gender (M and F groups) and obesity grade (MO and SO groups);
**p<0.001 between baseline and after 6MWT.
doi:10.1371/journal.pone.0130268.t003
Table 4. Correlation between 6MWD and body mass composition.
Variables Total (n = 90) F (n = 69) M (n = 21) MO (n = 61) SO (n = 29)
r 95% CI r 95% CI r 95% CI r 95% CI r 95% CI
FFM (%) 0.5*** 0.3; 0.7 0.4* 0.1; 0.6 0.4 -0.1; 0.7 0.4* 0.2; 0.7 0.5* 0.1; 0.7
FFM_UL (%) 0.4*** 0.2; 0.6 0.4** 0.1; 0.6 0.2 -0.3; 0.7 0.4** 0.1; 0.6 0.1 -0.3; 0.5
FFM_TR (%) 0.3* 0.1; 0.5 0.0 -0.3; 0.3 0.6* 0.2; 0.9 0.3* 0.0; 0.6 0.4* 0.0; 0.7
FFM_LL (%) 0.5*** 0.3; 0.7 0.4* 0.1; 0.6 0.4 -0.1; 0.7 0.4** -0.2; -0.7 0.4* 0.0; 0.7 BMI (kg/m2) -0.3
** -0.6; -0.2 -0.5*** -0.7; -0.3 -0.1 -0.6; 0.4 -0.2 -0.6; 0.0 -0.2 -0.6; 0.2 FM (%) -0.5*** -0.7; -0.3 -0.4* -0.6; -0.1 -0.4 -0.7; 0.1 -0.4* -0.7; -0.2 -0.5* -0.7; -0.1 FM_UL (%) -0.4*** -0.6; -0.2 -0.4** -0.6; -0.1 -0.2 -0.7; 0.3 -0.4** -0.6; -0.1 -0.1 -0.5; 0.3 FM_TR (%) -0.3* -0.6; -0.2 0.0 -0.3; 0.3 -0.6* -0.9; -0.2 -0.3* -0.6; 0.0 -0.4* -0.7; 0.0 FM_LL (%) -0.5*** -0.7; -0.3 -0.4* -0.6; -0.1 -0.4 -0.7; 0.1 -0.4** -0.7; -0.2 -0.4* -0.7; 0.0
BMI, body mass index; FFM, fat free mass; FM, fat mass; FFM_UL, fat free mass of upper limbs; FFM_TR, fat free mass of trunk; FFM_LL, fat free mass of lower limbs; FM_UL, fat mass of upper limbs; FM_TR, fat mass of trunk; FM_LL, fat mass of lower limbs; 95% CI, 95% confidence intervals;
*p<0.05; **p<0.001; ***p<0.000.1.
In the present study, the mean 6MWD (514.9 ± 50.3 m) was significantly greater than previ-ously studies in morbid obese populations [9,20,22]. Our severe obese patients presented a functional performance similar to healthy individuals [7,23,24]. In previous studies [9,25], morbid obese individuals presented functional capacity similar to elderly population [26] or to patients with cardiac [27] and pulmonary diseases [28]. Only two studies with morbid obese [29,30] patients present similar performance. Some hypotheses may explain the better func-tional performance observed in our study. Our participants could present a better funcfunc-tional capacity, but it seems unlikely since our group presented characteristics (BMI, gender, age) rep-resentative of MO patients included in other studies. Another hypothesis could be methodolog-ical problems during the 6MWT in other studies such as small corridor (less than 30 m), inappropriate verbal stimulus or incorrect measurement of distance traveled, inadvertent inclusion of subjects with cardiopulmonary diseases undiagnosed or inclusion of participants with physical limitations that could reduce 6MWD such as neuromuscular, musculoskeletal or rheumatologic disorders.
We demonstrate a significant negative relationship between the 6MWD and BMI only in women [8,25]. In other previous studies these correlation was less or more marked [26,22] than our results. Nevertheless, BMI was not a good predictor of functional capacity in men and when obesity was graded. 6MWD presented a positive correlation with FFM. These evidences confirm previous findings in subjects with different ages and degrees of obesity [31]. Our study also demonstrated that the FFM might better explain the 6MWD than BMI.
We also observed significant differences in mean 6MWD of F and M, MO and SO groups [8,25,30]. Our data showed a better functional capacity in men than women, which may be explained by a difference in body fat distribution and height [26,22]. In our study, the fat mass of female group predominates in the hip and thighs (gynoid obesity), making the ability to walk less functional than in male group (android obesity). In contrast, FFM of male group was significantly greater than female and concentrated in trunk and lower limbs. Another impor-tant issue is the fact that men were taller than women, and a taller height is associated with a longer stride walking. 6MWD showed a positive association with FFM_TR in men and with FFM_UL and FFM_LL in women. Studies have suggested that women with high body fat in lower limbs present biomechanical disadvantage in comparison with men (central obesity). Adipose deposit in legs alters weight bearing at the knee and consequently, reduces walk capac-ity with a negative impact in functional capaccapac-ity [14]. A high adipose tissue accumulation in the abdominal area changes the center of gravity position, determining an alteration in balance control.
The mass distribution may also explain the significant differences in mean 6MWD of MO and SO groups. In MO group, the 6MWD showed a positive association with FFM, FFM_UL, FFM_TR, FFM_LL and with FFM, FFM_TR and FFM_LL in SO group.
Our data suggest that functional capacity assessed by the 6MWT is not only related to the segmental body composition but also to adequate postural control, balance and coordinated movement.
Conclusions
Supporting Information
S1 Table. Spirometric data (absolute and predicted values) of the participants.Results are expressed as mean ± SD. FVC. forced vital capacity; FVC, percentage of predicted FVC; FEV1,
forced expiratory volume in one second; FEV1, percentage of predicted VEF1; FEV1/FVC,
forced expiratory volume in one second/ forced vital capacity; FEV1/FVC, percentage of
pre-dicted forced expiratory volume in one second/forced vital capacity; FEF25-75%, forced
expira-tory flow between 25 and 75% FVC; FEF25-75%, percentage of predicted forced expiratory flow
between 25 and 75% FVC. (DOC)
S2 Table. Anthropometric characteristics and body composition of the study participants determined by BIA.Results are expressed as mean ± SD. F, female group; M, male group; MO, morbid obese group; SO, super obese group; FFM, fat free mass; FFM_UL, fat free mass of upper limbs; FFM_TR, fat free mass of trunk; FFM_LL, fat free mass of lower limbs; BMI, body mass index; FM, fat mass; FM_UL, fat mass of upper limbs; FM_TR, fat mass of trunk; FM_LL, fat mass of lower limbs;p<0.001 between gender (M and F groups) and obesity grade (MO
and SO groups). (DOC)
S3 Table. 6MWT parameters of the study participants.Results are expressed as mean ± SD. 6MWD, six-minute walk distance; HR, heart rate; SatO2, oxy-hemoglobin saturation; SBP,
sys-tolic blood pressure; DBP, diassys-tolic blood pressure;
p<0.001 between gender (M and F
groups) and obesity grade (MO and SO groups);p<0.001 between baseline and after
6MWT. (DOC)
S4 Table. Correlation between 6MWD and body mass composition.BMI, body mass index; FFM, fat free mass; FM, fat mass; FFM_UL, fat free mass of upper limbs; FFM_TR, fat free mass of trunk; FFM_LL, fat free mass of lower limbs; FM_UL, fat mass of upper limbs; FM_TR, fat mass of trunk; FM_LL, fat mass of lower limbs; 95% CI, 95% confidence intervals;
p<0.05;p<0.001;p<0.000.1.
(DOC)
Author Contributions
Conceived and designed the experiments: RC MAS. Performed the experiments: GCFS AVG JMDAG PRSS. Analyzed the data: RC MAS GCFS AVG ABB. Contributed reagents/materials/ analysis tools: GCFS AVG JMDAG PRSS ABB. Wrote the paper: GCFS RC MAS JMDAG.
References
1. Finkelstein EA, Khavjou OA, Thompson H, Trogdon JG, Pan L, Sherry B, et al. Obesity and severe obe-sity forecasts through 2030. Am J Prev Med. 2012; 42: 563–570. doi:10.1016/j.amepre.2011.10.026
PMID:22608371
2. Hemmingsson E, Ekelund U. Is the association between physical activity and body mass index obesity dependent? Int J Obes. 2007; 31: 663–668. PMID:16953254
3. Anandacoomarasamy A, Caterson I, Sambrook P, Fransen M, March L. The impact of obesity on the musculoskeletal system. Int J Obes. 2008; 32: 211–222. PMID:17848940
4. Lai PP, Leung AK, Li AN, Zhang M. Three-dimensional gait analysis of obese adults. Clin Biomech. 2008; 23: 2–6.
5. Larsson U, Karlsson J, Sullivan M. Impact of overweight and obesity on health-related quality of life—a
6. ATS Committee on Proficiency Standards for Clinical Pulmonary Function Laboratories. ATS state-ment: guidelines for the six-minute walk test. Am J Respir Crit Care Med. 2002; 166: 111–117. PMID: 12091180
7. Enright PL, Sherrill DL. Reference equations for the six-minute walk in healthy adults. Am J Respir Crit Care Med. 1998; 158: 1384–1387. PMID:9817683
8. Beriault K, Carpentier AC, Gagnon C, Ménard J, Baillargeon JP, Ardilouze JL, et al. Reproducibility of the 6-minute walk test in obese adults. Int JSports Med. 2009; 30: 725–727. doi: 10.1055/s-0029-1231043PMID:19585400
9. de Souza SA, Faintuch J, Fabris SM, Nampo FK, Luz C, Fabio TL, et al. Six-minute walk test: functional capacity of severely obese before and after bariatric surgery. Surg Obes Relat Dis. 2009; 5: 540–543.
doi:10.1016/j.soard.2009.05.003PMID:19656738
10. Romero-Corral A, Somers VK, Sierra-Johnson J, Thomas RJ, Collazo-Clavell ML, Korinek J, et al. Accuracy of body mass index in diagnosing obesity in the adult general population. Int J Obes. 2008; 32: 959–966. doi:10.1038/ijo.2008.11PMID:18283284
11. Shah NR, Braverman ER. Measuring adiposity in patients: the utility of body mass index (BMI), percent body fat, and leptin. PLoS One. 2012; 7: e33308. doi:10.1371/journal.pone.0033308PMID:22485140
12. Gallagher D, Visser M, Sepúlveda D, Pierson RN, Harris T, Heymsfield SB. How useful is body mass index for comparison of body fatness across age, sex, and ethnic groups? Am J Epidemiol. 1996; 143: 228–239. PMID:8561156
13. Goodman-Gruen D, Barrett-Connor E. Sex differences in measures of body fat and body fat distribution in the elderly. Am J Epidemiol. 1996; 143: 898–906. PMID:8610703
14. Sternfeld B, Ngo L, Satariano WA, Tager IB. Associations of body composition with physical perfor-mance and self-reported functional limitation in elderly men and women. Am J Epidemiol. 2002; 156: 110–121. PMID:12117699
15. Ponta ML, Gozza M, Giacinto J, Gradaschi R, Adami GF. Effects of Obesity on Posture and Walking: Study Prior to and Following Surgically Induced Weight Loss. Obes Surg. 2014 Apr 22.
16. Podsiadlo D, Richardson S. The timed "Up & Go": a test of basic functional mobility for frail elderly per-sons. J Am Geriatr Soc. 1991; 39: 142–148. PMID:1991946
17. Brusasco V, Crapo R, Viegi G. Coming together: the ATS/ERS consensus on clinical pulmonary func-tion testing. European Respiratory Journal. 2005; 26: 1–2. PMID:15994380
18. Brazilian Society of Thoracic. Brazilian Consensus on Spirometry. J Pneumol. 1996; 22: 1–16.
19. Borg GA. Psychophysical bases of perceived exertion. Med Sci Sports Exerc. 1982; 14: 377–381.
PMID:7154893
20. Donini LM, Brunani A, Sirtori A, Savina C, Tempera S, Cuzzolaro M, et al; SIO-ISDCA Task Force. Assessing disability in morbidly obese individuals: the Italian Society of Obesity test for obesity-related disabilities. Disabil Rehabil. 2011; 33: 2509–2518. doi:10.3109/09638288.2011.575529PMID: 21542694
21. Larsson UE. Influence of weight loss on pain, perceived disability and observed functional limitations in obese women. Int J Obes Relat Metab Disord. 2004; 28: 269–277. PMID:14610533
22. Donini LM, Poggiogalle E, Mosca V, Pinto A, Brunani A, Capodaglio P. Disability affects the 6-minute walking distance in obese subjects (BMI>40 kg/m2). PLoS One. 2013; 8: e75491. doi:10.1371/journal. pone.0075491PMID:24146756
23. Casanova C, Celli BR, Barria P, Casas A, Cote C, de Torres JP, et al. The 6-min walk distance in healthy subjects: reference standards from seven countries. Eur Respir J. 2011; 37: 150–156. doi:10. 1183/09031936.00194909PMID:20525717
24. de Souza SA, Faintuch J, Sant'anna AF. Effect of weight loss on aerobic capacity in patients with severe obesity before and after bariatric surgery. Obes Surg. 2010; 20: 871–875. doi: 10.1007/s11695-010-0109-zPMID:20414740
25. Lord SR, Menz HB. Physiologic, psychologic, and health predictors of 6-minute walk performance in older people. Arch Phys Med Rehabil. 2002; 83: 907–911. PMID:12098148
26. Rubim VSM, Drumond NC, Romeo JLM, Montera MW. Prognostic value of the six-minute walk test in heart failure. Arq Bras Cardiol. 2006; 86:120–125. PMID:16501803
27. Gontijo PL, Lima TP, Costa TR, Reis EP dos, Cardoso FPF, Cavalcanti NFF. Correlation of spirometry with the six-minute walk test in eutrophic and obese individuals. Rev Assoc Med Bras. 2011; 57: 387–
393.
29. Hulens M, Vansant G, Claessens AL, Lysens R, Muls E. Predictors of 6-minute walk test results in lean, obese and morbidly obese women. Scand J Med SciSports. 2003; 13: 98–105. PMID:12641641
30. Larsson UE, Reynisdottir S. The six-minute walk test in outpatients with obesity: reproducibility and known group validity. Physiother Res Int. 2008; 13: 84–93. doi:10.1002/pri.398PMID:18446882