Licence Creative Commom
CC
RBCDH
1 Universidade Católica de Brasília. Programa de Pós-Graduação Stricto Sensu em Gerontologia. Brasília – DF, Brasil.
2 Universidade Estadual de Londrina. Centro de Educação Física e Esportes. Departamento de Educação Física. Londrina – PR, Brasil.
Received: 15 July 2015 Accepted: 17 August 2015
Fat-free mass in overweight and obese older
women: analysis of concurrent validity of
bioelectrical impedance equations
Massa livre de gordura em idosas com sobrepeso e
obesidade: análise da validade concorrente de equações
de impedância bioelétrica
Gislane Ferreira de Melo1 Daniela Rosa Américo2 Maria Fátima Glaner2
Abstract– Older adults, especially women, show a higher level of functional dependence and disability because of muscle and bone mass loss and of a progressive increase in body fat mass. hese changes in body composition components have been observed by diferent techniques. he aim of this study was to analyze the concurrent validity of bioelectrical impedance equations obtained with the Valhalla device7 and those proposed by Gray et al.8
for the estimation of fat-free mass (FFM) in Brazilian elderly women. he sample (n=34; 60-71 years old, height of 140-162 cm) was divided into two groups (n=17) according to relative body fat (%BF) obtained by DXA: %BF ≤41 and %BF >41. DXA was used as the gold standard. All correlation coeicients were satisfactory (r>0.79). FFMValhalla (%BF ≤41: 36.1±3.4 kg; %BF >41: 39.3±3.2 kg) did not difer (p>0.01) from FFMDXA (38.7±3.7 kg) in either group. However, the standard error of the estimate (SEE) was slightly higher (2.114 kg) than the recommended one in the %BF >41 group. FFMGray difered (p<0.01) from FFMDXA in the two groups, although the SEE was satisfactory (<1.8 kg) in the %BF ≤41 group. he residual scores indicated the absence of agreement between FFMGray and FFMDXA, reaching 7.08 kg. Only 9% of the subjects had FFM estimated within an accept-able error when the equation of Gray et al.8 was used, while this percentage was 82%
when the Valhalla equation was used. he latter equation showed concurrent validity for overweight and obese older women.
Key words: Body composition; Electrical impedance; Older adult; Test validity Valida-tion studies.
Analysis of fat-free mass in older women Melo et al.
INTRODUCTION
Following a worldwide trend, two processes have occurred in Brazil since the 1980s, which have produced important changes in the proile of dis-eases in the population. One process, called “demographic transition”, is characterized by a signiicant reduction in fertility and birth rates and a progressive increase in life expectancy. As a result, there is a progressive increase in the proportion of older adults compared to the other age groups, a trend that is expected to grow in the coming decades. he other process, characterized by important changes in the morbidity and mortality proile, is called “epidemiological transition”, in which the occurrence of infectious diseases is reduced and morbidity and mortality due to chronic
noncom-municable diseases are increased1. his transition is the result of diferent
factors such as urbanization, access to health services, and signiicant lifestyle changes.
Within this context, in older adults, especially women, show a higher
level of functional dependence and disability2 because of the loss of muscle
and bone mass and of the progressive increase in body fat5. hese conditions
increase the risk of falls, fractures, recurrent hospitalization, and mortality. he alterations in body composition components have been observed by diferent techniques. Dual-energy X-ray absorptiometry (DXA) has been used to estimate diferent body components. Evidence indicates its validity
to estimate fat-free mass (FFM) in older adults6. In view of its high cost,
time spent, radiation, and need for a well-trained technician, DXA is not an option for large-scale application. In contrast, the practicality and low cost of bioelectrical impedance analysis (BIA) facilitate its application to large samples and its use in ield studies. Furthermore, equations contain-ing predictors obtained by anthropometric measurements and BIA have been developed to estimate FFM more accurately as a function of certain physical, age, sexual and ethnic characteristics.
Among the existing equations developed for older adults, two recom-mended in classical studies did not have their concurrent validity tested
in Brazilian elderly women, i.e., the equations of Valhalla7 and Gray et al.8.
herefore, the objective of the present study was to analyze the concurrent validity of these equations to estimate FFM in Brazilian elderly women.
METHODOLOGICAL PROCEDURES
Sample
According to Pedhauzer9, in cross-validation studies the necessary
number of subjects should correspond to 20% or more of the sample size that gave origin to the equation. Hence, the minimum number of subjects
in the present study was 13 for the equation of Gray et al.8and 15 for the
Valhalla equation7.
Data collection
he volunteers were asked to adhere to the following protocol prior to the measurements: fasting for 4 h; no ingestion of cofee of alcoholic beverages 24 h before measurement; no strenuous physical activity; no use of diuret-ics, and to empty the bladder and bowels before measurement. During data collection, the participant was asked if she had followed the guidelines and if one or more had been ignored, data were collected on another day.
A single person made all measurements on the same day. First, body weight and height were measured, followed by DXA and BIA (Biodynamics 310). he room temperature during collection ranged from 20 to 26°C. Al participants were normally hydrated. Height was measured with a Filizola to the nearest 0.5 cm and body weight was measured with a scale to the
nearest 100 g according to the procedures described by Gordon et al.10.
he Hologic QDR-1500, sotwarev.5.67 was used for the measurement
of fat-free mass and relative fat by DXA. he algorithms of the sotware, which are used to obtain the values of body composition components, are unknown. he procedures described in the manual of the device were followed. Whole-body scans were obtained with the volunteer lying still with the elbows and knees extended. To guarantee the quality of the meas-urements, the device was calibrated weekly and daily. A phantom scan was performed for weekly calibration and quality control testing for daily calibration. he calibrations were carried out according to the procedures described in the manual of the equipment.
Resistance was estimated by BIA (Biodynamics310) according to the
instructions of the manual. his device is equipped with a sotware that provides the values of the body composition components, but the algo-rithms used to estimate these components are unknown. Resistance (R),
body weight (BW) and height (H) were used in the equation of Gray et al.8
and in another equation reported by Lohman7. However, this equation is
given in the body of a table entitled “Bioelectrical impedance equations used in Valhalla bioimpedance analyzers”. Certainly, this is an equation of the manufacturer Valhalla and not of Lohman and will from now on be called “Valhalla equation”.
Equation of Gray et al.8:
FFMkg = 0.00151 (H2) – 0.0344 (R
Ω) + 0.14 (BWkg) – 0.158 (Ageyears) + 20.387.
Valhalla7 equation:
FFMkg = 0.474 (H2
Analysis of fat-free mass in older women Melo et al.
Statistical analysis
First, the Kolmogorov-Smirnov test was applied to test the normality of the data, which showed a normal distribution. Descriptive statistics was
used to characterize the sample and the independent t-test (p≤0.05) to
compare the two groups stratiied according to the relative amount of
body fat (%BF). he criteria suggested by Lohman7 were used to determine
agreement between the Valhalla7 and Gray et al.8 equations and DXA for
estimating FFM in older women: Pearson’s linear correlation coeicient
(r) >0.79; paired t-test (t), where tcalculated < ttabulated (p>0.01), and standard
error of the estimate (SEE = s ) > 1.8 kg for the prediction of FFM.
Finally, analysis of residual scores as proposed by Bland and Altman12 was
performed. he data were analyzed using the licensed Statistical Package for the Social Sciences (SPSS)-IBM program, version 22.0.
RESULTS
We decided to divide the sample into two groups, one with %BF ≤41 and
one with %BF >41 using the median of the sample itself. Gray et al.8 showed
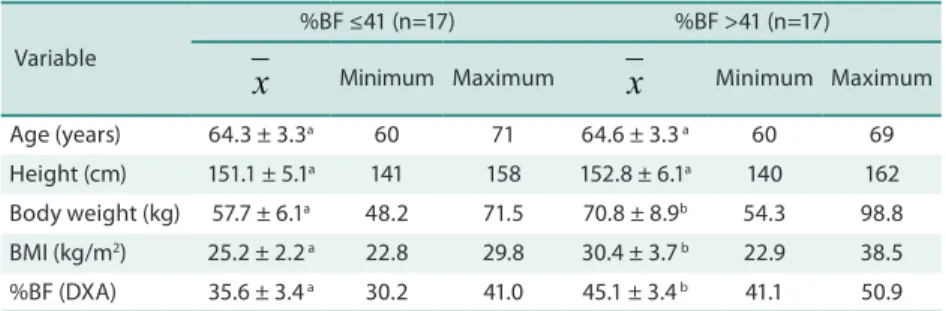
that FFM estimated by BIA is overestimated compared to that obtained by hydrostatic weighing in more obese subjects and that this diferences is smaller in subjects with %BF <41.1%. he characteristics of these two groups are shown in Table 1. he groups were similar in age and height (p>0.05) and difered in terms of the other variables (p≤0.05).
Table 1. Descriptive characteristics of older women stratiied according to relative body fat.
Variable
%BF ≤41 (n=17) %BF >41 (n=17)
x
Minimum Maximumx
Minimum MaximumAge (years) 64.3 ± 3.3a 60 71 64.6 ± 3.3 a 60 69
Height (cm) 151.1 ± 5.1a 141 158 152.8 ± 6.1a 140 162
Body weight (kg) 57.7 ± 6.1a 48.2 71.5 70.8 ± 8.9b 54.3 98.8
BMI (kg/m2) 25.2 ± 2.2 a 22.8 29.8 30.4 ± 3.7 b 22.9 38.5
%BF (DXA) 35.6 ± 3.4 a 30.2 41.0 45.1 ± 3.4 b 41.1 50.9
%BF: relative body fat; BMI: body mass index; DXA: dual-energy X-ray absorptiometry. Means followed by the same superscript letter do not difer (p>0.05, independent t-test)
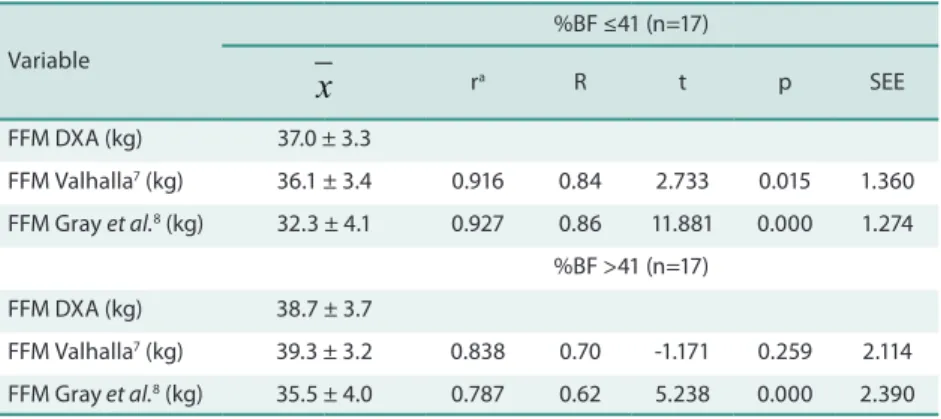
Table 2 shows the statistical results of the comparison of the BIA
equa-tions and DXA. All correlation coeicients were satisfactory (r>0.79)7. In
the two groups, FFM obtained with the Valhalla equation (%BF ≤41: 36.1 ± 3.4 kg; %BF >41: 39.3 ± 3.2 kg) did not difer (p>0.01) from that obtained by DXA (38.7 ± 3.7 kg). However, the SEE (2.114 kg) was slightly higher than
the recommended one7 in the group with higher %BF. Obviously, the
cri-teria were met7 when the whole sample was considered (n=34) (SEE = 1.828
kg). FFM obtained with the equation of Gray et al.8difered signiicantly
Variable
x
ra R t p SEEFFM DXA (kg) 37.0 ± 3.3
FFM Valhalla7 (kg) 36.1 ± 3.4 0.916 0.84 2.733 0.015 1.360
FFM Gray et al.8 (kg) 32.3 ± 4.1 0.927 0.86 11.881 0.000 1.274
%BF >41 (n=17)
FFM DXA (kg) 38.7 ± 3.7
FFM Valhalla7 (kg) 39.3 ± 3.2 0.838 0.70 -1.171 0.259 2.114
FFM Gray et al.8 (kg) 35.5 ± 4.0 0.787 0.62 5.238 0.000 2.390
FFM: fat-free mass; %BF: relative body fat; SEE: standard error of the estimate; DXA: dual-energy X-ra y absorptiometry. a: p<0.0005; r: Pearson’s correlation coeicient; t: t-test; p: p value (probability).
Residual analysis (Figure 1) supports the results shown in Table 2, demonstrating that only 9% of the subjects had FFM estimated within
an acceptable error when the equation of Gray et al.8 was used, while 82%
of the sample had their FFM estimated with excellent accuracy when the Valhalla equation was used.
Figure 1. Residual analysis of fat-free mass (FFM) obtained by dual-energy X-ray absorptiometry (DXA) and by the equations of Gray et al.8 and Valhalla7. The upper and lower dotted lines indicate the limit of validation (SEE
<1.8 kg).
DISCUSSION
he development of an accurate method that can be applied on a large scale is essential to monitor FFM in older women. In this respect, using the
criteria proposed by Lohman7 as parameters, the present results indicate
that the Valhalla equation shows concurrent validity to estimate FFM in both overweight (%BF ≤41) and obese (%BF >41) older women.
he equation of Gray et al.8 has been recommended in classical
text-books7,13. However, its concurrent validity could not be demonstrated for
Analysis of fat-free mass in older women Melo et al.
hese indings agree with those reported by Stolarczyk et al.11 who used
hydrostatic weighing as the gold standard.
he SEEs obtained with the Valhalla equation are lower than that of the original equation (2.8 kg). he correlations are of high magnitude and the coeicient of determination indicates that 70 and 84% of the FFM es-timated in overweight and obese women, respectively, is explained by the BIA equation. his demonstrates the concurrent validity of this equation
for women aged 50 to 71 years, with %BFDXA of 30 to 51%. he standard
deviations indicate that the sample is represented as a whole in terms of DXA. Furthermore, residual analysis (Figure 1) indicates that 82% of the women had their FFM estimated with excellent accuracy, with an SEE less than 1.8 kg, demonstrating the excellent concurrent validity of the Valhalla
equation. he same does not apply to the equation of Gray et al.8 whose
residuals indicate that most (91%) women had their FFM estimated with an SEE of 2 to 7.5 kg, an unacceptable fact.
he stability of the regression coeicient for each predictor variable in the model can contribute substantially to the determination of concurrent validity. he stability of this coeicient from one population to another mainly depends on the number of subjects used for the development of the original prediction equation. Very stable coeicients are obtained when the
ratio of subjects for each predictor variable is at least 20:19. A proportion of
25:1 was used for the Valhalla equation in a sample of women aged 50 to 70
years, while Gray et al.8 used a proportion of 15:1. herefore, the age
homo-geneity of the original sample and the high proportion of women for each predictor variable greatly favored the concurrent validity of the Valhalla equation for the sample of this study. In contrast, the age heterogeneity (22 to 74 years) of the original sample, wide variation in %BF (19.5 to 59%) and low proportion of subjects for each predictor variable (15:1) contributed to
the fact that the equation of Gray et al.8 did not exhibit concurrent validity.
Another factor that could explain the concurrent validity of the
Val-halla equation is the use of H2/R, which is a better predictor than H2 or
R alone. H2/R has shown a high predictive power for both FFM14-15 and
skeletal muscle mass16. BIA is based on the principle that the resistance
ofered to the passage of an electrical current is related to the square length
of the conductor. In this respect, Hofer et al.14 and Lukaski et al.15 showed
that total body water volume is correlated with H2/R in humans. his was
conirmed in the present study in which the Valhalla equation, which uses
H2/R as the regression coeicient, exhibited validity, while the equation of
Gray et al.8, which uses H2 and R as separate predictors, did not.
Further-more, the level of hydration may have also played a role since it tends to
decrease with increasing age17, thus afecting the regression coeicient of
resistance, given the characteristics of the original sample and the sample of the present study.
to DXA using a tetrapolar model, as well as with the results of comparison
of bipolar BIA compared to DXA19.
In general, few of the equations developed in other countries exhibit
concurrent validity for Brazilian subjects. In a similar study18, the only
equation showing concurrent validity (compared to DXA) for adult men was a speciic equation for individuals with elevated body fat (%BF ≥20%). On the one hand, this demonstrates that models for BIA should include the level of %BF of the subjects for more accurate prediction. his appears to be conirmed in the present study since the sample also had high %BF (30 to 51%). On the other hand, studies indicate that DXA tends to
over-estimate %BF compared to computed tomography20, plethysmography21,
four-component model22,23, hydrostatic weighing22,24, anthropometry25,
and BIA26. hese two critical points leave gaps and indicate the need for
more conclusive evidence, i.e., whether BIA models for the estimation of FFM should indeed be structured according to groups with relatively homogenous %BF, and whether DXA is only accurate to quantify bone mineral density.
One important limitation of this study and of any other study designed to elucidate the concurrent validity of these equations is the lack of an unquestionable gold standard. DXA has been indicated in the scientiic literature as the gold standard for the quantiication of %BF and FFM. However, the manufacturers of these devices themselves only recommend
DXA for the quantiication of bone density27, a fact increasing the
prob-ability of error and reducing the validity of the results. Nonetheless, in vitro
experiments found no diferences (p≥0.05) in the estimates of diferent body
components28,29, a fact justifying the use of this method in the present study.
CONCLUSION
he Valhalla7 equation exhibits concurrent validity to estimate FFM in
overweight and obese Brazilian women with the same demographic char-acteristics as those of the present sample. Using this equation, FFM was estimated with an acceptable error (SEE <1.8 kg) in 82% of the sample. he results suggest that the Valhalla is a suitable alternative of relatively low cost to accurately estimate FFM and consequently %BF in Brazilian
women. he equation of Gray et al.8 did not exhibit concurrent validity.
REFERENCES
1. Brasil. Ministério da Saúde. A vigilância, o controle e a prevenção das doenças crônicas não-transmissíveis/DCNT no contexto do Sistema Único de Saúde bra-sileiro. 2005. Available from: <http://bvsms.saude.gov.br/bvs/publicacoes/DCNT. pdf> [2012 Jul 12].
Analysis of fat-free mass in older women Melo et al.
3. Yu S, Umapathysivam K, Visvanathan, R. Sarcopenia in older people. Int J Evid Based Health care 2014;12(4):227-43.
4. Sapir-Koren R, Livshits G. Is interaction between age-dependent decline in mechanical stimulation and osteocyte–estrogen receptor levels the culprit for postmenopausal-impaired bone formation? Osteoporos Int 2013;24(6):1771-89.
5. Kuchibhatla MN, Fillenbaum GG, Kraus WE, Cohen HJ, Blazer DG. Trajectory classes of body mass index in a representative elderly community sample. J Gerontol A Biol Sci Med Sci 2013;68(6):699-704.
6. Kim J, Wang Z, Heymsield SB, Baumgartner RN, Gallagher D. Total body skeletal muscle mass: estimation by a new dual-energy x-ray absorptiometry method. Am J Clin Nutr 2002;76(2):378-83.
7. Lohman TG. Advances in body composition assessment. Current issues in exercise sciences series. Champaign: Human Kinetics; 1992.
8. Gray DS, Bray GA, Gemayel N, Kaplan K. Efect of obesity on bioelectrical imped-ance. Am J Clin Nutr 1989;50(2):255-60.
9. Pedhauzer EJ. Multiple regression in behavioral research. New York: CBS College Publishing, 1982.
10. Gordon CC, Chumlea WC, Roche AF. Stature, recumbent length, weight. In: Lohman TG, Roche AF, Martorell R, editors. Anthropometric standardizing refer-ence manual. Champaign: Human Kinetics Books; 1988. p. 3-8.
11. Stolarczyk LM, Heyward VH, Van Loan MD, Reano LM. he fatness-speciic bio-electrical impedance analysis equations of Segal et al: are they generalizable and practical? Am J Clin Nutr 1997;66(1):8-17.
12. Bland JM, Altman DG. Statistical methods for assessing agreement between two methods of clinical measurements. Lancet 1986;1(8476):307-10.
13. Heyward VH, Stolarczyk LM. Avaliação da composição corporal aplicada. São Paulo: Manole; 2000.
14. Hofer EC, Meador CK, Simpson DC. Correlation of whole-body impedance with total body water volume. J AppI Physiol 1969;27(4):531-4.
15. Lukaski HC, Johnson PE, Bolonchuk WW, Lykken JGI. Assessment of fat-free mass using bioelectrical impedance measurements of the human body. Am J Clin Nutr 1985;41(4):810-7.
16. Rech CR, Salomons E, Lima LRA, Petroski EL, Glaner MF. Estimativa da massa muscular esquelética em mulheres idosas: validade da impedância bioelétrica. Rev Bras Med Esporte 2010;16(2):95-8.
17. Wang Z, Deurenberg P, Wang W, Pietrobelli A, Baumgartner RN, Heymsield
SB. Hydration of fat-free body mass: new physiological modeling approach. Am J Physiol 1999;276(6):995-1003.
18. Glaner MF. Validação cruzada de equações de impedância bioelétrica em homens. Rev Bras Cineantropom Desempenho Hum 2005;7(1):05-11.
19. Rech CR, Glaner MF. Acuracidade da estimativa de gordura corporal por meio da impedância bioelétrica bipolar em homens. Rev Bras Cineantropom Desempenho Hum 2011;13(2):1-7.
20. Salamone LM, Fuerst T, Visser M, Kern M, Lang T, Dockrell M, et al. Measure-ment of fat mass using DEXA: a validation study in elderly adults. J Appl Physiol 2000;89(1)345-52.
21. Sardinha LB, Lohman TG, Teixeira PJ, Guedes DP, Scott B. Comparison of air displacement plethysmography with dual-energy X-ray absorptiometry and 3 ield methods for estimating body composition in middle-aged men. Am J Clin Nutr 1998;68(4):786-93.
22. Clasey JL, Kanaley JA, Wideman L, Heymsield SB, Teates CD, Gutgesell ME, et al. Validity of methods of body composition assessment in young and older men and women. J Appl Physiol 1999;86(5):1728–38.
Corresponding author
Gislane Ferreira de Melo Universidade Católica de Brasília EPCT – QS07 – Lote 01 Bloco G – Sala 119
E-mail: [email protected]; [email protected]
Sports Exer 1993;25(4)528-35.
25. Glaner MF, Rosário WC. Validação cruzada de técnicas antropométricas
para a estimativa da gordura corporal em homens. Lect Educ Fís Deportes (B. Aires) 2005;10(82).
26. Newton Junior RL, Alfonso A, York-Crowe E, Walden H, White AM, Ryan D et al. Comparison of body composition methods in obese African-American women. Obesity 2006;14(3):415-22.
27. Glaner MF. Absortometria de raio X de dupla energia In: Petroski EL, Pires Neto CS, Glaner MF, organizadores. Biométrica. Jundiaí: Fontoura. 2010. p. 229-47.
28. Svendsen OL, Haarbo J, Hassager C, Christiansen C. Accuracy of measurements of body composition by dual energy X-ray absorptiometry in vivo. Am J Clin Nutr 1993;57(5):605-8.