ANALYSIS AND DESIGN OF REINFORCED EARTH WALL FOR SHORE PROTECTION SYSTEM AGAINST TSUNAMI
Amit Srivastava
Department of Civil Engineering Indian Institute of Science Bangalore – 560 012, India
G. L. Sivakumar Babu
Department of Civil Engineering, Indian Institute of Science Bangalore – 560 012, India
Tel:+91-80-22933124; FAX: +91-80-23600404 E-mail: gls@civil.iisc.ernet.in
ABSTRACT
1. INTRODUCTION
The structures such as bulkheads, seawalls or revetments are generally provided along the beach or the shoreline, for the protection of upland area from the wave action of the sea water. Unlike wind generated waves, tsunamis are generated due to underwater displacement of tectonic plates, volcanic eruption or landslide and travel unnoticed across the open sea with amplitude of only few centimeters and a velocity as high as 800 km/hr. However, as they approach sea shore, they gradually build up and in areas where the topography of the seabed is especially suited they reach heights in meters with a speed of 10 to 80 km/hr. The terminal effects of tsunami are observed in terms of damage to coastal areas including structural damages, high water mark in the region, scour, and deposition of both sediments and floating debris. Due to lack of awareness and the proper implementation of protective measures, the recent tsunami on 26th December 2004 caused enormous damage to the economic and social life of the people in India and other countries of Indian Ocean (BAPPENAS 2005). It has also prompted various researchers and practitioners in the world to provide suitable protective measures and design guidelines for the protection of seashore area from such events in future. The provision of massive concrete sea wall with vertical, concave or stepped seaward faces are given in some of the design manuals (USACE) for protecting the upland area from intense wave actions. Such structures, being perfect wave reflectors, create possibilities for scouring of the beach in front of them. In the present study, the authors propose the use of reinforced earth retaining structure that can meet all the design requirements in terms of its stability and strength and it will be able to protect the upland area.
2. TSUNAMI - STRUCTURE INTERACTION
As tsunami propagates shoreward, large turbulent bores rush inland and cause significant damages to the coastal area. In general, the problems related to tsunami waves is studied in terms of its development, shape and propagation characteristics, run up at the shore ( Whitman, 1958; Keller et al., 1960; Shen et al., 1963; Hoyt et al., 1989; Yeh et al., 1989; Titot et al., 1995) and its interaction with the structures that are constructed near the shore or that are built as barrier (Cumberbatch, 1960; Kamel, 1970; Ramsden and Raichlen, 1990; Ramsden, 1996). In the present study, only the last part i.e., the tsunami-structure interaction is presented in terms of estimation of hydrodynamic force on the structure built as a tsunami barrier and also the stability analysis of such structures from those forces.
3. CHARACTERISTICS OF TSUNAMI (Wave Velocity, Wave Length and Wave Period)
The estimation of wave characteristics of the tsunami waves such as design wave height, wave period, wave length and wave velocity are the important input parameters.In the classical tsunami theory, a rigid floor overlain by an incompressible, homogeneous and non-viscous ocean subjected to constant gravity field is considered. The phase velocity (C) and the group velocity (Cg) of
surface gravity wave on a flat ocean of uniform depth are given by Eq. 1 and Eq. 2 respectively (USACE).
(
)
kh kh gh
C = tanh ) (1)
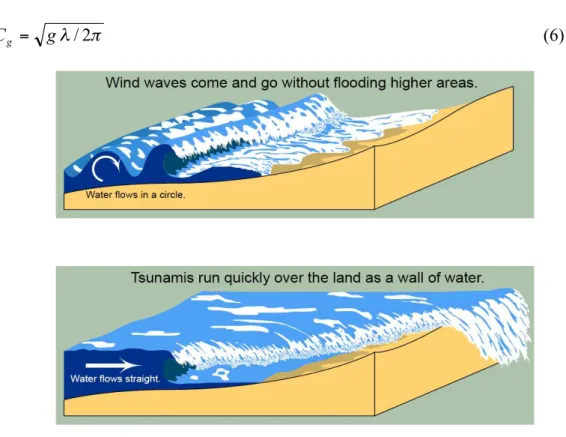
Figure 1. Difference between winds generated wave and tsunami
(
)
!"# $
% &
+ =
kh kh C
Cg
2 sinh 2 1
(2)
h is the ocean depth below sea water level (SWL); g = acceleration due to gravity (9.81 m/sec2) and k is defined as the wave number which is related to the wave length as below:
! "
2
=
k (3)
The wave number also satisfies the relation shown in Eq. 4.
( )
kh kg tanh
2
=
! (4)
The water waves are either treated as long wave (shallow water waves) or short wave (deep water waves). In the long wave approximation (λ>>h, 1/k>>h), as kh→0 tanh(kh) ≈ kh; the phase velocity and group velocity are dependent on the depth of sea floor (h) only and can be obtained using the Eq. 5.
gh C
C= g ! (5)
In the short wave approximation (kh→∞), the waves generated are dispersive in nature. The dispersive waves are those waves whose velocity of propagation depends on the wave frequency (ω). For estimating the phase velocity and group velocity, the following Eq. 6 is used.
! "/2
2C g
C = g = (6)
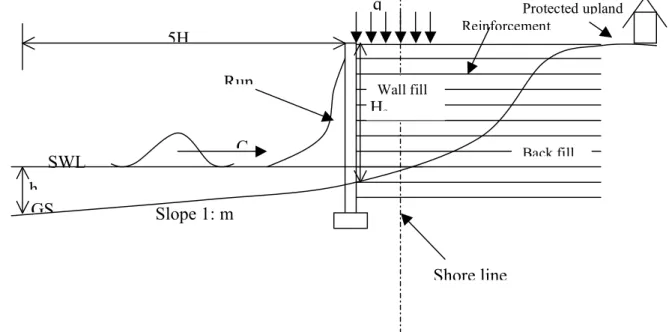
Figure 2. Schematic diagram showing wave propagation, run up and reinforced earth wall as a barrier Protected upland
Run
C
Shore line
GS Slope 1: m
Wall fill
Back fill SWL
Hs
Reinforcement 5H
h
q
Unlike wind generated waves, tsunami waves [Fig (1)] behave like shallow water waves for the longer wave period and it behaves like deep water waves at their shortest periods.
Although a tsunami may be generated in the deep ocean; it becomes dangerous when it reaches the sea shore area as a shallow water wave having very long period (upto or more than 1 hr) and wave length (in kilometers). For the known values of wave period (T) and depth of sea floor below the SWL (h), the estimation of wave length (λ) can be made using the following Eq. 7 (USACE).
!! " # $$
% &
=
g T
h gT
2 2 2
4 tanh 2
' '
( (7)
The above equation explicitly gives λ in terms of wave period T and sufficiently accurate with the maximum error is 10% when h/λ≈1/2(USACE). The estimation of design wave height and wave period need the statistical analysis of the past records. The significant wave height (Hs) is defined
as the average height of the highest one-third of the waves in a wave train. In the similar way, H10
and H1 can be defined as the average of the 10 % and 1% of the highest waves in a wave train
respectively. Assuming a Rayleigh distribution for the wave heights in a wave train, the values of H10 and H1 will be approximately 1.27 Hs and 1.67 Hs. In the design, the choice of wave height
depends on the type of structure to be built. The wave heights H1, H1 to H10 and Hs or H10 is
preferred for rigid, semi rigid and flexible structure respectively (USACE).
The different wave periods are defined as the period of the peak energy density of the spectrum (Tp), average wave period (Tz) and significant wave period (Ts). In the design, an appropriate
choice of design wave height (H) and wave period (T) depends on the designer’s choice or the recommendations given by the codes or the design manuals.
4. DESIGN OF VERTICAL BARRIER
The estimation of maximum breaking wave height at the structure and the amount of expected run up helps in deciding the hydrodynamic force coming on the structure and the provision of maximum crest level to prevent an overtopping. The proposed site specific vertical reinforced soil wall [Fig (2)] is designed and its external and internal stability is checked under static and dynamic condition against the forces coming from the backfill material.
It will help in deciding the base width of the structure (B). After estimating the value of hydrodynamic forces on the structure due to impact of tsunami waves from the front, it is
compared with the passive resistance of the back fill soil using friction circle method. The depth of scour at the toe is also a major factor in the stability of such structures and design for proper preventive measures are given.
The Height (Hs) of the structure
The total height of the structure [Fig (2)] above the still sea water level is the sum of design wave height (H) plus extra allowance given for the wave run up, anticipated settlement of the structure and additional freeboard to avoid overtopping. The following Eq. 8 can be used to calculate the wave run up on the wall (USACE).
(
)
0.05042 1.467 /
! = H h C
g R
(8)
C is the celerity of the water wave, H is the wave height and h is the still water depth at a distance of 5H from the structure.
5. STABILITY ANALYSIS
Following the stability analysis, the base width (B) of the wall can be estimated
5.1 Static condition
In the stability analysis of the reinforced soil wall, the external and internal stability is ensured by giving proper dimensions to the structure and reinforcement. The basic external failure mechanism is sliding, overturning and bearing failure and the basic internal mechanism are tension failure and wedge/pull out failure. Considering the height of the wall as Hs and the set of values for cohesion,
angle of internal friction, angle of wall friction and unit weight for the wall fill ( subscript 1) and for the back fill ( subscript 2) as (c1, φ1, δ1, γ1 c1, φ2, δ2, γ2). Take γb1 and γb2 as the submerged unit
weight of the wall fill and backfill. As most of the areas of east coast of India are located in the seismic zone III (IS: 1893-2000), the dynamic stability of the structure should be ensured taking the horizontal and vertical seismic coefficients as α0 and αv. Further a surcharge of intensity q
(Live load) is assumed to act on the wall and back fill portion.
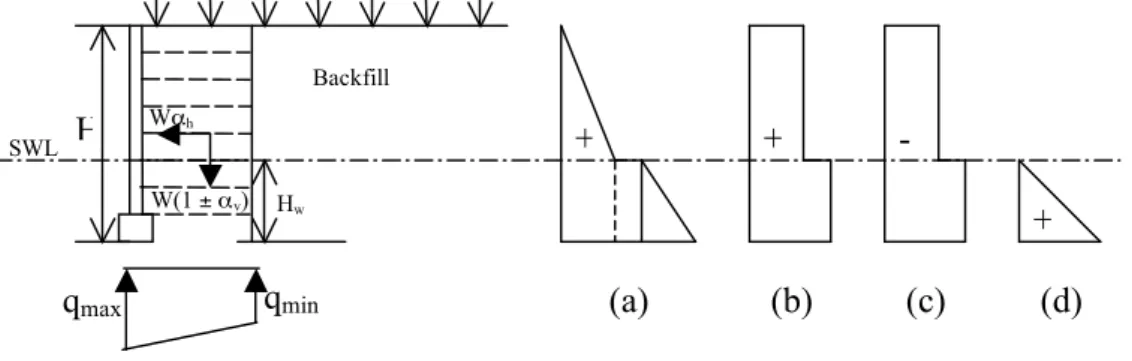
Figure 3. Section of reinforced earth wall (a) Earth pressure due to backfill soil (b) Earth pressure due to surcharge on the backfill (c) Earth pressure due to cohesion of the backfill soil (d) water pressure
W(1 ±αv) Wαh
qmin
qmax SWL
Hw Backfill
H
(a) (b) (c) (d)
+ +
From the Fig (3), the coefficients of active earth pressures above water table (Ka) and below water
table (K′a) can be calculated as below.
(
) ( )
2 2 / 1 2 2 2 2 2 2 cos sin sin 1 1 cos cos ! ! " # $ $ % & ' ( ) * + , + + = -. -. -. a K (9)The value of Ka' is obtained from the Eq. 9 by replacing δ2 with δ2/2. The following equations give
the estimate for Paγ, Paq, Pac and Paw.
(
)
(
)
' 22 ' 2 2 2 2 1 2 1 w a b w w a w a
a K H H K H H H K H
P ! ! !
! = " + " + (10)
(
w)
a w aaq qK H H qK H
P = ! + ' (11)
(
w)
a wa
ac c K H H qK H
P =2 ! + ' (12)
2 2 1 w w aw H
P = ! (13)
As the water table is on the both side of the wall, the effect of Paw is neglected. Total static earth
pressure PT is the sum of Paγ , Paq and Pac.
The moment of static earth pressure about the base can be obtained as below.
(
)
(
)
3 2 1 2 . 3 . 2 1 2 ' 2 ' 2 2 2 w w a b w w w a w w w a a H H K H H H H K H H H H H K M ! ! ! ! + " + # $ % & ' ( " + " = (14)(
)
2 2. ' w
w a w w w a aq H H qK H H H H H qK
M !+
" # $ % & ' + '
= (15)
(
)(
)
22 w w a w
a
ac c K H H H H c K H
M = + ! + (16)
3 6 1 w w aw H
M = ! (17)
Neglecting the effect of Maw, the total moment about base (MT) will be Maγ+Maq-Mac.
5.2 Dynamic condition
As per IS: 1893-4-2000, the dynamic increment due to seismic load is computed as below. The coefficient of active earth pressure for the soil above the water table (Kad) is obtained as below.
(
)
(
)
(
)
(
) (
)
(
)
2 2 / 1 2 2 2 2 2 2 2 cos sin sin 1 1 cos cos cos 1 ! ! " # $ $ % & ' ( ) * + , + -+ + + -± = . / . 0 / 0 . / . . 0 1v ad K (18) Where v h ! ! " ± = # 1 tan 1The coefficient of active earth pressure for the dynamic case for soil below the water table is obtained replacing δ and ψwith δ/2 and
v h s s ! ! " " ± # # 1 1 tan 2 2 1 respectively. The lateral dynamic increment in active case is obtained using the Eq. 19.
(
)
(
)
(
)
[
]
[
(
w)
b w]
w a ad w w a ad i a H H H H H K K H H H H H K K P 2 2 2 ' ' 2 2 3 2 1 2 2 1 ! ! ! ! + " " + + " " = (19)
The additional dynamic increment due to surcharge q is calculated using Eq. 20.
(
)
(
)
! " # $ % & ' + ' ' = H H K K H H H K K q P w a ad w a ad aqi 2 2 3 2 ' ' 2 2 (20)The value of moment of dynamic increment about the base of the wall and dynamic increment due to surcharge q is obtained from Eq. 21 and Eq. 22.
(
)(
)
(
)
(
)
[
(
)
]
w b w w a ad w w w a ad i a H H H H H K K H HH H H H H K K M 2 2 3 ' ' 2 2 2 2 4 4 3 2 4 ! ! ! ! + " " + + + " " = (21)(
)(
)
(
) (
)
H H K K q HH H H H H H K K qM ad a w
w w w a ad aqi 3 ' ' 2 2 ! + + + ! !
= (22)
The weight of the wall (Ww)
(
)
{
w s w}
w L H H H
W
1
1 !
! " +
= (23)
Effective weight of the wall ' w
W
(
)
{
w s w w w}
w L H H H H
W = ! " +! "!
1 1
The moment of weight of the wall about toe (Mw).
(
L/2)
W
Mw = w (25)
Surcharge force on the wall (Q) per unit width L
q
Q= . (26)
The horizontal and vertical seismic force on the weight of the wall will be αhW and ±αvW. The
moment of seismic force acting on the weight of the wall (Msw) is given below.
(
)
[
]
2 2
2 1 2 2 1
L W H
H H L
Msw = " # w #"s w!h ± w!v (27)
The moment of the seismic forces on the surcharge acting on the wall (Msq).
2
L Q H Q
Msq = !h ± !v (28)
Now after calculating all the forces for static and dynamic conditions, the external stability of the structure is checked as described in the next section.
6. Check for the external stability of the structure
6.1 Factor of safety against sliding
The horizontal component of force acting on the vertical wall is resisted by the resisting shearing force acting at the base on the structure. To make the wall safe against sliding, the resisting force should always be more than the driving horizontal force. In general, the factor of safety against sliding can be calculated using the following Eq. 29.
!
!
=D R sliding
F F
FS( ) (29)
Where
!
FR= sum of the horizontal resisting forces and!
FD= sum of the horizontal driving forcesIn static condition
(
)
2.0>
+
=
T w s
P Q W
FS µ
(30)
In dynamic case
(
)
(
)
(
)
1.5 1 ' > + + + + ± + = h w aqi i a T v w s Q W P P P Q W FS ! ! µ " (31)6.2 Factor of safety against overturning
The vertical retaining wall is also subjected to the overturning moment about its toe due to the action of the horizontal force at some height from the base of the wall. The factor of safe against overturning will be the ratio of the resisting moment (MR) and the overturning moment (M0) and
can be evaluated easily.
In static condition:
(
)
0 . 2 2 ' > + = T w os M L Q W F (32)In dynamic condition:
(
)
(
)
5 . 1 2 1 ' > + + + ± + = QH M M M L Q W F h i a i a T v w od ! ! " " (33)6.3 Factor of safety against bearing capacity
The vertical pressure is transmitted to the soil due to self weight of the structure and the moment caused by the horizontal force H. As shown in Fig (3), the base pressure varies linearly and it is maximum at toe and minimum at heel. The magnitude of the base pressure at the toe and heel can be determined using the following equations.
In Static case
(
)
a T w q L M L Q Wq = + + 2 <
' max 6 (34) 0 . 0 6 2 '
min ! > + = L M L Q W q T w (35)
In dynamic case
Net moment about the centre of base of wall
H Q M M
M
(
)
(
)
a nT
v w
q L
M L
Q W
q 1 6 1.25
2 '
max + >
± +
= ! (37)
(
)
(
1)
6 0.02 '
min ! <
± + =
L M L
Q W
q w "v nT
(38)
qa is the allowable bearing pressure of the base of the wall. 7. INTERNAL STABILITY
7.1 Tension failure
The tension force (Ti) per meter width in the grid at depth hi is given as below.
z
vi aw
i K S
T = ! (39)
Where σvi is the maximum vertical pressure intensity.
Static case
For hi≤ (H-Hw), Moment of pressure about center of horizontal section passing at depth hi is given
as.
2 6
2 6
1 3 2 2
2 1
i
a a
i i
a
h K K
qh h K
M = " + ! (40)
(
)
1 26
L M q
v = ! + +
" (41)
For hi > (H-Hw), obtain the value of Maγ, Maq and Maw by replacing H by hi and Hw by (hwi = hi –
(H-Hw)). The value of M2 is calculated as below neglecting the effect of Maw.
ac aq a M M
M
M2 = " + ! (42)
(
1)
2 26
L M q hi vi = ! + +
" (43)
For satisfactory performance Ti < RT
Where RT is the permissible design strength of reinforcement.
Dynamic case
For hi ≤ (H-Hw), obtain the value of M3 and M4 by replacing H and Hw by hi and 0 in the
expression M aγi and Maqi. The value of MnTi will be as below.
β φ1
H
Hw
Ww αh
Ww (1±αv)
Figure 4. Forces considered in wedge/pullout failure in seismic condition !
" # $
% &
+ +
+ +
= M M M h Lh Q
M i
i h nTi
2 1 4
3 1
'
( (44)
(
1)(
)
26 1
L M
q
hi v nTi
vi = " + ±! +
# (45)
For hi > (H-Hw), the value of M5 and M6 are calculated by replacing H by hi and Hw by (hwi=hi
-(H-Hw)) in the expression of Maγi and Maqi.
(
)
(
)
H Q
H H h H
H h H H L
M M M M
h w i
s w i
w h
nTi
! "
" !
+
# # $ % &
& '
( ) +
+
* + ,
-.
/ )
) )
+ + + =
2 2
2
1 1
6 5 2
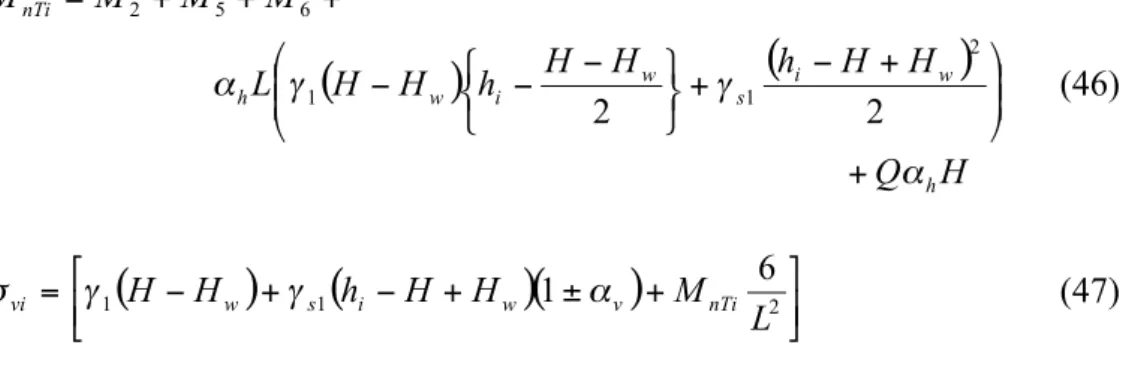
(46)
(
)
(
)(
)
!" # $%
& +
+
'
+
'
= 1 1 1 62
L M H
H h H
H w s i w v nTi
vi ) ) (
* (47)
For satisfactory action Ti≥ 1.25 RT
7.2 Wedge or Pull out failure
In Static case
The forces to be considered in the analysis [Fig (4)] are self weight of the fill in the wedge (Ww),
(
)
! " # $ % & !" # $% & ' + ' + = 2 2 1 1 2 w w w w s w H H H H H HW ( ( (48)
Considering the equilibrium of the wedge, the value of T can be obtained as
(
" !)
! + = 1 1 tan tan a T (49)
Where [
(
)
]2 2 1 2 1 2 1 w w
sH H H
qH
a = " " !
To obtain the maximum value of T (Tmax), the above equation is differentiated with respect toβ
and equated to zero.
(
)
(
45 /2)
tan 2 / 45 tan 1 1 2 max ! ! + " =a T (50)The maximum tension per reinforcement = Tmax/n which should be less than the allowable value. In dynamic case
In seismic condition, the maximum value of tension (Tmax) can be computed as below.
(
)
cc c a a T ! ! " ! tan tan tan 3 1 2 max + + = (51)
Where
(
)
(
3 5)
2 5 2 2 2 4 4 2 4 4 2 tan a a a a a a c ! ! ! ± ! = "
And a2 = αh a1, a3 = a1(1±αv), a4 = a3cos2φ1-a3+a3sin2φ1 and a5 = a3sin2φ1-a2cos2φ1
The maximum tension per reinforcement = Tmax/n that should be less than the allowable value. The
anchorage length of reinforcement (Lip) at depth h1 can be obtained using the following equation. Static case:
(
h q)
FT
L i ss
ip + = 1 1 1 tan
2# " ! (52)
Where hi is the depth of first layer of reinforcement from top of the wall. Fss = factor of safety, 2.0.
Ti = Tmax/n, α = coefficient of interaction.
Dynamic case:
(
h q)
FT L i sd
ip + = 1 1 1 tan
2# " ! (53)
Where Fsd = factor of safety, 1.5.
The required length of the reinforcement = Lip + (H-h1) tanβ.
8. ESTIMATION OF WAVE FORCE
In the literature, analytical, experimental and numerical solutions (using finite difference codes) are available for estimating the hydrodynamic force on the wall due to tsunami waves (Cross 1967, Ramsden and Raichlen 1990, Ramsden 1996, Hamzah 2000). Ramsden (1996) gave empirical relationships (as shown below) for finding the hydrodynamic Force (F) and moment (M) on the vertical wall type barrier.
3 2 1 7160 1 5 . 58 1 347 . 0 325 . 1 ! " # $ % & + ! " # $ % & + ! " # $ % & + = h H h H h H F F (54)
The above equation is applicable for the range of values 0.62 ≤ H/h ≤ 30 and can be used to estimate the maximum force due to bore impact. F1 is the linear force scale (assuming hydrostatic
distribution for the wave run up equal to two times the wave height) which is used to normalize F. The value of F1 can be calculated as below.
(
)
21 2 2 1 w h H b
F = ! + (55)
hw is the water depth at the wall, γ is the unit weight of the water and b is the width of the wall.
3 2 808 1 21 . 8 1 454 . 0 923 . 1 " # $ % & + " # $ % & + " # $ % & + = h H h H h H M M t (56)
The moment Mt is calculated using the Eq. 57 after assuming hydrostatic pressure distribution for
the same assumption as R = 2H.
(
)
32 6 1 w t h H b
M = ! + (57)
9. DESIGN CALCULATIONS
For the east coast of India which is situated in the seismic zone III (IS: 1893-2000), the values of horizontal (αh) as well as vertical (αv) seismic coefficient is taken as 0.08 and 0.04. The unit
weight of the foundation soil and reinforced soil structure are taken as 20 and 22 kN/m3. The soil strength parameters cohesion (c) and angle of internal friction (φ) are taken as 0 and 25°
9.1 Depth of foundation
The depth of foundation (Df) can be obtained from the Rankine formula.
2
sin 1
sin 1
! " # $
% &
+ ' =
( ( )
p
Df (58)
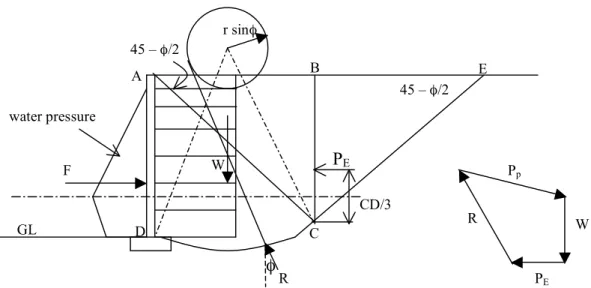
Table (1) shows the calculation of the forces and moment due to striking of tsunami wave of height 3.5 m. To ensure the external and internal stability of the wall from the backfill soil, the base width of the wall is calculated as shown in Table (2). From these calculations the height and base width of the wall is obtained as 9.15 m and 15.0 m. The soil reinforcement is provided at a spacing of 0.5 m c/c. The internal stability of the wall for tension failure is checked under static and dynamic condition as shown in table (3) and table (4) respectively. From the pull out failure criterion, the maximum tensions in the reinforcement under static and dynamic loading conditions are obtained as 20.5 and 24.52 kN respectively. To check the resistance of the backfill soil from the hydrodynamic forces from the front, the friction circle method [Fig (5)], is used to find the passive resistance of the backfill soil. It was obtained as 1354.21 kN which is approx. 2.0 times more than the hydrodynamic force. Hence the above calculations show that the wall will be safe for all the forces coming on it and the design is adequate.
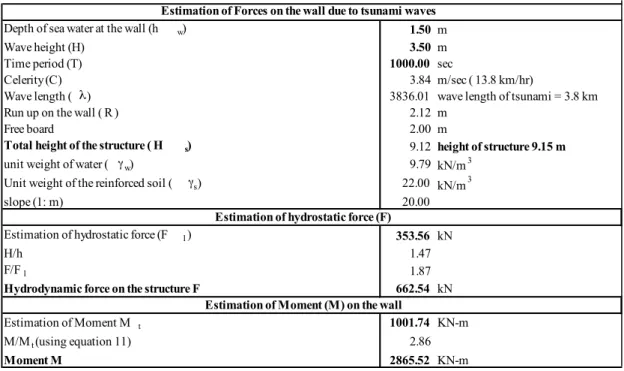
Table 1. Calculation of forces and moment at the wall due to tsunami waves
Science of Tsunami Hazards, Vol. 28, No. 3, page 199 (2009)
Depth of sea water at the wall (h w) 1.50 m
Wave height (H) 3.50 m
Time period (T) 1000.00 sec
Celerity (C) 3.84 m/sec ( 13.8 km/hr)
Wave length ( !) 3836.01 wave length of tsunami = 3.8 km
Run up on the wall ( R ) 2.12 m
Free board 2.00 m
Total height of the structure ( H s) 9.12 height of structure 9.15 m
unit weight of water ( "w) 9.79 kN/m3
Unit weight of the reinforced soil ( "s) 22.00 kN/m3
slope (1: m) 20.00
Estimation of hydrostatic force (F 1) 353.56 kN
H/h 1.47
F/F1 1.87
Hydrodynamic force on the structure F 662.54 kN
Estimation of Moment M t 1001.74 KN-m
M/Mt (using equation 11) 2.86
Moment M 2865.52 KN-m
Estimation of Forces on the wall due to tsunami waves
Estimation of hydrostatic force (F)
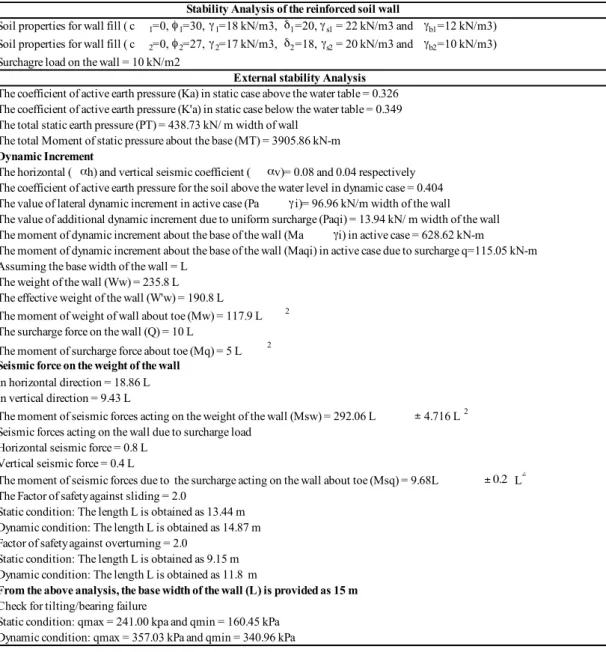
Soil properties for wall fill ( c 1=0,!1=30, "1=18 kN/m3, #1=20,"s1 = 22 kN/m3 and "b1=12 kN/m3) Soil properties for wall fill ( c 2=0,!2=27, "2=17 kN/m3, #2=18, "s2 = 20 kN/m3 and "b2=10 kN/m3) Surchagre load on the wall = 10 kN/m2
The coefficient of active earth pressure (Ka) in static case above the water table = 0.326 The coefficient of active earth pressure (K'a) in static case below the water table = 0.349 The total static earth pressure (PT) = 438.73 kN/ m width of wall
The total Moment of static pressure about the base (MT) = 3905.86 kN-m
Dynamic Increment
The horizontal ( $h) and vertical seismic coefficient ( $v)= 0.08 and 0.04 respectively The coefficient of active earth pressure for the soil above the water level in dynamic case = 0.404 The value of lateral dynamic increment in active case (Pa "i)= 96.96 kN/m width of the wall The value of additional dynamic increment due to uniform surcharge (Paqi) = 13.94 kN/ m width of the wall The moment of dynamic increment about the base of the wall (Ma "i) in active case = 628.62 kN-m
The moment of dynamic increment about the base of the wall (Maqi) in active case due to surcharge q=115.05 kN-m Assuming the base width of the wall = L
The weight of the wall (Ww) = 235.8 L The effective weight of the wall (W'w) = 190.8 L
The moment of weight of wall about toe (Mw) = 117.9 L 2 The surcharge force on the wall (Q) = 10 L
The moment of surcharge force about toe (Mq) = 5 L 2
Seismic force on the weight of the wall
In horizontal direction = 18.86 L In vertical direction = 9.43 L
The moment of seismic forces acting on the weight of the wall (Msw) = 292.06 L 4.716 L 2 Seismic forces acting on the wall due to surcharge load
Horizontal seismic force = 0.8 L Vertical seismic force = 0.4 L
The moment of seismic forces due to the surcharge acting on the wall about toe (Msq) = 9.68L 0.2 L 2 The Factor of safety against sliding = 2.0
Static condition: The length L is obtained as 13.44 m Dynamic condition: The length L is obtained as 14.87 m Factor of safety against overturning = 2.0
Static condition: The length L is obtained as 9.15 m Dynamic condition: The length L is obtained as 11.8 m
From the above analysis, the base width of the wall (L) is provided as 15 m
Check for tilting/bearing failure
Static condition: qmax = 241.00 kpa and qmin = 160.45 kPa Dynamic condition: qmax = 357.03 kPa and qmin = 340.96 kPa
Stability Analysis of the reinforced soil wall
External stability Analysis
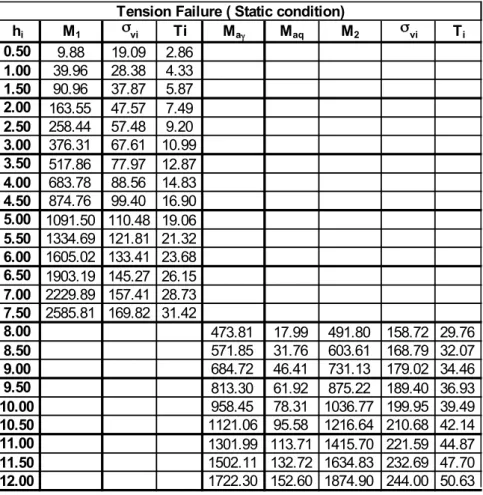
hi M1 !vi Ti Ma" Maq M2 !vi Ti 0.50 9.88 19.09 2.86
1.00 39.96 28.38 4.33 1.50 90.96 37.87 5.87 2.00 163.55 47.57 7.49 2.50 258.44 57.48 9.20 3.00 376.31 67.61 10.99 3.50 517.86 77.97 12.87 4.00 683.78 88.56 14.83 4.50 874.76 99.40 16.90 5.00 1091.50 110.48 19.06 5.50 1334.69 121.81 21.32 6.00 1605.02 133.41 23.68 6.50 1903.19 145.27 26.15 7.00 2229.89 157.41 28.73 7.50 2585.81 169.82 31.42
8.00 473.81 17.99 491.80 158.72 29.76 8.50 571.85 31.76 603.61 168.79 32.07 9.00 684.72 46.41 731.13 179.02 34.46 9.50 813.30 61.92 875.22 189.40 36.93 10.00 958.45 78.31 1036.77 199.95 39.49 10.50 1121.06 95.58 1216.64 210.68 42.14 11.00 1301.99 113.71 1415.70 221.59 44.87 11.50 1502.11 132.72 1634.83 232.69 47.70 12.00 1722.30 152.60 1874.90 244.00 50.63
Tension Failure ( Static condition)
hi M3 M4 MTni !vi + !vi - Ti + Ti - hi-(H-Hw) M5 M6 MTni !vi + !vi - Ti + Ti
-0.50 0.08 0.20 24.65 20.76 17.72 3.11 2.66 1.00 1.33 0.78 80.07 31.01 26.53 4.73 4.05 1.50 6.71 1.76 169.93 41.59 35.67 6.45 5.53 2.00 21.22 3.12 299.89 52.56 45.20 8.28 7.12 2.50 51.80 4.88 477.61 63.99 55.19 10.24 8.83 3.00 107.41 7.02 712.73 75.96 65.72 12.34 10.68 3.50 198.98 9.56 1016.89 88.60 76.92 14.62 12.69 4.00 339.46 12.48 1403.71 102.04 88.92 17.09 14.89 4.50 543.74 15.80 1888.80 116.41 101.85 19.79 17.31 5.00 828.75 19.50 2489.75 131.90 115.90 22.75 19.99 5.50 1213.37 23.60 3226.16 148.69 131.25 26.02 22.97 6.00 1718.50 28.08 4119.60 166.99 148.11 29.64 26.29 6.50 2366.99 32.96 5193.64 187.02 166.70 33.66 30.01 7.00 3183.73 38.22 6473.84 209.03 187.27 38.15 34.18 7.50 4195.55 43.88 7987.73 233.28 210.08 43.16 38.87
8.00 0.40 171.97 49.92 714.68 152.81 152.11 28.65 28.52 8.50 0.90 229.68 56.35 890.64 165.94 164.36 31.53 31.23 9.00 1.40 342.13 63.15 1137.41 179.75 177.29 34.60 34.13 9.50 1.90 540.86 70.33 1487.41 194.55 191.21 37.94 37.29 10.00 2.40 859.79 77.88 1975.43 210.68 206.45 41.61 40.77 10.50 2.90 1335.17 85.79 2638.59 228.48 223.38 45.70 44.68 11.00 3.40 2005.60 94.06 3516.35 248.35 242.36 50.29 49.08 11.50 3.90 2911.97 102.69 4650.49 270.68 263.81 55.49 54.08 12.00 4.40 4097.49 111.68 6085.08 295.89 288.14 61.40 59.79
Tension Failure ( seismic condition)
Table 3. Checking the internal stability of the reinforced wall in tension failure (Static condition)
Table 4. Checking the internal stability of the reinforced wall in tension failure (Dynamic condition)
r sinφ
φ F
R C B A
D 45 –φ/2
45 –φ/2 water pressure
GL
PE
CD/3 W
E
Pp
W
PE
R
Fig. 5. Friction circle method employed to obtain the passive resistance of the backfill
9.2 Toe Protection
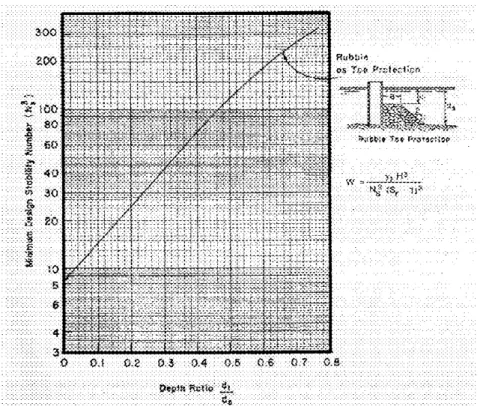
The toe of the structure should be protected from the scouring and undercutting due to passage of waves in order to make the structure stable. The extent of the toe scour depends on several factors like wave breaking (when occur at the toe), wave reflection and grain size distribution of the material. In the case of vertical sea wall structures, the toe material gives additional stability against overturning by providing passive resistance and therefore should be designed and maintained properly. It is suggested that the design of toe apron should be based on both geotechnical and hydraulic factors. From geotechnical point of view, the minimum width of the apron can be obtained using Rankine theory (USACE) and it should be more than the product of the height of the apron and Rankine passive earth pressure coefficient. From the hydraulic consideration, the width of the toe apron should be at least equal to the incident wave height. Fig (6) shows the arrangement for the toe protection. The total weight of the toe stone can be calculated using the following Eq. 59 (USACE).
(
)
33 3
1 =
t s
t
S N
H
W " (59)
Where Ns is the minimum design stability number obtained from the curve provided in Fig (6). γt
and St are the unit weight and specific gravity of the stone material. H is the design wave height
taken between H1 and H10.
Figure 6. Value of Ns, toe protection design for vertical walls (from Brebner and Donnelly 1962)
10. CONCLUDING REMARK
In the present study, a vertical reinforced retaining wall is proposed for protecting the sea shore area in the event like tsunami. The procedures are given to find the hydrodynamic force expected to act on the structure and to check the external stability of the structure from different modes of failure. The advantage of using reinforced earth retaining wall can be said in terms of the economy and the flexibility of the structure. Being flexible, it has the capability of absorbing some part of kinetic energy of the water waves coming on it but the quantification of the same could be an active area of research in this field.
11. REFERENCES
BAPPENAS (2005). Indonesia: Preliminary damage and loss assessment, the December 26 2004 natural disaster. A technical report prepared by BAPPENAS and the international donor
community. The article is available at the following web site:
http://www.crid.or.cr/digitalizacion/pdf/eng/doc16324/doc16324.htm
Cross, R.H. (1967). Tsunami surge forces. Journal of waterways and harbor division ASCE. 93(4), 201-231.
Cumberbatch, E. (1960). The impact of a water wedge on a wall. Journal of fluid mechanics. 7(3), 353-373.
Hamzah, M.A., Mase, H., and Takayama, T. (2000). Simulation and experiment of hydrodynamic pressure on a tsunami barrier. Coastal Engineering, 1501-1507.
Hoyt, J.W. And Sellin, R.H. (1989). Hydraulic jumps as a mixing layers. Journal of hydraulic engineering division, ASCE. 115(12), 1607-1614.
Kamel, A.M. (1970). Laboratory study for design of tsunami barrier. J. Waterway. Horbor and Coastal Engrg. Division. 96(WW4), 767-779.
Keller, H.B., Levine, D.A. and Whitham, G.B. (1960). Motion of a bore over a sloping beach. Journal of fluid mechanics. 7(2), 302-316.
Ramsden, J.D. (1996). Forces on a vertical wall due to long waves, bores, and dry-bed surges. Journal of waterway, port, coastal, and ocean engineering, ASCE. 122(3), 134-141
Ramsden, J.D. and Raichlen, F. (1990). Forces on vertical wall caused by incident bores. Journal of waterway, port, coastal, and ocean engineering, ASCE. 116(5), 592-613
Shen, M.C. and Meyer, R.E. (1963). Climb of a bore on a beach Part 3: Run-up. Journal of fluid mechanics,16(1), 113-125.
Titov, V.V. and Synolakis, C.E. (1995). Modeling of breaking and nonbreaking long-wave evolution and runup using VTCS-2. Journal of waterway, port, coastal, and ocean engineering, ASCE, 121(6), 308-316.
USACE (2002). Coastal Engineering Manual. Part I-V.
Whitham, G.B. (1958). On the propagation of shock waves through regions of non-uniform area of flow. Journal of fluid mechanics, 4(4), 337-360.