ACPD
8, 7111–7148, 2008OH from peroxy radicals
T. J. Dillon and J. N. Crowley
Title Page
Abstract Introduction
Conclusions References
Tables Figures
◭ ◮
◭ ◮
Back Close
Full Screen / Esc
Printer-friendly Version
Interactive Discussion
Atmos. Chem. Phys. Discuss., 8, 7111–7148, 2008 www.atmos-chem-phys-discuss.net/8/7111/2008/ © Author(s) 2008. This work is distributed under the Creative Commons Attribution 3.0 License.
Atmospheric Chemistry and Physics Discussions
Direct detection of OH formation in the
reactions of HO
2
with CH
3
C(O)O
2
and
other substituted peroxy radicals
T. J. Dillon and J. N. Crowley
Max-Planck-Institut f ¨ur Chemie (Otto-Hahn-Institut) Joh.-Joachim-Becher-Weg 27, 55128 Mainz, Germany
Received: 6 March 2008 – Accepted: 17 March 2008 – Published: 11 April 2008
Correspondence to: T. J. Dillon ([email protected])
Published by Copernicus Publications on behalf of the European Geosciences Union.
ACPD
8, 7111–7148, 2008OH from peroxy radicals
T. J. Dillon and J. N. Crowley
Title Page
Abstract Introduction
Conclusions References
Tables Figures
◭ ◮
◭ ◮
Back Close
Full Screen / Esc
Printer-friendly Version
Interactive Discussion Abstract
This work details the first direct observation of OH as a product from (R1): HO2+CH3C(O)O2→(products), which has generally been considered an atmospheric radical termination process. The technique of pulsed laser photolysis radical genera-tion, coupled to calibrated laser induced fluorescence detection was used to measure 5
an OH product yield for (R1) ofα1=(0.5±0.2). This study of (R1) included the mea-surement of a rate coefficient k1(298 K)=(1.4±0.5)×10−
11
cm3 molecule−1 s−1, sub-stantially reducing the uncertainties in modelling this important atmospheric reaction. OH was also detected as a product from the reactions of HO2with three other carbonyl-containing peroxy radicals, albeit at smaller yield, e.g. (R2): HO2+CH3C(O)CH2O2→ 10
(products), α2≈0.15. By contrast, OH was not observed (α<0.06) as a major
prod-uct from reactions where carbonyl functionality was absent, e.g. HO2+HOCH2CH2O2 (R8), and HO2+CH3CH(OH)CH2O2(R9).
1 Introduction
The hydroxyl radical, OH, is the primary oxidant in the Earth’s atmosphere, initiating 15
the degradation of common trace gases such as CH4, CO and the important
non-methane hydrocarbon (NMHC) isoprene (C5H8, 2-methyl-1,3-butadiene) (Atkinson and Arey, 2003). Key intermediates in the atmospheric oxidation of NMHC are the hydroper-oxyl radical, HO2, and organic peroxy radicals, RO2 (Lightfoot et al., 1993; Tyndall et al., 2001). The reactions between HO2 and RO2 have long been of interest to atmo-20
spheric scientists as they are important radical termination processes, inhibiting O3 and OH generation, and producing phytotoxic organic hydrogen peroxides, ROOH, and peracids, RC(O)OOH. Recent experimental and theoretical work has, however, suggested that the reactions of HO2with some substituted RO2, do not exclusively ter-minate radical chemistry. For the reaction (R1) of HO2with acetyl peroxyl, CH3C(O)O2, 25
ACPD
8, 7111–7148, 2008OH from peroxy radicals
T. J. Dillon and J. N. Crowley
Title Page
Abstract Introduction
Conclusions References
Tables Figures
◭ ◮
◭ ◮
Back Close
Full Screen / Esc
Printer-friendly Version
Interactive Discussion
al., 2004), in addition to the well-established radical terminating peracid (R1a) and O3 (R1b) products (Niki et al., 1985; Moortgat et al., 1989; Horie and Moortgat, 1992; Crawford et al., 1999; Tomas et al., 2001).
HO2+CH3C(O)O2→CH3C(O)O2H+O2 (R1a)
→CH3C(O)OH+O3 (R1b)
→OH+CH3C(O)O+O2 (R1c)
The OH or CH3C(O)O radical products (R1c) were not directly detected, but rather FTIR and HPLC end-product analysis (in particular of CH3OOH produced in a series of 5
reactions following CH3C(O)O decomposition) was used (Hasson et al., 2004) to derive an OH product yield,α1≡k1c/k1=(0.4±0.16). The authors noted that OH generation in (R1c) may have caused a serious (factor of≈2) underestimation in previous
determina-tions of the overall rate coefficient,k1. Depending on experimental conditions, the OH products could recycle HO2 and CH3C(O)O2, essentially leaving kinetic experiments 10
blind to (R1c).
Reaction (R1) was subsequently studied in two independent laboratories, both us-ing an OH scavenger (benzene) to trap any OH products. From the results of new real-time experiments, a re-analysis of previously published kinetic data, and a theo-retical treatment of (R1), Le Cr ˆane et al. assigned an upper-limit ofα1<0.1 (Le Crane 15
et al., 2006) and concluded that (R1) is, as previously thought, predominantly a radical termination process. By contrast, Jenkin and co-workers did obtain evidence for a sig-nificant propagation (R1c) channel from their FTIR end-product analysis (Jenkin et al., 2007). Based largely upon yields of phenol (produced from C6H6+OH in air) Jenkin et al. obtainedα1=(0.43±0.1), in excellent agreement with the results of Hasson et al. It 20
was suggested that Le Cr ˆane et al. had overestimated the stability of HOC6H6radicals (formed from C6H6+OH) used as the diagnostic for OH, and so underestimated the importance of channel (R1a). (Jenkin et al., 2007)
ACPD
8, 7111–7148, 2008OH from peroxy radicals
T. J. Dillon and J. N. Crowley
Title Page
Abstract Introduction
Conclusions References
Tables Figures
◭ ◮
◭ ◮
Back Close
Full Screen / Esc
Printer-friendly Version
Interactive Discussion
Note that none of these three studies (Hasson et al., 2004; Le Crane et al., 2006; Jenkin et al., 2007) could directly detect OH as product from (R1). Clearly there remain large uncertainties in bothα1and k1. The principal aim of the work presented in this manuscript was therefore to unambiguously identify any OH produced in (R1), and so to reduce uncertainties in the two important atmospheric parametersα1andk1. 5
There are indications in the literature that other naturally occurring, substituted RO2 may react with HO2 to produce significant OH products. A largeα2=(0.69±0.2) was
reported for the reaction (R2) of HO2 with acetonyl peroxy, CH3C(O)CH2O2 (Hasson et al., 2004):
HO2+CH3C(O)CH2O2→CH3C(O)CH2O2H+O2 (R2a)
→OH+CH3C(O)CH2O+O2 (R2b)
By contrast, no evidence for OH production was obtained from the reaction of HO2 10
with the non-substituted C2H5O2 radical. In a subsequent quantum chemical/master equation study, it was demonstrated that hydrogen bonding to the carbonyl group of CH3C(O)O2 or CH3C(O)CH2O2 stabilises the hydrotetroxide intermediates that can lead to OH formation (Hasson et al., 2005). These findings led to speculation that structurally similar RO2may react with HO2to produce OH. At that time the only other 15
results to support this contention was a large OH yieldα=(0.76±0.04) from the reaction
of HO2 with CF3CF2C(O)O2 (Andersen et al., 2003). Intriguingly, Hasson et al. also suggested that the necessary H-bonding stabilisation could be provided by RO2 with hydroxyl functionality. This theoretical suggestion has found some support in the exper-imental observations of Jenkin et al. (2007) who reported a value ofα3=(0.20±0.05) 20
from the reaction (R3) of HO2with the simplest hydroxy peroxy radical, HOCH2O2:
HO2+HOCH2O2→HOCH2O2H+O2 (R3a)
ACPD
8, 7111–7148, 2008OH from peroxy radicals
T. J. Dillon and J. N. Crowley
Title Page
Abstract Introduction
Conclusions References
Tables Figures
◭ ◮
◭ ◮
Back Close
Full Screen / Esc
Printer-friendly Version
Interactive Discussion
→OH+HOCH2O+O2 (R3c)
Whilst (R1–R3) are atmospherically interesting and worthy of study in their own right, a host of more complex, substituted (carbonyl and/or hydroxyl containing) RO2are pro-duced in the atmospheric oxidation of isoprene and other NMHC (Atkinson and Arey, 2003). If significant OH yields were found to be a general feature of HO2+substituted RO2reactions, such chemistry would serious impact upon our understanding of atmo-5
spheric oxidation. The impact would be particularly large in remote regions, where low anthropogenic activity limits NOx levels and suppresses radical propagation via (R4) and (R5):
HO2+NO→OH+NO2 (R4)
RO2+NO→RO+NO2 (R5)
10
For example, models predict small [OH] in air over tropical forests, due to rapid losses in reaction with isoprene (R6) and other NMHC, and the lack of verified mechanisms for OH regeneration from the hydroxy-RO2produced in (R7).
OH+C5H8→HOC5H8 (R6)
HOC5H8+O2→HOC5H8O2 (R7)
15
In a recent Max-Planck-Institute field campaign (GABRIEL), OH was for the first time directly monitored over the Amazonian rainforest. The results (see elsewhere in this issue) clearly demonstrate that large [OH]≈1×10⁷ molecule cm−3 were maintained,
despite a large (∼1 ppb) isoprene loading in otherwise clean air (NO∼15 ppt). The
largest discrepancies (up to a factor of 10) between measured and modelled [OH] were 20
observed when isoprene mixing ratios were highest, indicating that our understanding of the (low NOx) isoprene degradation mechanism is incomplete.
Accordingly, in this work the reactions of HO2with a variety of substituted RO2were studied, and any OH formed unambiguously identified by a direct OH detection tech-nique. Careful calibration of the experiment allowed the determination of OH product 25
ACPD
8, 7111–7148, 2008OH from peroxy radicals
T. J. Dillon and J. N. Crowley
Title Page
Abstract Introduction
Conclusions References
Tables Figures
◭ ◮
◭ ◮
Back Close
Full Screen / Esc
Printer-friendly Version
Interactive Discussion
yields (α) for the reactions of HO2with a variety of carbonyl-containing RO2, including (R1) and (R2). For experimental reasons (see Sect. 3.4) it was not possible to investi-gate the RO2produced directly from isoprene (R6–R7), however, the reactions of HO2 with several hydroxy-containing RO2 were studied, notably (R8) with HOCH2CH2O2: and (R9) with CH3CH(OH)CH2O2.
5
HO2+HOCH2CH2O2→(products) (R8)
HO2+CH3CH(OH)CH2O2→(products) (R9)
2 Experimental
The experiments detailed in this work used Pulsed Laser Photolysis (PLP) generation of HO2and RO2, coupled to direct, real-time observation of the product OH molecules 10
by pulsed Laser Induced Fluorescence (LIF). Experiments were carried out “back-to-back” with chemical calibrations of the LIF system (see Sect. 2.4), which allowed conversion of fluorescence intensities into absolute [OH], and thus calculation of OH product yields (α).
2.1 The PLP-LIF technique
15
The PLP-LIF set-up used in these experiments has recently been used to study a number of OH reactions (Dillon et al., 2005; Dillon et al., 2006a; Dillon et al., 2007; Karunanandan et al., 2007). A detailed description including a schematic diagram of the apparatus was presented previously (Wollenhaupt et al., 2000), so only a brief de-scription is given here. Experiments were conducted in a jacketed quartz reaction cell 20
of volume≈500 cm3. Temperature in the cell was regulated by circulating a cryogenic
ACPD
8, 7111–7148, 2008OH from peroxy radicals
T. J. Dillon and J. N. Crowley
Title Page
Abstract Introduction
Conclusions References
Tables Figures
◭ ◮
◭ ◮
Back Close
Full Screen / Esc
Printer-friendly Version
Interactive Discussion
mass flow controllers, were between 1000 and 2000 cm3(STP) min1. The resulting lin-ear gas velocities in the reaction cell ensured that a fresh gas sample was available for photolysis at each laser pulse (repetition rate 10 Hz), and so prevented a build up of products.
HO2and RO2radicals were generated from suitable precursors (see Sect. 2.3 below) 5
by the≈20 ns pulse of an exciplex laser (Lambda Physik, Lextra) operating at 351 nm
(XeF). Fluorescence from OH product molecules was excited using the output from a Nd-YAG (Quantel) pumped dye laser (Lambda-Physik, using Rhodamine 6G dye), and detected by a photomultiplier tube shielded by 309 nm (interference) and BG 26 (glass cut-off) filters. Laser excitation spectra of OH (not displayed) with transitions consistent 10
with other recently measured and calculated spectra were used to unambiguously iden-tify OH. All quantitative experiments were conducted at a laser excitation wavelength of
λ=281.997 nm, corresponding to theQ1(1) line in OHA 2
Σ(v=1)←X2Π(v=0). Efficient
quenching of the OH fluorescence by the bath gas (air) limited LIF sensitivity, which was measured (see section 2.4) as [OH]≈5×10⁹molecule cm−3 for signal:noise=1:1,
15
averaging 10 laser pulses atP=200 mBar.
2.2 Reagent handling and concentration measurements
Liquid samples of the following organic reagents were subject to repeated T=77 K freeze-pump-thaw cycles prior to dilution in N2 and storage in blackened glass bulbs: CH3OH and C2H5OH (both Merck, 99.9%); CH3CHO, CH3C(O)CH3,(CH3)2CHOH and 20
C2H5C(O)CH3(all Aldrich, 99.5%); C6H5CHO and (CH3)2CHCH2CH2OH (both Merck, 99%); and isoprene (Aldrich, 99%). NO (Linde) was distilled by repeatedly removing the light boiling fractions atT=77 K, and discarding the frozen residue as the sample was allowed to warm slowly. N2and O2(Messer 5.0), and Cl2(Linde, 2.00% Cl24.0 in He) were used as supplied.
25
All reagent concentrations were determined by manometric methods to an estimated accuracy of ±15%, based upon uncertainties in cylinder/bulb partial-pressures,
ACPD
8, 7111–7148, 2008OH from peroxy radicals
T. J. Dillon and J. N. Crowley
Title Page
Abstract Introduction
Conclusions References
Tables Figures
◭ ◮
◭ ◮
Back Close
Full Screen / Esc
Printer-friendly Version
Interactive Discussion
ibrated mass flow rates, and absolute measurements of T and P. Where possible,
online optical determinations of reagent concentration were used as an independent check on the manometric measurements. The simplest optical measurements moni-tored the absorption atλ=184.9 nm in a 43.8 cm long cell, situated downstream of the reaction cell. Briefly, the 184.9 nm line from a low-pressure Hg-lamp was isolated using 5
an interference filter (185 nm, FWHM 10 nm, Oriel), passed through the gas mixture, and the transmitted intensity,I, recorded on a photodiode. A beam splitter allowed the simultaneous recording (on a reference photodiode) of incident light intensity,I0. Liter-ature values (in 10−19cm2molecule−1) ofσX=6.65 and 11.8 (Dillon et al., 2005), 22.0
(Salahub and Sandorfy, 1971), and 30.1 (Gierczak et al., 2003) were used to determine 10
concentrations for respectivelyX=CH3OH, C2H5OH, (CH3)2CHOH and CH3C(O)CH3 via the Beer-Lambert relationship, Eq. (1).
I=I0exp (−σX ·[X]·l) (1)
These optical measurements were found to agree (±10%) with the manometric
cal-culations, and thus verifying the consistency of mass flow controller calibrations etc. 15
A crucial parameter in all experiments was the concentration of the radical precursor Cl2, which was measured by recording attenuation of (220<λ/nm<380 nm) light from a deuterium-lamp in a 30.0 cm cell, inserted serially upstream of the reaction cell. A 0.5 m monochromator (B&M Spektronik BM50, grating 300 lines blazed at 300 nm) collected the light and directed it onto a diode array detector (Oriel INSTAspec 2). 20
Evaluated literature (Atkinson et al., 2007) cross-sections (e.g. σCl2=2.55×10− 19
ACPD
8, 7111–7148, 2008OH from peroxy radicals
T. J. Dillon and J. N. Crowley
Title Page
Abstract Introduction
Conclusions References
Tables Figures
◭ ◮
◭ ◮
Back Close
Full Screen / Esc
Printer-friendly Version
Interactive Discussion
2.3 Generation of HO2and RO2
PLP of Cl2 (R10) was used to initiate radical chemistry, generating Cl-atoms for con-version into both HO2and RO2.
Cl2+hν(351 nm)→2Cl (R10)
Laser fluences of around 8 mJ cm−2 per pulse were used to generate an initial con-5
centration of chlorine atoms, [Cl]0≈5×10¹³molecule cm−3, calculated using a modified
version Eq. (2) of the Beer-Lambert law:
[Cl]0=2I0−I
l whereI=I0exp (−σ·[Cl2]·l) (2)
where the evaluated literature cross-section of Cl2(σ=1.9×10⁻¹⁹cm2at the
photol-ysis wavelengthλ=351 nm; Atkinson et al., 2007) and photolysis cell length (l=32 cm) 10
were well-characterised. Under the optically thin conditions prevalent in these experi-ments, the incident light intensityI0 (in photons cm−2) was obtained from the incident
laser fluence, measured using a joulemeter situated behind the photolysis cell. Correc-tions (20%) were made for the excimer beam divergence, and attenuation by the exit window. The joulemeter itself had been calibrated in previous work (Dillon et al., 2006b; 15
Dillon et al., 2008). The errors in calculating [Cl]0 by this method were estimated as
±10% (precision) with an additional±30% (systematic error/accuracy) associated with
imperfections in the photolysis beam profile, and overlap with the probe laser. The presence of large excess CH3OH (see below) and O2(from the bath gasP >100 mBar of air) allowed the rapid conversion (τ<5µs) of Cl to HO2, and ensured that secondary 20
radical chemistry from (R13) and (R14, α14=0.21) (Atkinson et al., 2007) was min-imised:
Cl+CH3OH→CH2OH+HCl (R11)
CH2OH+O2→HO2+HCHO (R12)
ACPD
8, 7111–7148, 2008OH from peroxy radicals
T. J. Dillon and J. N. Crowley
Title Page
Abstract Introduction
Conclusions References
Tables Figures
◭ ◮
◭ ◮
Back Close
Full Screen / Esc
Printer-friendly Version
Interactive Discussion
CH2OH+Cl2→ClCH2OH+Cl (R13)
Cl+HO2→HCl+O2 (R14a)
→ClO+OH (R14b)
A small proportion of the Cl-atoms formed in (R10) were sequestered for peroxy radical production. In the study of (R1) for example, CH3C(O)O2was generated by the addition of acetaldehyde, CH3CHO, to the Cl2/CH3OH/air mixture:
Cl+CH3CHO→CH3CO+HCl (R15)
5
CH3CO+O2+M→CH3C(O)O2+M (R16a)
CH3CO+O2→OH+(other products) (R16b)
CH3CO+Cl2→CH3C(O)Cl+Cl (R17)
Typical concentrations (in units of 1014 molecule cm−3
) of [Cl2]=80 to 100, [CH3OH]=40 to 180 and [CH3CHO]=2 to 12 were chosen such that Cl was converted to CH3C(O)O2 and HO2 within 2µs. The amount of CH3C(O)O2 present in each ex-periment was controlled by the (well-characterised) relative rates of (R11) and (R15), 10
and for the purposes of experimental planning/design could be estimated from Eq. (3):
CH3C(O)O2
≈[Cl]0
k15
CH3CHO
·(1−α16)
k15
CH3CHO
+k11
CH3OH (3)
where the term (1-α16) is close to unity in these experiments as OH
produc-tion in (R16b) is efficient only at low pressures (α16<0.1 at all experimental
P >100 mBar used here (Carr et al., 2007)). In practice the majority (>80%) of
ACPD
8, 7111–7148, 2008OH from peroxy radicals
T. J. Dillon and J. N. Crowley
Title Page
Abstract Introduction
Conclusions References
Tables Figures
◭ ◮
◭ ◮
Back Close
Full Screen / Esc
Printer-friendly Version
Interactive Discussion
the Cl produced in (R10) was used to generate HO2. The resulting conditions of [HO2]>[RO2], together with the slow and radical-terminating self-reaction (R18) of HO2 (k18<3×10−
12
cm3molecule−1 s−1 at all experimental P <1 Bar used here) simplified data analysis and minimised unwanted radical generation in the fast, radical propagat-ing (R19) (k19=1.6×10⁻¹¹cm3molecule−1s−1; Atkinson et al., 2007).
5
HO2+HO2(+M)→H2O2+O2(+M) (R18)
CH3C(O)O2+CH3C(O)O2→2CH3C(O)O+O2 (R19)
2.4 Calibration of the OH LIF detection system
LIF is a direct, but non-absolute technique, which meant that the detection system required calibration prior to conversion of OH fluorescence signals into absolute con-10
centrations. A suitable calibration reaction was (R4), (HO2+NO), as the yield of OH is known to be close to unity (α4=0.984), and conveniently the rate coefficient (k4=8.9×10−
12
cm3molecule−1 s−1
; Atkinson et al., 2007) is similar to the rate coeffi -cients for a number of HO2+RO2 reactions (e.g. k1=1.4×10−
11
cm3 molecule−1 s−1). Accordingly, small flows of NO were added to the Cl2/CH3OH/air photolysis mixture to 15
generate well-characterised amounts of OH in conditions ofP, [Cl2], [CH3OH], etc. as close as possible to those in the experiments to investigate (R1), i.e. with [HO2]>[NO] (≈[CH3C(O)O2]).
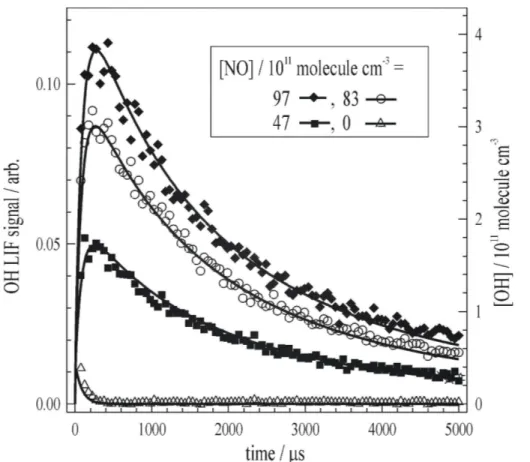
Figure 1 displays the results of a series of calibration experiments, where three dif-ferent measured [NO] (97, 83 and 47×1011molecule cm−3) were converted (R4) to OH
20
by an excess [HO2]=6.4×10 13
molecule cm−3. Calibration was achieved via numerical simulation of the data using the FACSIMILE program (Curtis and Sweetenham, 1987). Experimentally determined values of P, [Cl2], [CH3OH], [NO] and the laser fluence were used to initiate simulations, from which output values of [OH] were generated us-ing the list of reactions and literature rate coefficients given in Appendix A. The relative 25
position of the (arbitrary) LIF to the (absolute) [OH] y-axes was determined by scaling
ACPD
8, 7111–7148, 2008OH from peroxy radicals
T. J. Dillon and J. N. Crowley
Title Page
Abstract Introduction
Conclusions References
Tables Figures
◭ ◮
◭ ◮
Back Close
Full Screen / Esc
Printer-friendly Version
Interactive Discussion
the OH LIF signals to their corresponding simulations. Calibration experiments were conducted prior to, between and after experiments to investigate (R1). The duration of a typical series of three calibrations interrupted by two experiments to determineα1, was about 40 min, in which time fluctuations in LIF sensitivity were rarely significant.
The shapes of the OH profiles presented in Fig. 1 are initially counter-intuitive. Whilst 5
OH is generated on the millisecond timescale of (R4), rapid loss processes, dominated by reactions (R20–21) with CH3OH and HO2, prevent [OH] from reaching its theoretical maximum value, which is equivalent to the parent [NO].
OH+CH3OH→H2O+CH2OH (R20)
OH+HO2→H2O+O2 (R21)
10
For example, in Fig. 1 the open circle datapoints correspond to OH formed (R4) from [NO]=8.3×10¹²molecule cm−3at an approximate first-order ratek4[HO2]≈500 s−
1 . OH is efficiently removed (k20[CH3OH]+k21[HO2]≈10 000 s−
1
) before (R4) is complete, lim-iting the observed [OH] to a maximum value of≈3×10¹¹molecule cm−3. Note that all
simulations adequately reproduced the shape of the OH decay profiles, which was 15
controlled by the slower first-order rate of (R4),k4[HO2]. Sincek4 itself is well-known (Atkinson et al., 2007), it follows that calibration experiments such as those presented in Fig. 1 provide an independent validation of the values of [HO2]≈[Cl]–[CH3C(O)O2] calculated from Eqs. (2–3).
Potential systematic errors in the calibration process included interference from other 20
fluorescing species, unwanted secondary OH production, and uncertainties in both (experimentally determined) reagent concentrations and the (literature) photochemical parameters used to simulate [OH]t. Accordingly, experiments were conducted in which the probe laser was tuned away from the OH line (to λ=282.01 nm), whereupon no fluorescence was detected, indicating that OH and only OH contributed to the calibra-25
ACPD
8, 7111–7148, 2008OH from peroxy radicals
T. J. Dillon and J. N. Crowley
Title Page
Abstract Introduction
Conclusions References
Tables Figures
◭ ◮
◭ ◮
Back Close
Full Screen / Esc
Printer-friendly Version
Interactive Discussion
from the data recorded in the absence of NO (see Fig. 1, open triangle datapoints), LIF signals from (R14b) were small, and were removed within 300µs (i.e. occurred on a completely different timescale to R4), and were anyway adequately accounted for in the simulations. As a result we consider the overall accuracy of the calibrations to be limited by uncertainties in reactant concentrations, particularly of NO (±15%), and the
5
evaluated error in the most important rate parameterk4, (±26%; Atkinson et al., 2007) which when combined (in a squared sum) give an estimate for the overall uncertainty of±30% for the calibration process.
3 Results and discussion
The experiments detailed in this work were conducted under conditions of 10
[HO2]>[RO2]≈[NO], and as a result unwanted secondary radical generation was min-imised. Nonetheless, the reaction mixtures were chemically quite complex, containing several radical species, including more than one potential source of OH. Analysis by conventional least-squares fitting techniques was therefore not applicable, and all re-sults were obtained following numerical simulation of the data using the FACSIMILE 15
program (Curtis and Sweetenham, 1987). Typically, experimental values of the laser fluence, P, [Cl2], [CH3OH], and concentration of RO2 precursor e.g. [CH3CHO] were used to initiate the simulations. Output values oft, [Cl], [HO2], [RO2], and [OH] were generated using the list of reactions and literature rate coefficients given in Appendix A.
20
3.1 HO2+CH3C(O)O2→OH+other products, (R1)
3.1.1 Determination of OH yieldα1
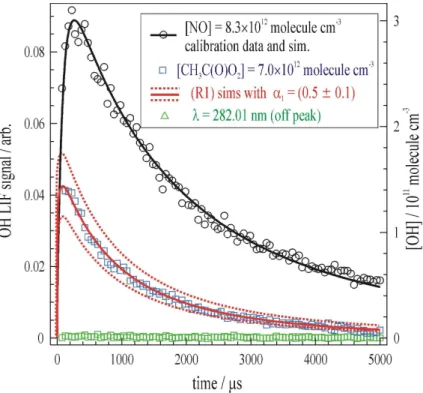
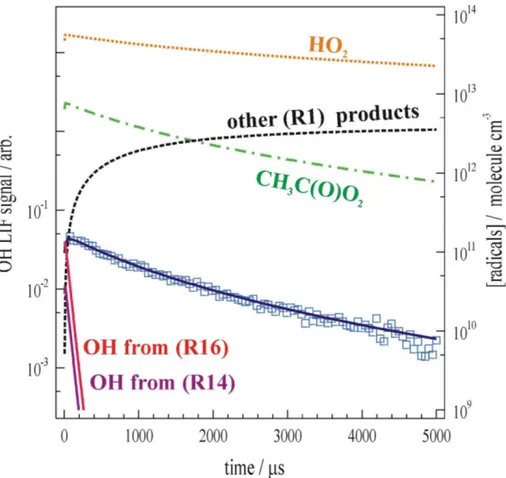
Figure 2 displays the results of a typical experiment, conducted at T=298 K and
P=229 mBar, to determine the yieldα1of OH, formed in HO2+CH3C(O)O2 (R1). The
ACPD
8, 7111–7148, 2008OH from peroxy radicals
T. J. Dillon and J. N. Crowley
Title Page
Abstract Introduction
Conclusions References
Tables Figures
◭ ◮
◭ ◮
Back Close
Full Screen / Esc
Printer-friendly Version
Interactive Discussion
LIF signals were calibrated as described in Sect. 2.4. For clarity, only one calibra-tion dataset (open black circles in Fig. 2 [NO]=8.3×10¹²molecule cm−3) is displayed
here. The blue square datapoints show the LIF signal recorded following generation of [CH3C(O)O2]=7.0×10¹²molecule cm−3 in the presence of [HO2]=5.4×10
13
molecule cm−3. The LIF signal is of a comparable size to (factor of ≈2 smaller) and decays on
5
a similar timescale to the calibration signal. In experiments where the probe laser was tuned away from the OH line (e.g. green triangle datapoints in Fig. 2 where
λ=282.01 nm), no fluorescence was detected. These observations indicate that OH is indeed formed at significant yield from (R1).
More quantitative results were obtained by numerical simulation of the experiment. 10
The solid red line that passes though the datapoints on Fig. 2 indicates the result of simulating the [CH3C(O)O2]=7.0×10
12
molecule cm−3 (blue squares) experiment using α1=0.5 and the recommended literature rate coefficient of k1=1.4×10⁻¹¹cm3
molecule−1 s−1 (Atkinson et al., 2007). The simulation reproduced the experiment well, and was particularly sensitive to α1, as is demonstrated in Fig. 2 where simu-15
lations (red dotted-lines) using α1=0.4 and α1=0.6 are also displayed. The overall accuracy of our determination of α1 was however governed by systematic uncertain-ties associated with the LIF calibration, and parameters used in the simulations. Errors associated with secondary radical production, including other known sources of OH, were assessed, but found to be insignificant. Figure 3 displays the full output of the 20
same simulation, including profiles of [HO2], [CH3C(O)O2], [OH] and other products of (R1), on logarithmic scale. The simulation shows that a large excess of HO2 was maintained throughout the experiment, ensuring that (R1) was the principal fate for CH3C(O)O2. Both (R14b) (Cl+HO2) and (R16b) (CH3CO+O2) were known to be mi-nor secondary sources of OH in these experiments. Nonetheless, as was shown by the 25
ACPD
8, 7111–7148, 2008OH from peroxy radicals
T. J. Dillon and J. N. Crowley
Title Page
Abstract Introduction
Conclusions References
Tables Figures
◭ ◮
◭ ◮
Back Close
Full Screen / Esc
Printer-friendly Version
Interactive Discussion
the overall [OH] observed was negligible after about 100µs.
Table 1 lists the conditions and results of all experiments to study (R1). A set of experiments (corresponding to one row in Table 1) generally consisted of determi-nations of α1 from two or more different [CH3C(O)O2], generated by changing the parent CH3CHO concentration. Conditions of P,T and reagent concentrations were 5
otherwise unchanged. Note that values of [HO2] were not listed explicitly as these changed slightly from the calibration (where [HO2] ≈[Cl]0) to the (R1) experiments (where [HO2]≈[Cl]0–[CH3C(O)O2]). New calibration data was required for experiments conducted at different P, as the LIF detection sensitivity was strongly influenced by fluorescence quenching by the bath gas (air). There was no systematic change in 10
theα1≈0.5 required to simulate experimental observations, which were obtained over
a range pressures (100–705 mBar) and at around ambient T. The range of
precur-sor concentrations was necessarily limited so as to minimise secondary chemistry e.g. in (R13–14), (R16b–17) and (R18–R19), whilst maintaining a suitable millisec-ond timescale for (R1). The uncertainties inα1 quoted in Table 1 refer to the internal 15
consistency of the calibration andα1data (i.e. data from Fig. 2 listed asα1=(0.5±0.05) as we can distinguish it fromα1=0.4 or 0.6).
A weighted average (using these precision-only errors) of the data in Table 1 gives
α1=(0.52±0.02). A more realistic assessment of the overall uncertainty inα1 was ob-tained by combining this statistical error with the LIF calibration uncertainty (±30%, see
20
Sect. 2.4), and errors associated with the simulations of (R1). Note that since these experiments were conducted back-to-back with the LIF calibrations, errors associated with a number of important parameters (e.g. [HO2], OH lifetime, P, T) cancelled-out, and could be neglected when assessing the overall uncertainty inα1. Sensitivity analy-sis identified the remaining critical parameters as those controlling the concentration of 25
parent radicals, [CH3C(O)O2], and the rate coefficient for conversion to OH,k1. Uncer-tainties in: laser fluence (±20%); [Cl2] (±10%); relative [CH3CHO] to [CH3OH] (±10%); rate coefficientsk15 andk12(relative rate measured both relative to C2H6and C2H4to about±5%; Tyndall et al., 1999) were therefore combined to give an overall estimate
ACPD
8, 7111–7148, 2008OH from peroxy radicals
T. J. Dillon and J. N. Crowley
Title Page
Abstract Introduction
Conclusions References
Tables Figures
◭ ◮
◭ ◮
Back Close
Full Screen / Esc
Printer-friendly Version
Interactive Discussion
of±25% in [CH3C(O)O2]. This value was combined with an effective uncertainty ink1 (±15%, see Sec. 3.1.2 below) and that of the LIF calibration process (±30%), to obtain
an overall estimated accuracy of 40%, orα1=(0.5±0.2).
3.1.2 Determination of the rate coefficient k1, and uncertainties therein
All values of α1 listed in Table 1 were obtained from simulations using the evaluated 5
literature rate coefficientk1(298 K)=1.4×10− 11
cm3 molecule−1 s−1
, which was based upon the results of two laboratory studies (Moortgat et al., 1989; Tomas et al., 2001). A large uncertainty of approximately a factor of two is quoted (Atkinson et al., 2007) to account for possible systematic errors. LIF detection of OH, used to monitor (R1) in this work, allowed for a more precise value ofk1(298 K) to be determined, as many 10
of the problems associated with earlier studies were avoided. Firstly, LIF is a more selective technique than the monitoring of overlapping UV absorptions from HO2 and CH3C(O)O2, used in the earlier kinetic studies (Moortgat et al., 1989; Tomas et al., 2001). Second, LIF is also more sensitive than conventional absorption techniques, allowing smaller radical concentrations to be used. As a result, the experiments could 15
be conducted under kinetic conditions which minimised unwanted radical losses (see below).
With reference to Fig. 3, retrieval of k1 was aided by having one reagent (HO2, orange dotted line) in large excess over the course of the experiment. As a result the kinetic profile was (to a first approximation) governed by [HO2] andk1. OH has a very 20
different time profile to the other products of (R1), and in effect acts as a “spectroscopic marker” for its parent radical CH3C(O)O2 (green dot-dashed line). Simulations which used k1 values at the upper or lower limits of the recommendation (2.8×10−
11 and 7×10⁻¹²cm3molecule−1s−1) were not consistent with any data recorded in this work.
Simulations using (1.1<k1<1.7)×10− 11
cm3molecule−1s−1were able to reproduce the 25
ACPD
8, 7111–7148, 2008OH from peroxy radicals
T. J. Dillon and J. N. Crowley
Title Page
Abstract Introduction
Conclusions References
Tables Figures
◭ ◮
◭ ◮
Back Close
Full Screen / Esc
Printer-friendly Version
Interactive Discussion
present in the back-to-back calibrations (R4) experiments.
Secondary radical processes, which occurred in the earlier studies (Moortgat et al., 1989; Tomas et al., 2001), were of little consequence here. Sensitivity anal-ysis demonstrated that the CH3C(O)O2 self-reaction (R19) accounted for less than 12% of the CH3C(O)O2 loss rate under all conditions. Inclusion of the equilib-5
rium process (R22) had no discernable impact on the simulations as relatively small [CH3CHO]<1×10
15
molecule cm−3were used in this work.
HO2+CH3CHO↔CH3C(OH)O2 (R22)
That OH was not then recognised as a significant product of (R1) introduces the largest uncertainty into earlierk1 determinations (Atkinson et al., 2007). Recycling of 10
reactants via the reactions of OH with CH3OH (R20) and CH3CHO (R23), was not accounted for in previous analyses (Moortgat et al., 1989; Tomas et al., 2001), as no production of OH in (R1) was anticipated.
OH+CH3CHO→CH3CO+H2O (R23)
In this work regeneration of HO2was of no consequence, as this reagent was in ex-15
cess, whilst regeneration of CH3CO in (R23) was kept to a minimum (in all experiments
<20%) by the use of small [CH3CHO].
We conclude that, whilst these experiments were designed primarily to determine
α1, the high selectivity and sensitivity of the OH LIF detection technique has allowed the uncertainties in k1(298 K) to be reduced. The principal source of error in these 20
determinations was the ±30% uncertainty in [HO2], which when added to statistical errors results in an absolute value ofk1(298 K)=(1.4±0.5)×10−
11
cm3molecule−1s−1. We note that uncertainties in this parameter could be further reduced if the excess reagent HO2was monitored, in addition to OH.
ACPD
8, 7111–7148, 2008OH from peroxy radicals
T. J. Dillon and J. N. Crowley
Title Page
Abstract Introduction
Conclusions References
Tables Figures
◭ ◮
◭ ◮
Back Close
Full Screen / Esc
Printer-friendly Version
Interactive Discussion
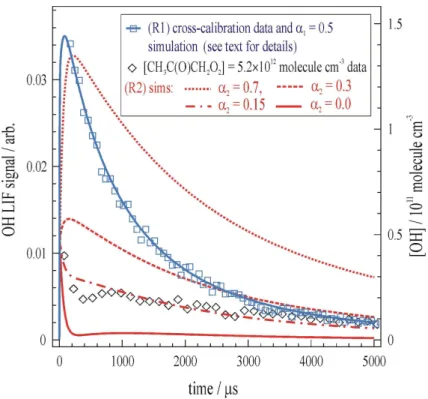
3.2 HO2+CH3C(O)CH2O2→products (R2)
Photolysis (R10) of Cl2in the presence of acetone, CH3C(O)CH3, was used to generate acetonyl peroxy radicals for the investigation of (R2) (HO2+CH3C(O)CH2O2).
Cl+CH3C(O)CH3→CH3C(O)CH2+HCl (R24)
CH3C(O)CH2+O2+M→CH3C(O)CH2O2+M (R25)
5
Similar methods to those detailed above were used to simultaneously generate an excess of HO2 (R11–12), see Sect. 2.3, and to calibrate the OH LIF signals (see Sect. 2.4). The black diamonds datapoints in Fig. 4 represent the [OH]t obtained
at P=230 mBar from [CH3C(O)CH2O2]=5.2×10 12
molecule cm−3 in the presence of [HO2]=5.8×10¹³molecule cm−3. It was apparent from this and similar datasets (see
10
Table 2 for details) that the yield of OH from (R2) was considerably smaller than the only literature value (Hasson et al., 2004) ofα2=(0.67±0.20). Numerical simulation of the data using the list of reactions in Appendix A, andα2=0.7 generated [OH]t profiles (e.g. red-dotted line in Fig. 4) that grossly overestimated every experimental observa-tion. A significantα2>0 was nonetheless required to adequately simulate the data, with 15
α2≈0.15 (e.g. the dot-dashed line in Fig. 4) giving best results.
Such a large discrepancy between the results of this work, and those obtained by Hasson et al. was a source of concern. As a check on the reliability and reproducibility of the PLP/calibrated-LIF method used in this work, back-to-back experiments were conducted where CH3C(O)CH3 was replaced by a kinetically equivalent amount of 20
CH3CHO (i.e.k15[CH3CHO]≈k24[CH3C(O)CH3]). The OH produced in (R2) and (R1) could then be compared directly. Such relative yield experiments do not rely exclusively upon LIF calibration in (R4), and as such were useful as a double-check on laser alignment etc. The blue square datapoints in Fig. 4 display the resulting OH profile from (R1), which indicates thatα1ggα2, again in contrast to the literature results (Hasson et 25
ACPD
8, 7111–7148, 2008OH from peroxy radicals
T. J. Dillon and J. N. Crowley
Title Page
Abstract Introduction
Conclusions References
Tables Figures
◭ ◮
◭ ◮
Back Close
Full Screen / Esc
Printer-friendly Version
Interactive Discussion
One difference between the (R2) and (R1) experiments was the use of
consid-erably larger [CH3C(O)CH3] (∼10 16
molecule cm−3, see Table 2) than [CH3CHO] (<1015molecule cm−3) to generate similar concentrations of RO2. This was an un-avoidable result of differences in reactivity towards Cl (in 10−12 cm3 molecule−1 s−1:k24=2.1 whereas k15=80). Changes in LIF sensitivity due to physical quench-5
ing were not anticipated, as in these experiments O2 (20% of the bath gas), was al-ways present in large excess, and is an efficient quencher of OH (kQ=1.4×10−
10 cm3 molecule−1 s−1; Bailey et al., 1997). Nonetheless, it was thought prudent to directly monitor the OH LIF response to the presence of such large [CH3C(O)CH3] in experi-ments using H2O2photolysis (R26) as a direct, well-characterised source of OH. 10
H2O2+hν(248 nm)→2OH (R26)
OH+CH3C(O)CH3→H2O+CH3C(O)CH2 (R27)
No CH3C(O)CH3 mediated quenching of the OH LIF signals was observed.
In the course of these experiments, the rate coefficient k27=(1.9±0.2)×10− 13
cm3 molecule−1 s−1 was obtained, in good agreement with the evaluated literature
15
(k27=(1.8±0.4)×10− 13
cm3 molecule−1 s−1; Atkinson et al., 2007) thereby increasing confidence in the supply of acetone, and the (R2) reaction system.
It was difficult to obtain more information about (R2), as the only species detected (OH) was produced at such small yield. Simulations were generally initiated using the evaluated literature value of k2(298 K)=9.0×10−
12
cm3 molecule−1 s−1. This recom-20
mendation is based on the results of just one experimental study (Bridier et al., 1993), and is consequently quoted with an uncertainty of approximately a factor of 2. An im-proved reproduction of the data was achieved (e.g. in Fig. 4) when values close to the lower error limit fork2 of 5×10⁻¹²cm3molecule−1s−1 were used. However, given that
OH is produced via (R1) which follows the break-up (R28) of CH3C(O)CH2O and rapid 25
conversion (R16) of CH3CO to CH3C(O)O2, Bridier et al. should have underestimated
ACPD
8, 7111–7148, 2008OH from peroxy radicals
T. J. Dillon and J. N. Crowley
Title Page
Abstract Introduction
Conclusions References
Tables Figures
◭ ◮
◭ ◮
Back Close
Full Screen / Esc
Printer-friendly Version
Interactive Discussion
k2.
CH3C(O)CH2O→CH3CO+HCHO (R28)
Secondary OH production in this reaction system is, however quite difficult to quan-tify, as losses of CH3C(O)CH2O2 include (R29) which also produces CH3C(O)CH2O and ultimately OH.
5
CH3C(O)CH2O2+CH3C(O)CH2O2→2CH3C(O)CH2O (R29a)
→CH3C(O)CH2OH+CH3C(O)CHO+O2 (R29b)
Approximately equal amounts of HO2 and RO2 were used in the earlier kinetic
study (Bridier et al., 1993), leading to near 50% of initial CH3C(O)CH2O2 reacting via (R29) rather than (R2). Similarly, in the experiments of Hasson et al. a signifi-cant proportion (>30%) of CH3C(O)CH2O2 was lost in (R29). Subsequent OH for-mation from the reaction sequence (R29a), (R28), and (R1) was included in their 10
analysis (Hasson et al., 2004), though it is unclear how sensitive their result of
α2=(0.67±0.2) is to the values ofk2and k29 used. Note that due to the experimental conditions of [HO2]>[CH3C(O)CH2O2] used in this work, (R2) accounted for>90% of CH3C(O)CH2O2 loss. Secondary OH production via (R29a), (R28), (R16) and (R1) was therefore minimised. We are confident therefore in the result ofα2=(0.15±0.10) 15
obtained in this work, but note that inconsistencies remain in the values ofk2used here and those of Bridier et al. Further experiments in which HO2, CH3C(O)CH2O2and OH were monitored would help to resolve these issues.
3.3 The reaction (R8) HO2+HOCH2CH2O2→(products)
Photolysis (R10) of Cl2 in the presence of ethanol was used to generate a simple 20
ACPD
8, 7111–7148, 2008OH from peroxy radicals
T. J. Dillon and J. N. Crowley
Title Page
Abstract Introduction
Conclusions References
Tables Figures
◭ ◮
◭ ◮
Back Close
Full Screen / Esc
Printer-friendly Version
Interactive Discussion
Cl+CH3CH2OH→CH3CHOH+HCl (R30a)
→CH2CH2OH+HCl (R30b)
CH3CHOH+O2→HO2+CH3CHO (R31)
CH2CH2OH+O2+M→HOCH2CH2O2+M+HCL(product) (R32)
Conveniently, the reaction sequence (R30–32) produced the large excess of [HO2]>[HOCH2CH2O2] required to determineα8. As a result these experiments were conducted in the absence of CH3OH. Figure 5 displays the results of one such exper-5
iment conducted atT=298 K andP=250 mBar. The open black circles describe data where [NO]=2.9×10¹² molecule cm−3 was used to generate (R4) a known amount of
OH and hence calibrate the LIF detection system. The red stars show the compara-tively small amount of OH generated from [HOCH2CH2O2]=5.3×10
12
molecule cm−3in the presence of [HO2]=5.6×10¹³molecule cm−3. Numerical simulation using the
rec-10
ommendedk8=1.2×10⁻¹¹cm3 molecule−1 s−1 (Atkinson et al., 2007), demonstrated
that small OH yields ofα8≈0.02 were required to reproduce this and similar datasets (see Table 2). To account for uncertainties particularly ink8 (±60%) we quote a con-servative upper-limit ofα8<0.04. Similar results were obtained atT=257 and 351 K.
3.4 OH yields for other HO2+RO2reactions 15
The methods detailed in section 2 were used to measure OH product yields for the reactions of a number of other substituted peroxy radicals with HO2. Common to each system studied was PLP generation (R10) of [Cl]=7×10¹³molecule cm−3, in the
presence of [CH3OH]=6×10 15
molecule cm−3andP=220 mBar (air) to facilitate forma-tion (R11–12) of the excess reagent HO2. The OH LIF system was calibrated using 20
HO2+NO (R4), as described in Sect. 2.4. Note that simulation of the observed OH profiles relied upon a host of kinetic data (see Appendix A), which was not completely
ACPD
8, 7111–7148, 2008OH from peroxy radicals
T. J. Dillon and J. N. Crowley
Title Page
Abstract Introduction
Conclusions References
Tables Figures
◭ ◮
◭ ◮
Back Close
Full Screen / Esc
Printer-friendly Version
Interactive Discussion
available. Crucially, no literature rate coefficients for the HO2+RO2 reactions were found, therefore an estimated value of k=1×10⁻¹¹cm3 molecule−1 s−1 was adopted
for all such processes. As a result, the values ofα listed in Table 2 (exceptingα2and
α8) should be regarded as no more than semi-quantitative.
No evidence for OH production was observed upon addition of (CH3)2CHOH to the 5
Cl2/CH3OH/air photolysis mixture for the study of (R9) (HO2+CH3CH(OH)CH2O2). Fol-lowing consideration of the noise on the LIF signals, and uncertainties in the estimated value ofk9=1×10⁻¹¹cm3molecule−1s−1used, a conservative upper-limit ofα9<0.06 was assigned. It was unfortunately not possible to investigate RO2 generated from unsaturated precursors, such as the atmospherically important hydroxyperoxy radicals 10
produced (R6–7) from isoprene. Addition of isoprene to the Cl2/CH3OH/air photolysis mixture produced a mixture of C5H8ClO2isomers in an excess of HO2, from which no OH was observed (α33<0.03, see Table 2).
HO2+ClC5H8O2→(products) (R33)
Addition of isopentanol to the photolysis mixture was used to generate structurally 15
similar (saturated) analogues of the target isoprene hydroxyperoxys. No OH production was observed however, and an upper-limit ofα34<0.06 was derived.
HO2+HOC5H10O2→(products) (R34)
By contrast, strong evidence for OH formation was observed (α ≈0.2) for the
reac-tions of HO2with RO2containing a carbonyl group, e.g. those from benzaldehyde and 20
butanone:
HO2+C6H5C(O)O2→OH+(other products) (R35)
ACPD
8, 7111–7148, 2008OH from peroxy radicals
T. J. Dillon and J. N. Crowley
Title Page
Abstract Introduction
Conclusions References
Tables Figures
◭ ◮
◭ ◮
Back Close
Full Screen / Esc
Printer-friendly Version
Interactive Discussion 4 Atmospheric implications and conclusions
OH was, for the first time, directly observed as a product from reactions of HO2 with peroxy radicals. For the reaction (R1) (HO2+CH3C(O)O2), an OH product yield α1=(0.5±0.2) was measured, in good agreement with two recent indirect
de-terminations (Hasson et al., 2004; Jenkin et al., 2007). The rate coefficient k1(298 5
K)=(1.4±0.5)×10−11cm3 molecule−1 s−1, was determined, substantially reducing the
uncertainties in this important atmospheric parameter. OH products were also ob-served from the reactions of HO2 with three other carbonyl-containing RO2 (pro-duced from acetone, benzaldehyde and butanone). These results imply that a host of HO2+carbonyl-RO2reactions, previously considered to be radical-terminating, may 10
produce OH in the atmosphere. For (R2) (HO2+CH3C(O)CH2O2) the measured
α2≈0.15 was considerably smaller than in the only literature determination (Hasson et al., 2004). By contrast OH was not observed as a major product from reactions where carbonyl functionality was absent, e.g. the reactions of HO2 with hydroxy-containing RO2. Conservative upper-limits were assigned for the reactions of HO2with 15
HOCH2CH2O2 (R8, α8< 0.04), CH3CH(OH)CH2O2 (R9, α9<0.06) and HOC5H10O2 (R34,α34<0.06).
ACPD
8, 7111–7148, 2008OH from peroxy radicals
T. J. Dillon and J. N. Crowley
Title Page
Abstract Introduction
Conclusions References
Tables Figures
◭ ◮
◭ ◮
Back Close
Full Screen / Esc
Printer-friendly Version
Interactive Discussion Appendix A
List of reactions and rate parameters used in data simulations
(R11) Cl + CH3OH → CH2OH 5.5×10⁻¹¹
(R14a) Cl + HO2→ (1 - 1.7exp(-620 / T)) × 4.4×10⁻¹¹
(R14b) Cl + HO2→ OH + ClO 1.7exp(-620 / T) × 4.4×10⁻¹¹
(R12) CH2OH + O2→ HO2 + HCHO 9.7×10⁻¹²
CH3O + O2→ HO2 + HCHO 7.4×10 -14
exp(-1080 / T)
(R13) CH2OH + Cl2→ Cl 2.9×10
-11 (Tyndall et al., 1999)
(R4) HO2 + NO → OH + NO2 3.6×10⁻¹² exp(270 / T)
(R18) HO2 + HO2→ 2.2×10⁻¹³ exp(600 / T) + 1.9×10⁻³³[M] exp(980 / T)
(R20a) OH + CH3OH → CH2OH 0.85×6.38×10-5 T2
exp(144 / T)
(R20b) OH + CH3OH → CH3O 0.15×6.38×10-5 T2
exp(144 / T)
(R21) OH + HO2→ 4.8×10⁻¹¹ exp(250 / T)
OH + NO + M → k0 = 7.4×10⁻³¹ [N2], k∞ = 3.3×10 -11
, Fc = 0.81
ACPD
8, 7111–7148, 2008OH from peroxy radicals
T. J. Dillon and J. N. Crowley
Title Page
Abstract Introduction
Conclusions References
Tables Figures
◭ ◮
◭ ◮
Back Close
Full Screen / Esc
Printer-friendly Version
Interactive Discussion (R15) Cl + CH3CHO → CH3CO 8.0×10⁻¹¹
(R16a) CH3CO + O2→ CH3C(O)O2 (1-α16) × 5.1×10 -12
(R16b) CH3CO + O2→ OH α16× 5.1×10-12
(R17) CH3CO + Cl2→ Cl 4.3×10⁻¹¹ (Tyndall et al., 1999)
(R22) HO2 + CH3CHO ↔ CH3C(OH)O2 k22 = 4.4×10 -14
, K22 = 1.9×10⁻²⁷
exp(6925 / T) cm3
molecule-1
.
(Tomas et al., 2001)
(R23) OH + CH3CHO → CH3CO 4.4×10⁻¹² exp(365 / T)
(R1c) CH3C(O)O2 + HO2→ OH + CH3 k1×α1 (varied, this work)
(R1ab) CH3C(O)O2 + HO2→ k1× (1 - α1) (varied, this work)
(R19) CH3C(O)O2 + CH3C(O)O2→ 2CH3 2.9×10 -12
exp(500 / T)
(R2a) HO2 + CH3C(O)CH2O2→ OH + CH3CO (1 - α) ×k2 (varied, this work)
(R2b) HO2 + CH3C(O)CH2O2→ OH + CH3CO α×k2 (varied, this work)
(R24) Cl + CH3C(O)CH3→ CH3C(O)CH2 2.1×10⁻¹²
(R27) OH + CH3C(O)CH3→ CH3C(O)CH2 1.8×10⁻¹³
(R25) CH3C(O)CH2 + O2→ CH3C(O)CH2O2 1×10-12
CH3C(O)CH2 + Cl2→ Cl 4.3×10 -11
(estimate)
(R29a) 2CH3C(O)CH2O2→ 2CH3CO 0.63 × 8×10-12
(R29b) 2CH3C(O)CH2O2→ 0.37 × 8×10 -12
(R8a) HO2 + HOCH2CH2O2→ (1-α8) × 1.4×10 -11
(varied, this work)
(R8b) HO2 + HOCH2CH2O2 → OH + O2 + HOCH2CH2O
α8× 1.4×10-11 (varied, this work)
(R30a) Cl + CH3CH2OH → CH3CHOH + HCl 0.92 × 8.6×10-11
(R30b) Cl + CH3CH2OH → CH2CH2OH 0.08 × 8.6×10 -11
(R31) CH3CHOH + O2 → HO2 + CH3CHO 1.9×10 -11
ACPD
8, 7111–7148, 2008OH from peroxy radicals
T. J. Dillon and J. N. Crowley
Title Page
Abstract Introduction
Conclusions References
Tables Figures
◭ ◮
◭ ◮
Back Close
Full Screen / Esc
Printer-friendly Version
Interactive Discussion (R32) CH2CH2OH + O2 + M → HOCH2CH2O2 +
M
3.0×10⁻¹²
CH3CHOH + Cl2→ Cl 3×10-11 (estimate)
CH2CH2OH + Cl2→ Cl 3×10-11 (estimate)
OH + CH3CH2OH → CH3CHOH 3.0×10⁻¹²×exp(20 / T)
2HOCH2CH2O2 → 0.5 × 7.8×10-14× exp(1000 / T)
2HOCH2CH2O2 → 2HOCH2CH2O 0.5 × 7.8×10-14× exp(1000 / T)
(R9a) HO2 + CH3CH(OH)CH2O2 → (1-α9) * 1×10-11 (estimate, this work)
(R9b) HO2 + CH3CH(OH)CH2O2 → OH α9 * 1×10-11 (estimate, this work) Cl + (CH3)2CHOH → (CH3)2COH 0.85 × 8.6×10-11 (Yamanaka et al., 2007)
Cl + (CH3)2CHOH → CH3C(OH)CH2 0.15 × 8.6×10-11 (Yamanaka et al., 2007)
(CH3)2COH + O2→ HO2 1.9×10 -11
CH3C(OH)CH2 + O2→ CH3C(OH)CH2O2 1×10-11 (estimate)
CH3C(OH)CH2O2 + CH3C(OH)CH2O2→ 2×10-12 (estimate)
OH + (CH3)2CHOH → CH3C(OH)CH2 5.1×10 -12
(R33-36) HO2 + RO2→ (1-α) × 1×10-11 (estimate, this work)
(R33-36) HO2 + RO2→ OH α× 1×10-11 (estimate, this work)
Cl + C5H8→ R 3.4×10 -10
(Bedjanian et al., 1998)
OH + C5H8→ R 1.0×10⁻¹⁰
Cl + (CH3)2CH(CH2)2OH → R 0.5 × 2.5×10-10 (estimate, (Wu et al., 2003))
Cl + (CH3)2CH(CH2)2OH → HO2 0.5 × 2.5×10 -10
(estimate, (Wu et al., 2003))
ACPD
8, 7111–7148, 2008OH from peroxy radicals
T. J. Dillon and J. N. Crowley
Title Page
Abstract Introduction
Conclusions References
Tables Figures
◭ ◮
◭ ◮
Back Close
Full Screen / Esc
Printer-friendly Version
Interactive Discussion Cl + C6H5CHO → R 9.6×10⁻¹¹ (Noziere et al., 1994)
OH + C6H5CHO → R 1.3×10⁻¹¹ (Baulch et al., 1994)
Cl + CH3C(O)C2H5 → R 3.6×10⁻¹¹
OH + CH3C(O)C2H5→ R 1.2×10⁻¹²
R + O2→ RO2 6×10-12 (estimate)
R + Cl2 → Cl 3×10-11 (estimate)
RO2 + RO2 → 5×10-12 (estimate)
Note – all rate parameters in units of cm3molecule−1s−1and taken from (Atkinson et al., 2007) unless stated.
ACPD
8, 7111–7148, 2008OH from peroxy radicals
T. J. Dillon and J. N. Crowley
Title Page
Abstract Introduction
Conclusions References
Tables Figures
◭ ◮
◭ ◮
Back Close
Full Screen / Esc
Printer-friendly Version
Interactive Discussion Appendix References
Atkinson, R., Baulch, D. L., Cox, R. A., Crowley, J. N., Hampson, R. F., Hynes, R. G., Jenkin, M. E., Kerr, J. A., Rossi, M. J., and Troe, J.: IUPAC Subcommittee for gas kinetic data evaluation, Evaluated kinetic data:
http://www.iupac-kinetic.ch.cam.ac.uk/, 2007. 5
Baulch, D. L., Cobos, C. J., Cox, R. A., Frank, P., Hayman, G., Just, T., Kerr, J. A., Murrells, T., Pilling, M. J., Troe, J., Walker, R. W., and Warnatz, J.: Evaluated Kinetic Data For Combustion Modeling Supplement-I, J. Phys. Chem. Ref. Data, 23, 847–1033, 1994.
Bedjanian, Y., Laverdet, G., and Le Bras, G.: Low-pressure study of the reaction of 10
Cl atoms with isoprene, J. Phys. Chem. A, 102, 953–959, 1998.
Noziere, B., Lesclaux, R., Hurley, M. D., Dearth, M. A., and Wallington, T. J.: A Kinetic and Mechanistic Study of the Self-Reaction and Reaction with Ho2 of the Benzylperoxy Radical, J. Phys. Chem., 98, 2864–2873, 1994.
Tomas, A., Villenave, E., and Lesclaux, R.: Reactions of the HO2 radical with 15
CH3CHO and CH3C(O)O2in the gas phase, J. Phys. Chem. A, 105, 3505–3514, 2001.
Tyndall, G. S., Orlando, J. J., Kegley-Owen, C. S., Wallington, T. J., and Hurley, M. D.: Rate coefficients for the reactions of chlorine atoms with methanol and
acetaldehyde, Int. J. Chem. Kin., 31, 776–784, 1999. 20
Wu, H., Mu, Y. J., Zhang, X. S., and Jiang, G. B.: Relative rate constants for the reactions of hydroxyl radicals and chlorine atoms with a series of aliphatic alcohols, Int. J. Chem. Kin., 35, 81–87, 2003.
Yamanaka, T., Kawasaki, M., Hurley, M. D., Wallington, T. J., Schneider, W. F., and Bruce, J.: Kinetics and mechanism of the gas phase reaction of chlorine atoms 25
ACPD
8, 7111–7148, 2008OH from peroxy radicals
T. J. Dillon and J. N. Crowley
Title Page
Abstract Introduction
Conclusions References
Tables Figures
◭ ◮
◭ ◮
Back Close
Full Screen / Esc
Printer-friendly Version
Interactive Discussion
Acknowledgements. The authors particularly wish to thank M. Jenkin, D. Taraborelli, and
J. Williams, together with whole MPI GABRIEL team for their helpful suggestions. TJD ac-knowledges the receipt of a research Stipendium from the Max Planck Society.
References
Andersen, M. P. S., Hurley, M. D., Wallington, T. J., Ball, J. C., Martin, J. W., Ellis, D. A., and
5
Mabury, S. A.: Atmospheric chemistry of C2F5CHO: mechanism of the C2F5C(O)O2+HO2 reaction, Chem. Phys. Lett., 381, 14–21, 2003.
Atkinson, R. and Arey, J.: Gas-phase tropospheric chemistry of biogenic volatile organic com-pounds: a review, Atmos. Environ., 37, S197–S219, 2003.
Atkinson, R., Baulch, D. L., Cox, R. A., Crowley, J. N., Hampson, R. F., Hynes, R. G., Jenkin, M.
10
E., Kerr, J. A., Rossi, M. J., and Troe, J.: IUPAC Subcommittee for gas kinetic data evaluation. Evaluated kinetic data:http://www.iupac-kinetic.ch.cam.ac.uk/, 2007.
Bailey, A. E., Heard, D. E., Paul, P. H., and Pilling, M. J.: Collisional quenching of OH (A2Σ+,
ν’=0) by N2, O2 and CO2 between 204 and 294 K. Implications for atmospheric measure-ments of OH by laser-induced fluorescence, Journal of the Chemical Society-Faraday
Trans-15
actions, 93, 2915–2920, 1997.
Bridier, I., Veyret, B., Lesclaux, R., and Jenkin, M. E.: Flash-Photolysis Study of the UV Spectrum and Kinetics of Reactions of the Acetonylperoxy Radical, Journal of the Chem-ical Society-Faraday Transactions, 89, 2993–2997, 1993.
Carr, S. A., Baeza-Romero, M. T., Blitz, M. A., Pilling, M. J., Heard, D. E., and Seakins, P. W.:
20
OH yields from the CH3CO+O2reaction using an internal standard, Chem. Phys. Lett., 445, 108–112, 2007.
Crawford, M. A., Wallington, T. J., Szente, J. J., Maricq, M. M., and Francisco, J. S.: Kinetics and mechanism of the acetylperoxy plus HO2 reaction, J. Phys. Chem. A, 103, 365–378, 1999.
25
Curtis, A. R. and Sweetenham, W. P.: Facsimile, AERE, Report R-12805, 1987.
Dillon, T. J., H ¨olscher, D., Sivakumaran, V., Horowitz, A., and Crowley, J. N.: Kinetics of the re-actions of HO with methanol (210–351 K) and with ethanol (216–368 K), Phys. Chem. Chem. Phys., 7, 349–355, 2005.
ACPD
8, 7111–7148, 2008OH from peroxy radicals
T. J. Dillon and J. N. Crowley
Title Page
Abstract Introduction
Conclusions References
Tables Figures
◭ ◮
◭ ◮
Back Close
Full Screen / Esc
Printer-friendly Version
Interactive Discussion Dillon, T. J., Horowitz, A., and Crowley, J. N.: Absolute rate coefficients for the reactions of
O(1D) with a series of n-alkanes, Chem. Phys. Lett., 14, 12–16, 2007.
Dillon, T. J., Horowitz, A., H ¨olscher, D., and Crowley, J. N.: Reaction of HO with hydroxyacetone (HOCH2C(O)CH3): rate coefficients and mechanism., Phys. Chem. Chem. Phys., 8, 236– 246, 2006a.
5
Dillon, T. J., Tucceri, M. E., and Crowley, J. N.: Laser induced fluorescence studies of IO kinetics, part 2: Reaction of IO with CH3O2, CF3O2 and O3at 298 K, Phys. Chem. Chem. Phys., 8, 5185–5198, 2006b.
Dillon, T. J., Tucceri, M. E., Sander, R., and Crowley, J. N.: LIF studies of iodine oxide chemistry, Part 3. Reactions IO+NO3− >OIO +NO2, I +NO3− >IO+NO2, and CH2I +O2− > 10
(products): implications for the chemistry of the marine atmosphere at night, Phys. Chem. Chem. Phys., 10, 1540–1554, 2008.
Gierczak, T., Gilles, M. K., Bauerle, S., and Ravishankara, A. R.: Reaction of hydroxyl radical with acetone, 1. Kinetics of the reactions of OH, OD, and18OH with acetone and acetone-D6, J. Phys. Chem. A, 107, 5014–5020, 2003.
15
Hasson, A. S., Kuwata, K. T., Arroyo, M. C., and Petersen, E. B.: Theoretical studies of the reaction of hydroperoxy radicals (HO2) with ethyl peroxy (CH3CH2O2), acetyl peroxy (CH3C(O)O2) and acetonyl peroxy (CH3C(O)CH2O2) radicals, J. Phtochem. Photobiol, A Chemistry, 176, 218–230, 2005.
Hasson, A. S., Tyndall, G. S., and Orlando, J. J.: A product yield study of the reaction of
20
HO2 radicals with ethyl peroxy (C2H5O2), acetyl peroxy (CH3C(O)O2), and acetonyl peroxy (CH3C(O)CH2O2) radicals, J. Phys. Chem. A, 108, 5979–5989, 2004.
Horie, O. and Moortgat, G. K.: Reactions of CH3C(O)O2 Radicals with CH3O2 and HO2 be-tween 263 and 333 K – a Product Study, Journal of the Chemical Society-Faraday Transac-tions, 88, 3305–3312, 1992.
25
Jenkin, M. E., Hurley, M. D., and Wallington, T. J.: Investigation of the radical product channel of the CH3C(O)O2+HO2reaction in the gas phase, Phys. Chem. Chem. Phys., 9, 3149–3162, 2007.
Karunanandan, R., H ¨olscher, D., Dillon, T. J., Horowitz, A., and Crowley, J.: Reaction of HO with glycolaldehyde, HOCH2CHO: Rate coefficients (240–362 K) and mechanism, J. Phys.
30
Chem. A, 111, 897–908, 2007.
theoreti-ACPD
8, 7111–7148, 2008OH from peroxy radicals
T. J. Dillon and J. N. Crowley
Title Page
Abstract Introduction
Conclusions References
Tables Figures
◭ ◮
◭ ◮
Back Close
Full Screen / Esc
Printer-friendly Version
Interactive Discussion cal approaches, Phys. Chem. Chem. Phys., 8, 2163–2171, 2006.
Lightfoot, P. D., Cox, R. A., Crowley, J. N., Destriau, M., Hayman, G. D., Jenkin, M. E., Moort-gat, G. K., and Zabel, F.: Organic peroxy radicals: kinetics, spectroscopy and tropospheric chemistry, Atmos. Environ., 264, 1805–1964, 1993.
Moortgat, G. K., Veyret, B., and Lesclaux, R.: Kinetics of the Reaction of HO2with CH3C(O)O2
5
in the Temperature-Range 253–368 K, Chem. Phys. Lett., 160, 443–447, 1989.
Niki, H., Maker, P. D., Savage, C. M., and Breitenbach, L. P.: Ftir Study of the Kinetics and Mechanism For Cl-Atom-Initiated Reactions of Acetaldehyde, J. Phys. Chem., 89, 588–591, 1985.
Salahub, D. R. and Sandorfy, C.: Far-Ultraviolet Spectra of Some Simple Alcohols and
Fluo-10
roalcohols, Chem. Phys. Lett., 8, 71–74, 1971.
Tomas, A., Villenave, E., and Lesclaux, R.: Reactions of the HO2 radical with CH3CHO and CH3C(O)O2in the gas phase, J. Phys. Chem. A, 105, 3505–3514, 2001.
Tyndall, G. S., Cox, R. A., Granier, C., Lesclaux, R., Moortgat, G. K., Pilling, M. J., Ravis-hankara, A. R., and Wallington, T. J.: Atmospheric chemistry of small organic peroxy radicals,
15
J. Geophys. Res., 106, 12 157–12 182, 2001.
Tyndall, G. S., Orlando, J. J., Kegley-Owen, C. S., Wallington, T. J., and Hurley, M. D.: Rate coefficients for the reactions of chlorine atoms with methanol and acetaldehyde, Int. J. Chem. Kin., 31, 776–784, 1999.
Wollenhaupt, M., Carl, S. A., Horowitz, A., and Crowley, J. N.: Rate coefficients for reaction of
20
OH with acetone between 202 and 395 K, J. Phys. Chem. A, 104, 2695–2705, 2000.
ACPD
8, 7111–7148, 2008OH from peroxy radicals
T. J. Dillon and J. N. Crowley
Title Page
Abstract Introduction
Conclusions References
Tables Figures
◭ ◮
◭ ◮
Back Close
Full Screen / Esc
Printer-friendly Version
Interactive Discussion
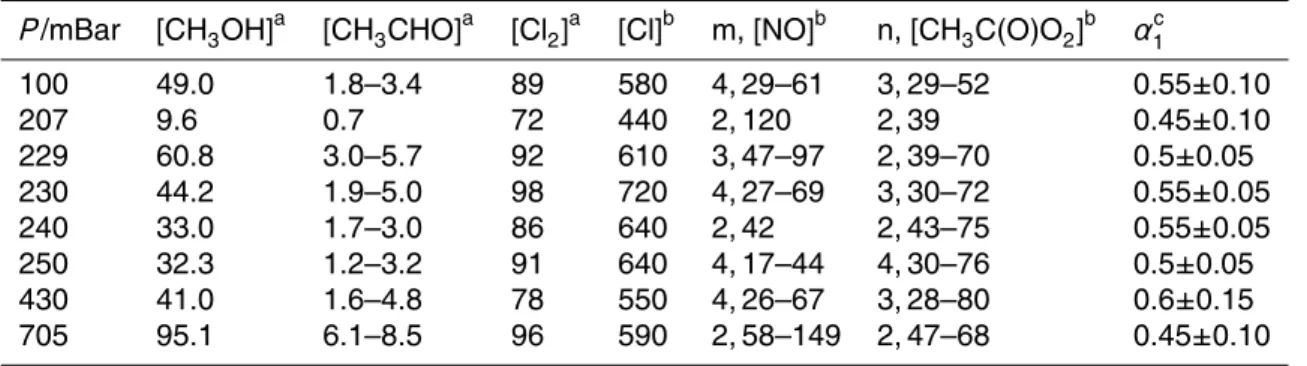
Table 1.Determinations ofα1and corresponding experimental conditions.
P/mBar [CH3OH]a [CH3CHO]a [Cl2]a [Cl]b m, [NO]b n, [CH3C(O)O2]b αc1
100 49.0 1.8–3.4 89 580 4, 29–61 3, 29–52 0.55±0.10 207 9.6 0.7 72 440 2, 120 2, 39 0.45±0.10 229 60.8 3.0–5.7 92 610 3, 47–97 2, 39–70 0.5±0.05 230 44.2 1.9–5.0 98 720 4, 27–69 3, 30–72 0.55±0.05 240 33.0 1.7–3.0 86 640 2, 42 2, 43–75 0.55±0.05 250 32.3 1.2–3.2 91 640 4, 17–44 4, 30–76 0.5±0.05 430 41.0 1.6–4.8 78 550 4, 26–67 3, 28–80 0.6±0.15 705 95.1 6.1–8.5 96 590 2, 58–149 2, 47–68 0.45±0.10
Notes:
a
=precursor concentrations in units of 1014molecule cm−3;
b
=radical (Cl, NO, CH3C(O)O2) concentrations in units of 1011molecule cm−3
; m=number of calibration (R4) profiles recorded, over a range of [NO];
n=number of (R1) profiles used to determineα1;
c
ACPD
8, 7111–7148, 2008OH from peroxy radicals
T. J. Dillon and J. N. Crowley
Title Page
Abstract Introduction
Conclusions References
Tables Figures
◭ ◮
◭ ◮
Back Close
Full Screen / Esc
Printer-friendly Version
Interactive Discussion
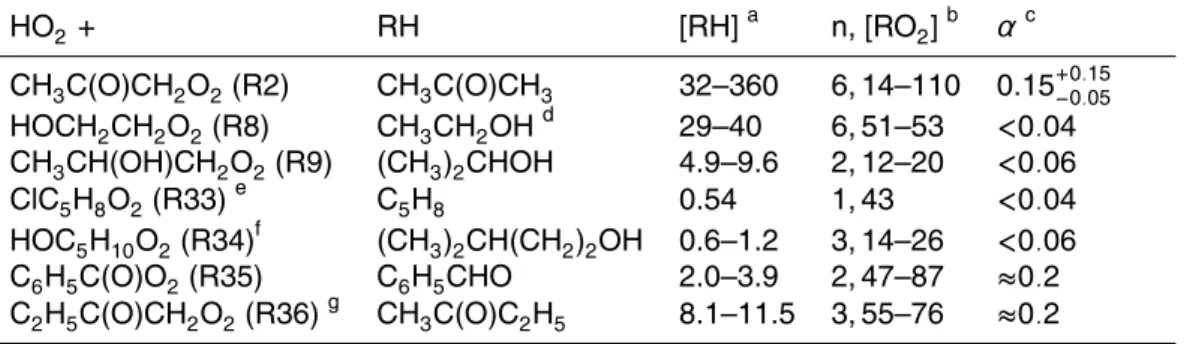
Table 2.Determinations of OH yieldαfor other HO2+RO2reactions.
HO2+ RH [RH]a n, [RO2]b αc
CH3C(O)CH2O2(R2) CH3C(O)CH3 32–360 6, 14–110 0.15+−00..1505 HOCH2CH2O2(R8) CH3CH2OHd 29–40 6, 51–53 <0.04 CH3CH(OH)CH2O2(R9) (CH3)2CHOH 4.9–9.6 2, 12–20 <0.06 ClC5H8O2(R33)e C5H8 0.54 1, 43 <0.04 HOC5H10O2(R34)f (CH3)2CH(CH2)2OH 0.6–1.2 3, 14–26 <0.06 C6H5C(O)O2(R35) C6H5CHO 2.0–3.9 2, 47–87 ≈0.2 C2H5C(O)CH2O2(R36)g CH3C(O)C2H5 8.1–11.5 3, 55–76 ≈0.2
Notes:
all experiments conducted at aroundT=298 K andP=220 mBar unless stated, see Sect. 3.4 for further details;
a
=[RH] in units of 1014molecule cm−3
;
b
=n is number of determinations ofα, [RO2] in units of 1011molecule cm−3
;
c
=errors inαdo not include the systematic uncertainty (±25%) in initial radical density;
d
=α8determined atT=259, 298 and 351 K;
e
=ClC5H8O2refers to 4 isomeric RO2;
f
=HOC5H10O2refers to three isomers;
g
=C2H5C(O)CH2O2refers to three isomers.
ACPD
8, 7111–7148, 2008OH from peroxy radicals
T. J. Dillon and J. N. Crowley
Title Page
Abstract Introduction
Conclusions References
Tables Figures
◭ ◮
◭ ◮
Back Close
Full Screen / Esc
Printer-friendly Version
Interactive Discussion
Fig. 1. Calibration of the OH LIF detection system using (R4) (HO2+NO). Generation (R10– R12) of [HO2]=6.1×10¹³molecule cm−3
in the presence of [NO]/1011molecule cm−3
![Fig. 5. Experiment to determine α 8 for (R8) HO 2 + HOCH 2 CH 2 O 2 → (products). The open black circles describe data where [NO] = 2.9 × 10 12 molecule cm −3 was used to generate a known amount of OH and hence calibrate the LIF detection system](https://thumb-eu.123doks.com/thumbv2/123dok_br/18452000.364320/38.918.139.571.34.417/experiment-determine-products-circles-molecule-generate-calibrate-detection.webp)
