ACPD
11, 18211–18248, 2011Rate coefficients for methylglyoxal and
glyoxal reactions
R. K. Talukdar et al.
Title Page
Abstract Introduction
Conclusions References
Tables Figures
◭ ◮
◭ ◮
Back Close
Full Screen / Esc
Printer-friendly Version
Interactive Discussion
Discussion
P
a
per
|
Dis
cussion
P
a
per
|
Discussion
P
a
per
|
Discussio
n
P
a
per
|
Atmos. Chem. Phys. Discuss., 11, 18211–18248, 2011 www.atmos-chem-phys-discuss.net/11/18211/2011/ doi:10.5194/acpd-11-18211-2011
© Author(s) 2011. CC Attribution 3.0 License.
Atmospheric Chemistry and Physics Discussions
This discussion paper is/has been under review for the journal Atmospheric Chemistry and Physics (ACP). Please refer to the corresponding final paper in ACP if available.
Rate coe
ffi
cients for the reaction of
methylglyoxal (CH
3
COCHO) with OH and
NO
2
and glyoxal (HCO)
2
with NO
3
R. K. Talukdar1,2, L. Zhu1,2, K. J. Feierabend1,2, and J. B. Burkholder1
1
Chemical Sciences Division, Earth System Research Laboratory, NOAA, 325 Broadway, Boulder, Colorado, 80305-3328, USA
2
Cooperative Institute for Research in Environmental Sciences, University of Colorado, Boulder, Colorado 80309, USA
Received: 3 June 2011 – Accepted: 6 June 2011 – Published: 27 June 2011 Correspondence to: R. K. Talukdar ([email protected])
Published by Copernicus Publications on behalf of the European Geosciences Union.
ACPD
11, 18211–18248, 2011Rate coefficients for methylglyoxal and
glyoxal reactions
R. K. Talukdar et al.
Title Page
Abstract Introduction
Conclusions References
Tables Figures
◭ ◮
◭ ◮
Back Close
Full Screen / Esc
Printer-friendly Version
Interactive Discussion
Discussion
P
a
per
|
Dis
cussion
P
a
per
|
Discussion
P
a
per
|
Discussio
n
P
a
per
|
Abstract
Rate coefficients, k, for the gas-phase reaction of CH3COCHO
(methylgly-oxal) with the OH and NO3 radicals and (CHO)2 (glyoxal) with the NO3
rad-ical are reported. Rate coefficients for the OH+CH3COCHO (k1) reaction were measured under pseudo-first-order conditions in OH as a function of
tem-5
perature (211–373 K) and pressure (100–220 Torr, He and N2 bath gases)
us-ing pulsed laser photolysis to produce OH radicals and laser induced fluores-cence to measure its temporal profile. k1 was found to be independent of
the bath gas pressure with k1(295 K)=(1.29±0.13)×10 −11
cm3molecule−1s−1 and a temperature dependence that is well represented by the Arrhenius expression
10
k1(T)=(1.74±0.20)×10 −12
exp[(590±40)/T] cm3molecule−1s−1 where the uncer-tainties are 2σ and include estimated systematic errors. Rate coefficients for the NO3+(CHO)2 (k3) and NO3+CH3COCHO (k4) reactions were measured using
a relative rate technique to be k3(296 K)=(3.7±1.0)×10 −16
cm3molecule−1s−1 and k4(296 K)=(4.1±1.2)×10
−16
cm3molecule−1s−1. k3(T) was also measured using an 15
absolute rate coefficient method under pseudo-first-order conditions at 296 and 353 K to be (4.2±0.8)×10−16 and (7.9±3.6)×10−16cm3molecule−1s−1, respectively, in agreement with the relative rate result obtained at room temperature. The atmospheric implications of the OH and NO3 reaction rate coefficients measured in this work are
discussed.
20
1 Introduction
Methylglyoxal, CH3COCHO (MGLY), and glyoxal, (HCO)2 (GLY), are dicarbonyls that play an important role in atmospheric chemistry as tracers of atmospheric biogenic and anthropogenic organic chemistry. They also play a role in tropospheric ozone pro-duction and secondary organic aerosol (SOA) formation on local to regional scales
25
ACPD
11, 18211–18248, 2011Rate coefficients for methylglyoxal and
glyoxal reactions
R. K. Talukdar et al.
Title Page
Abstract Introduction
Conclusions References
Tables Figures
◭ ◮
◭ ◮
Back Close
Full Screen / Esc
Printer-friendly Version
Interactive Discussion
Discussion
P
a
per
|
Dis
cussion
P
a
per
|
Discussion
P
a
per
|
Discussio
n
P
a
per
|
are removed from the atmosphere primarily by UV/visible photolysis, gas-phase reac-tion, and heterogeneous processes. Studies of the OH radical reaction with glyoxal and its UV/visible photolysis quantum yields have been reported in previous work from this laboratory (Feierabend et al., 2008, 2009). In this work, rate coefficients for the OH radical reaction with methylglyoxal and the NO3 radical reaction with glyoxal and 5
methylglyoxal are presented.
Methylglyoxal is formed in the degradation of volatile organic compounds includ-ing isoprene and the aromatic hydrocarbons toluene, xylene, and trimethylbenzene. Methylglyoxal is also emitted directly into the atmosphere via the incomplete combus-tion of fossil fuels and biomass and to a lesser extent in automobile emissions as
10
a result of biofuel usage. Approximately 30 % of the atmospheric oxidation of isoprene, the biogenic hydrocarbon with the greatest global emission, leads to the formation of methylglyoxal (Paulot et al., 2009; Paulson and Seinfeld, 1992), which accounts for ∼79 % of the methylglyoxal atmospheric budget. The atmospheric degradation of ace-tone is the next largest source of methylglyoxal and accounts for∼7 % of its budget
15
(Fu et al., 2008). The atmospheric abundance of methylglyoxal varies depending on location and season with gas-phase values of∼0.15 ppb and particle-phase concen-trations in the range 0.1–8.0 ng m−3 reported in urban and rural areas (Grossmann et al., 2003; Ho et al., 2006; Liggio and McLaren, 2003; Moortgat et al., 2002).
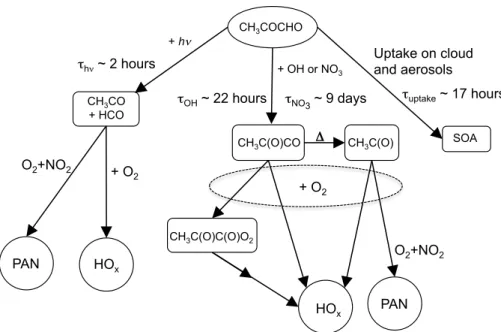
The general atmospheric degradation scheme for methylglyoxal given in Fig. 1 shows
20
that the competition between its reaction with the OH radical and its UV photolysis plays an important role in determining HOxproduction, which effects the oxidation capacity of
the atmosphere, and the CH3C(O)OONO2 (PAN) yield, which impacts ozone produc-tion in remote locaproduc-tions (Atkinson et al., 2006; Baeza-Romero et al., 2007; Staffelbach et al., 1995). Reaction with the OH radical
25
OH+CH3COCHO→CH3COCO+H2O −27 kcal mol−1 (1a)
→CH2COCHO+H2O −20 kcal mol−1 (1b)
ACPD
11, 18211–18248, 2011Rate coefficients for methylglyoxal and
glyoxal reactions
R. K. Talukdar et al.
Title Page
Abstract Introduction
Conclusions References
Tables Figures
◭ ◮
◭ ◮
Back Close
Full Screen / Esc
Printer-friendly Version
Interactive Discussion
Discussion
P
a
per
|
Dis
cussion
P
a
per
|
Discussion
P
a
per
|
Discussio
n
P
a
per
|
leads to no net HOxradical production, while degradation via UV photolysis produces HOx(Atkinson et al., 2006)
CH3COCHO+hν→CH3CO+HCO 387 nm (2a)
→CH4+2CO All (2b)
→CH3CHO+CO All (2c)
5
→CH3COCO+H 380 nm (2d)
where the heats of reaction, ∆rH 0
, and photolysis thresholds were calculated using available thermochemical parameters (Sander et al., 2006). PAN, which enables the long-range transport of NOx (NOx=NO+NO2) and ultimately ozone production in re-10
mote areas, is an end-product of both the OH reaction and UV photolysis mecha-nisms. It is important to quantify the degradation pathways to fully evaluate the impact of methylglyoxal on tropospheric chemistry.
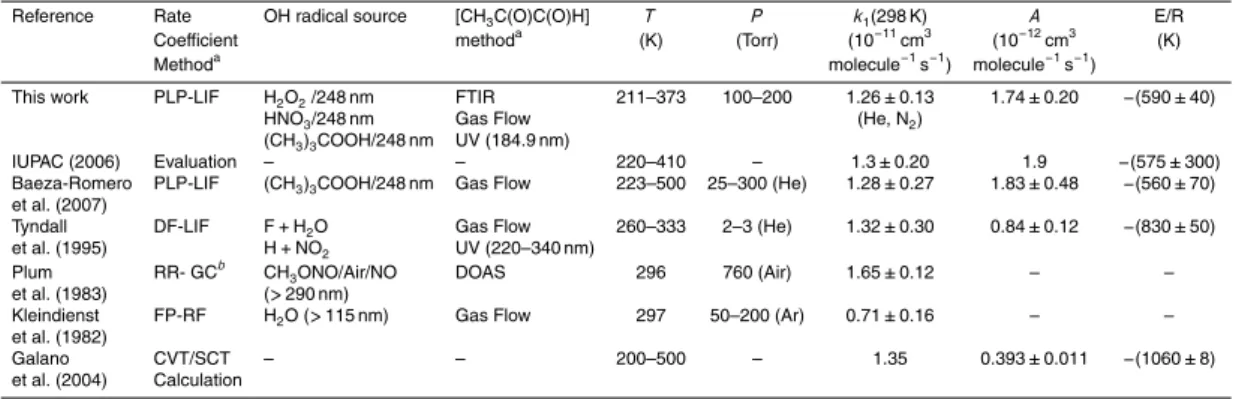
Several studies of the rate coefficient for Reaction (1),k1, have been reported to date
with room temperature values falling in the range (7–16)×10−12cm3molecule−1s−1
15
(Baeza-Romero et al., 2007; Kleindienst et al., 1982; Plum et al., 1983; Tyndall et al., 1995). Rate coefficient data at atmospherically relevant temperatures,≤298 K, is, how-ever, more limited. In fact, only one study has reported rate coefficient data at tem-peratures below 260 K (Baeza-Romero et al., 2007). The current IUPAC kinetic data evaluation recommendsk1(T)=1.9×10
−12
exp((575±300)/T) cm3molecule−1s−1 for
20
use in atmospheric models (Atkinson et al., 2006). The large uncertainty in the acti-vation energy, E/R, is primarily due to a lack of experimental data for the temperature dependence of Reaction (1). Additional measurements ofk1(T), particularly at reduced
temperatures, are therefore warranted and were addressed in the present study. Nighttime atmospheric loss processes of methylglyoxal and glyoxal are also of
in-25
terest for modeling tropospheric chemistry and possible SOA formation, but at present are not well characterized. The reaction of methylglyoxal and glyoxal with NO3 and
ACPD
11, 18211–18248, 2011Rate coefficients for methylglyoxal and
glyoxal reactions
R. K. Talukdar et al.
Title Page
Abstract Introduction
Conclusions References
Tables Figures
◭ ◮
◭ ◮
Back Close
Full Screen / Esc
Printer-friendly Version
Interactive Discussion
Discussion
P
a
per
|
Dis
cussion
P
a
per
|
Discussion
P
a
per
|
Discussio
n
P
a
per
|
most likely nighttime loss processes. Currently there are no experimental kinetic data available for the NO3radical reaction with glyoxal and methylglyoxal
NO3+(HCO)2→Products (3)
NO3+CH3COCHO→Products (4)
At present, atmospheric chemistry models rely on estimated rate coefficient values for
5
Reactions (3) and (4) (Myriokefalitakis et al., 2008). In the present study, rate coeffi -cients for the reaction of the NO3radical with glyoxal and methylglyoxal are reported.
2 Experimental details
Rate coefficients for the gas-phase reaction of OH with CH3COCHO were measured as a function of temperature (211–373 K) and pressure (100–200 Torr in He and N2) 10
by producing OH via pulsed laser photolysis (PLP) and measuring its temporal profile using laser-induced fluorescence (LIF). Rate coefficients for the reactions of NO3with glyoxal (k3) and methylglyoxal (k4) were measured at 630 Torr and 296 K via a relative
rate technique using Fourier transform infrared spectroscopy (FTIR) to monitor the extent of reaction.k3(T) was also measured at 296 and 353 K in a flow tube reactor at 15
3–6 Torr that was coupled to a chemical ionization mass spectrometer (FT-CIMS). The experimental apparatus and methods used have been described in detail elsewhere (Talukdar et al., 1995, 2003; Vaghjiani and Ravishankara, 1989; Zhu et al., 2008). Here, we only present the essentials needed to understand the present work.
2.1 OH reaction rate coefficients
20
Rate coefficients were measured under pseudo-first-order conditions in OH, [OH]≪[CH3COCHO] using the PLP-LIF experimental apparatus. A schematic of the apparatus is provided in the supplementary material. The key components of the ap-paratus were (1) a temperature controlled reactor where OH was produced by pulsed
ACPD
11, 18211–18248, 2011Rate coefficients for methylglyoxal and
glyoxal reactions
R. K. Talukdar et al.
Title Page
Abstract Introduction
Conclusions References
Tables Figures
◭ ◮
◭ ◮
Back Close
Full Screen / Esc
Printer-friendly Version
Interactive Discussion
Discussion
P
a
per
|
Dis
cussion
P
a
per
|
Discussion
P
a
per
|
Discussio
n
P
a
per
|
laser photolysis and its temporal profile measured by laser-induced fluorescence, (2) pulsed lasers used to generate and detect OH, (3) a gas handling manifold, and (4) UV and infrared absorption setups to determine the methylglyoxal concentration on-line using UV absorption at 184.9 nm and Fourier transform infrared (FTIR) spectroscopy.
OH radicals were produced by the 248 nm pulsed laser (KrF, excimer laser)
photoly-5
sis of H2O2
H2O2+hν→2OH (5)
for kinetic measurements at temperatures≥255 K. For temperatures<255 K conden-sation of H2O2 interfered with the rate coefficient measurements. For kinetic
exper-iments performed at temperatures between 211 and 373 K OH was produced in the
10
248 nm pulsed photolysis oftert-butyl hydroperoxide, (CH3)3COOH
(CH3)3COOH+hν→products+OH (6)
Photolysis of HNO3 at 248 nm was also used in limited cases. The initial
OH radical concentration, [OH]0, was estimated to be in the range of (0.3– 2.7)×1011molecule cm−3based on the photolyte concentration, absorption cross
sec-15
tion and quantum yield, and the photolysis laser fluence (Baasandorj et al., 2010; Sander et al., 2006; Taylor et al., 2008). The OH radical was detected by fluores-cence following excitation in theA2Σ+(v=1)←X2Π(v=0) transition at 282 nm using the frequency doubled output from a pulsed Nd : YAG pumped dye laser (Vaghjiani and Ravishankara, 1989).
20
The OH decay obeyed the integrated rate expression
ln [OH]
t
[OH]0
=−(k1[CH3COCHO]+kd)t=−k′t (I)
where [OH]t is the OH concentration at timet andkd is the first-order rate coefficient
for OH loss in the absence of CH3COCHO, which is primarily due to reaction with the
OH precursor and diffusion out of the detection volume. k′was measured for a range
ACPD
11, 18211–18248, 2011Rate coefficients for methylglyoxal and
glyoxal reactions
R. K. Talukdar et al.
Title Page
Abstract Introduction
Conclusions References
Tables Figures
◭ ◮
◭ ◮
Back Close
Full Screen / Esc
Printer-friendly Version
Interactive Discussion
Discussion
P
a
per
|
Dis
cussion
P
a
per
|
Discussion
P
a
per
|
Discussio
n
P
a
per
|
of [CH3COCHO] at each temperature and pressure andk1(T) was determined from the
slope of k′ versus [CH3COCHO]. Typical values of kd were in the range 50–500 s−1
where the actual value depended on the OH precursor used and its concentration. Values ofkd measured in the absence of methylglyoxal were in excellent agreement
with those obtained from the intercept ofk′versus [CH3COCHO]. 5
Methylglyoxal was introduced into the PLP-LIF gas flow from dilute gas mixtures of methylglyoxal in He (0.5–2.0 %) that were prepared manometrically in darkened 12 l Pyrex bulbs at total pressures of∼1000 Torr. The methylglyoxal concentration in the LIF reactor was determined using the measured gas flow rate in addition to on-line optical absorption measurements. The UV absorption of methylglyoxal was measured
10
using an Hg Pen-Ray lamp light source, a 100 cm long (2.5 cm dia.) absorption cell, a 185 nm narrow band-pass filter, and a solar blind phototube detector. Infrared ab-sorption spectra were recorded between 500 and 4000 cm−1at a spectral resolution of 1 cm−1 using a Fourier transform spectrometer. A multi-pass absorption cell (485 cm optical path length, 550 cm3volume, and KBr windows) was used for all infrared
mea-15
surements. UV absorption was measured before the LIF reactor, while infrared absorp-tion spectra were measured either before or after the LIF reactor. The methylglyoxal concentration in the LIF reactor determined from the optical measurements was scaled for gas flow dilution and differences in temperature and pressure between the LIF re-actor and the absorption cells. The methylglyoxal concentration was varied over the
20
range (5–174)×1013molecule cm−3during the course of the kinetic measurements.
2.2 Absorption cross-section measurements
Infrared and UV (184.9 nm) absorption cross sections of CH3COCHO were determined
as part of this work. Cross sections of CH3COCHO at 296 K were determined using Beer’s law,A=Lσ[CH3COCHO], from a linear least-squares analysis of the measured 25
absorbance versus [CH3COCHO]. The infrared (IR) and ultraviolet (UV)
measure-ments were made simultaneously using a multi-pass cell (path length=485 cm) for IR and 100 cm path length for UV. The cells were connected in series and the gas flow
ACPD
11, 18211–18248, 2011Rate coefficients for methylglyoxal and
glyoxal reactions
R. K. Talukdar et al.
Title Page
Abstract Introduction
Conclusions References
Tables Figures
◭ ◮
◭ ◮
Back Close
Full Screen / Esc
Printer-friendly Version
Interactive Discussion
Discussion
P
a
per
|
Dis
cussion
P
a
per
|
Discussion
P
a
per
|
Discussio
n
P
a
per
|
velocity was varied as part of the measurements. Cross sections were measured both under static fill and flowing conditions with the CH3COCHO concentration determined
from absolute pressure measurements of manometrically prepared CH3COCHO/He
mixtures (0.5–2 %). At least 10 different CH3COCHO concentrations, varied over at least an order of magnitude, were used in the cross section determinations. No
dif-5
ference was observed at different flow velocities or the direction of the flow, which indicates no loss of methylglyoxal in the flow through the apparatus.
The absorption cross section of CH3COCHO at 184.9 nm was determined to be
(5.21±0.16)×10−18cm2molecule−1 where the error limit represents 2σ precision of the measurements.
10
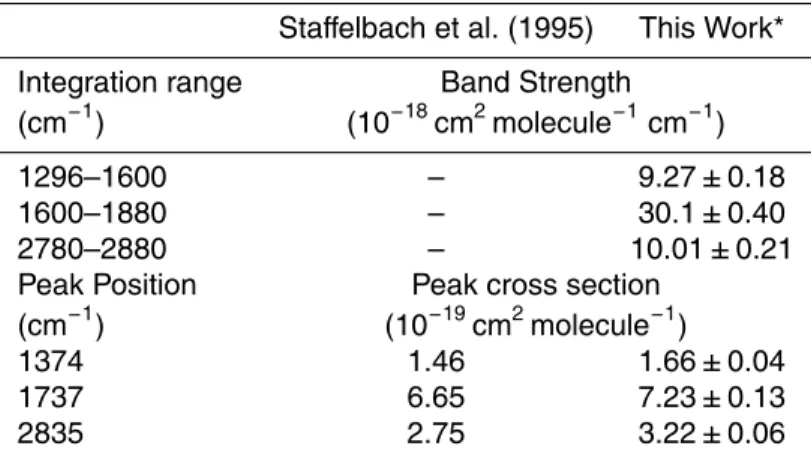
The infrared absorption spectrum of methylglyoxal agrees with those reported in earlier studies and is given in the supplementary information (Plum et al., 1983; Tua-zon and Atkinson, 1989). The infrared cross sections determined using methylglyoxal samples obtained from different synthesis agreed to within 2 %. The integrated band intensities and the peak cross sections obtained in this work are given in Table 1. The
15
methylglyoxal infrared cross sections obtained in this work are 8 to 15 % greater, de-pending on the spectral region, than those reported by Staffelbach et al. (1995).
2.3 NO3reaction rate coefficients
Two independent experimental techniques were used to determinek3 and k4 (a) an
absolute method using a flow tube reactor coupled to a chemical ionization mass
20
spectrometer (FT-CIMS) to measurek3at 296 and 353 K and (b) a relative rate
tech-nique using Fourier transform infrared spectroscopy (RR-FTIR) to measurek3and k4
at 296 K.
2.3.1 Flow tube – chemical ionization mass spectrometer (FT-CIMS) method
Details of the experimental apparatus is given in a previous publication from this
labo-25
ACPD
11, 18211–18248, 2011Rate coefficients for methylglyoxal and
glyoxal reactions
R. K. Talukdar et al.
Title Page
Abstract Introduction
Conclusions References
Tables Figures
◭ ◮
◭ ◮
Back Close
Full Screen / Esc
Printer-friendly Version
Interactive Discussion
Discussion
P
a
per
|
Dis
cussion
P
a
per
|
Discussion
P
a
per
|
Discussio
n
P
a
per
|
tube reactor was a 150 cm long Pyrex tube, 2.54 cm i.d., with a moveable injector. The outside of the moveable injector (120 cm long, 0.64 cm o.d.) was also coated with halo-carbon wax. The reaction zone of the flow tube was∼50 cm. The reaction time in the flow tube was between 16 and 85 ms; total gas flow rates of 10 to 25 STP cm3s−1 at pressures between 2 and 6 Torr. A chromel-alumel thermocouple, inserted through the
5
injector was used to measured the temperature of the gas in the reaction zone; the variation in the temperature along the reaction zone was≤1 K.
Rate coefficients were measured under pseudo-first-order conditions in NO3, [Glyoxal]/[NO3]0∼1000, with NO3 radicals produced by the thermal decomposition of
N2O5 at 400 K (Rudich et al., 1996). NO3 was introduced either through the moveable 10
injector or through a side arm into the flow tube. The initial NO3radical concentration in the flow tube was in the range (1–5)×1011molecule cm−3. Glyoxal was added to the flow tube opposite to the NO3addition point.
The effluent of the flow tube passed through a Pyrex valve into the ion flow tube, at ∼0.5 Torr, approximately 50 cm downstream of the ionization source. N2O5 and NO3 15
were detected by a quadrupole mass spectrometer as NO3 −
following their reaction with I−reagent ion.
The variation of NO3 concentration with the relative injector position was used to
derive the pseudo-first-order rate coefficient,k′, which was measured at various glyoxal concentrations to obtaink3
20
k′
=k3[(CHO)2]+kw (II)
wherekwrepresents the pseudo-first-order wall loss of NO3. A linear least-squares fit
ofk′vs. [glyoxal] yielded the second-order rate coefficient, k3, which was determined
at 296 and 353 K.
2.3.2 Relative rate method (RR-FTIR)
25
A relative rate method was used to determinek3andk4using ethene (CH2=CH2) and
ACPD
11, 18211–18248, 2011Rate coefficients for methylglyoxal and
glyoxal reactions
R. K. Talukdar et al.
Title Page
Abstract Introduction
Conclusions References
Tables Figures
◭ ◮
◭ ◮
Back Close
Full Screen / Esc
Printer-friendly Version
Interactive Discussion
Discussion
P
a
per
|
Dis
cussion
P
a
per
|
Discussion
P
a
per
|
Discussio
n
P
a
per
|
interest, R, and a reference compound (Ref) are removed solely by reaction with NO3
NO3+R→products, kR (7)
NO3+Ref→products, kRef (8)
the ratio of their reaction rate coefficients,kR/kRef, is given by
kR
kRef
= ln([R]0/[R]t)
ln([Ref]0/[Ref]t)
(III)
5
where the subscripts 0 andt refer to the initial reactant concentration and its concen-tration at time t. The slope of ln([R]0/[R]t) vs. ln([Ref]0/[Ref]t) yields kR/kRef from whichkRis determined providedkRefis known.
Experiments were carried out in a 22 l Pyrex reactor under dark conditions at 296 K. Experiments were performed by first adding N2O5to the reactor by flowing zero air over
10
a solid N2O5sample at 230 K. The reactant and reference compounds were then added to the reactor from dilute mixtures; 0.1 % ethene/N2, 2–6 % glyoxal/He or 2 %
methyl-glyoxal/He. Synthetic air was then added to bring the reactor total pressure to 630 Torr. The initial concentrations in the reactor were: [N2O5]∼3.0×10¹⁵molecule cm−3, and [CH2=CH2], [glyoxal] or [methylglyoxal] of∼1×10
15
molecule cm−3.
15
NO3radicals were produced in situ by the thermal decomposition of N2O5
NO3+NO2+M↔N2O5+M (9)
where k−9(296 K, 630 Torr)=0.04 s −1
and Keq(296 K)=2.9×10 −11
cm3molecule−1 (Sander et al., 2006). The reaction was monitored by periodically transferring a portion of the reaction mixture from the reactor into the multi-pass absorption cell of the FTIR.
20
ACPD
11, 18211–18248, 2011Rate coefficients for methylglyoxal and
glyoxal reactions
R. K. Talukdar et al.
Title Page
Abstract Introduction
Conclusions References
Tables Figures
◭ ◮
◭ ◮
Back Close
Full Screen / Esc
Printer-friendly Version
Interactive Discussion
Discussion
P
a
per
|
Dis
cussion
P
a
per
|
Discussion
P
a
per
|
Discussio
n
P
a
per
|
2.4 Materials
He (UHP, 99.999 %), N2 (UHP, >99.99 %), and O2 (UHP, >99.99 %) were used as
supplied. Concentrated H2O2 (>95 %) was prepared by bubbling N2for several days
through a sample initially at 60 wt%. A small flow of bath gas was passed through the H2O2 bubbler, which was then diluted by the main bath gas flow before entering 5
the reactor. The H2O2reservoir was kept at 273 K during the kinetic measurements to
avoid condensation of H2O2in the reactor. Atert-butylhydroperoxide solution (70 % in water) was degassed and used without further purification. A small flow of N2 or He
bath gas was bubbled through the solution at 273 K to sweeptert-butylhydroperoxide into the main gas flow. N2O5 was synthesized by the reaction of ozone with NO2 as
10
described elsewhere (Papadimitriou et al., 2011; Rudich et al., 1996).
Methylglyoxal samples were prepared from commercial 40 % aqueous solutions. A 25 ml aliquot of the solution was transferred into a 500 ml round bottom flask partially filled with small pieces of glass tubes. The flask was kept in the dark and pumped on for 16–20 h to remove water. The remaining viscous liquid was then covered with∼6 g
15
of P2O5 and heated to 50–60◦C. A yellow oily liquid was collected in a trap at−78◦C for ∼5 min. The distillate was then pumped on for approximately one hour with the sample at dry ice temperature. The trap was then quickly warmed to∼283 K and the volatile impurities, such as formaldehyde, were pumped offand the sample re-cooled to dry ice temperature. This process was repeated three times. No FTIR detectable
20
impurities were observed in the final sample. A formaldehyde impurity upper limit was estimated to be<1 %. Dilute mixtures of methylglyoxal in a He bath gas (0.5–2 %) were prepared in a darkened 12 l Pyrex bulb. The dilute gas mixture composition was tested periodically using FTIR and found to be stable for a period of several weeks. After∼3 weeks of storage weak unidentified infrared absorption peaks in the range
25
800–1000 cm−1were observed.
Glyoxal monomer was prepared from the solid trimer-dihydrate using the meth-ods described elsewhere (Volkamer et al., 2005; Feierabend et al., 2008). The
ACPD
11, 18211–18248, 2011Rate coefficients for methylglyoxal and
glyoxal reactions
R. K. Talukdar et al.
Title Page
Abstract Introduction
Conclusions References
Tables Figures
◭ ◮
◭ ◮
Back Close
Full Screen / Esc
Printer-friendly Version
Interactive Discussion
Discussion
P
a
per
|
Dis
cussion
P
a
per
|
Discussion
P
a
per
|
Discussio
n
P
a
per
|
vapor pressure of glyoxal and methylglyoxal were measured to be ∼0.03 Torr (∼1.5×10¹⁵molecule cm−3) and 0.016 Torr (∼8.0×10¹⁴molecule cm−3), respectively, at 195 K.
Gas flow velocities through the reaction zone in the LIF reactor were in the range 6–15 cm s−1, which ensured a fresh gas mixture for each photolysis laser pulse. Gas
5
flows were measured using calibrated electronic mass flow meters. Pressures were measured using calibrated 10, 100, and 1000 Torr capacitance manometers. The pho-tolysis and probe lasers were operated at 10 Hz.
3 Results and discussion
Rate coefficients for the OH reaction with methylglyoxal, k1(T), and the NO3 reaction 10
with glyoxal (k3) and methylglyoxal (k4) are presented separately below.
3.1 OH+CH3COCHO
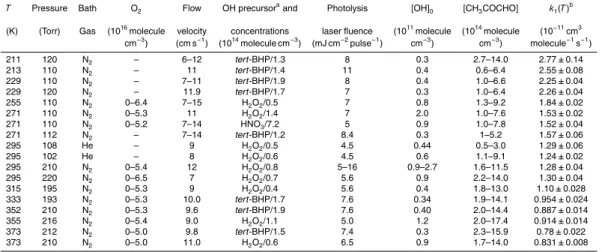
A summary of the experimental conditions used in our rate coefficient measurements and the obtained k1(T) values are given in Table 2. A potential complication in the rate coefficient measurement of Reaction (1) arises due to the unavoidable formation
15
of the CH3CO radical as a secondary reaction product. The CH3CO radical is known
to react with O2 to produce OH radicals as a reaction product (Baeza-Romero et al.,
2007; Tyndall et al., 1995)
CH3CO+O2+M→OH+Products (10a)
→CH3C(O)O2+M (10b)
20
which could possibly influence the determination ofk1(T) under certain conditions. In
ACPD
11, 18211–18248, 2011Rate coefficients for methylglyoxal and
glyoxal reactions
R. K. Talukdar et al.
Title Page
Abstract Introduction
Conclusions References
Tables Figures
◭ ◮
◭ ◮
Back Close
Full Screen / Esc
Printer-friendly Version
Interactive Discussion
Discussion
P
a
per
|
Dis
cussion
P
a
per
|
Discussion
P
a
per
|
Discussio
n
P
a
per
|
of OH was observed, as expected, in test experiments performed with and without O2 added to the reaction mixture. OH radical temporal profiles measured at low pressure (20–50 Torr, He) were found to be non-exponential indicating regeneration of OH on the time scale of the measurement. The measured OH temporal profiles were exponential within the precision of the measurement when∼2 Torr of O2was added to the reaction 5
mixture. The measured pseudo-first-order rate coefficient in the presence of O2 was,
however, ∼13 % less at 50 Torr (He) than that obtained in the absence of added O2. This is consistent with∼13 % OH generation via Reaction (10). We assume that the non-exponential behavior observed in the absence of added O2 may in part be due
to a small O2 impurity in the system. At greater bath gas pressure, >100 Torr N2,
10
the OH temporal profiles were exponential, with and without added O2, and yielded indistinguishable pseudo-first-order decay rate coefficients, within the precision of the measurement (∼2 %). This was the case over the entire temperature range, 211– 373 K, included in our study. The rate coefficients for Reaction (1) reported in this work were measured at total pressures>100 Torr where OH regeneration was negligible.
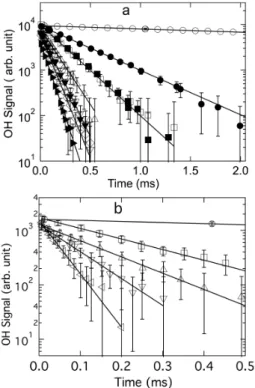
15
Figure 2 shows representative OH temporal profiles measured at 295 K in 210 Torr N2 and at 211 K in 120 Torr N2 obtained while using 248 nm photolysis of H2O2 and
tert-butyl hydroperoxide, respectively, as the OH radical source. The OH temporal profiles were measured with high precision over two order of magnitude decay in the OH signal in most cases.
20
Figure 3 summarizes the k′ data obtained for a range of experimental conditions at temperatures between 211 and 373 K. The pseudo-first-order rate coefficients ob-tained with both OH radical sources were observed to be linearly dependent on [CH3COCHO] at all temperatures. k1 was obtained at each temperature by fitting
all measured (k′−kd) values versus [CH3COCHO] together using an un-weighted 25
linear least-squares analysis. The room temperature rate coefficient obtained was k1(295 K)=(1.29±0.05)×10
−11
cm3molecule−1s−1 where the quoted uncertainty is the 2σ (95 % confidence level) precision of the fit. The measured rate coefficients were independent of the bath gas (He or N2) and total pressure, over the range 100–
ACPD
11, 18211–18248, 2011Rate coefficients for methylglyoxal and
glyoxal reactions
R. K. Talukdar et al.
Title Page
Abstract Introduction
Conclusions References
Tables Figures
◭ ◮
◭ ◮
Back Close
Full Screen / Esc
Printer-friendly Version
Interactive Discussion
Discussion
P
a
per
|
Dis
cussion
P
a
per
|
Discussion
P
a
per
|
Discussio
n
P
a
per
|
220 Torr. The measured rate coefficients were also independent of [OH]0, varied by a factor of ∼7, concentrations of OH precursors by a factor of ∼2, and photolysis laser fluence by a factor of ∼3. The k1(T) values obtained at each temperature are
given in Table 2 and plotted in Fig. 4. A weighted linear least-squares fit of k1(T) to
the Arrhenius equation, ln(k1(T))=ln(A)−E/(RT), yieldedk1(T)=(1.74±0.09)×10 −12 5
exp((590±12)/T) cm3molecule−1s−1 where the quoted uncertainties are the 2σ pre-cision of the fit andσA=A σlnA.
3.1.1 Uncertainty evaluations
The absolute uncertainty in the measured rate coefficients originates from uncertain-ties in the measurement parameters, precision of the rate coefficient determinations,
10
and potential systematic errors. Uncertainties arising from the pressure, temperature and flow rate measurements were small and contribute less than 2 % to the overall uncertainty in [CH3COCHO]. The precision of thek1(T) measurements was very high
with the error in the fits of the data to Eq. (I) being<5 % at 95 % confidence level. A potential source of systematic error in our experiments involves the determination
15
of the CH3COCHO concentration in the reactor. The uncertainty in the infrared and the
UV absorption cross sections of methylglyoxal determined in this work was estimated to be∼5 % at the 95 % confidence level. We estimate the uncertainty of [CH3COCHO] in the reactor to be 8 %. The CH3COCHO concentration determined using FTIR before
and after the reactor were in excellent agreement, <2 %, at all temperatures. This
20
indicates that there was no measurable loss of methylglyoxal in the reactor due to decomposition at high temperature or condensation at low temperature. The measured first-order rate coefficients,k′, showed a linear dependence on [CH3COCHO], even at
the lowest temperature in our experiments (see Fig. 3). This observation confirmed that dimerization of methylglyoxal, if any, which would most likely appear as a
non-25
linear behavior ofk′ vs. [CH3COCHO], did not influence the kinetic measurement.
ACPD
11, 18211–18248, 2011Rate coefficients for methylglyoxal and
glyoxal reactions
R. K. Talukdar et al.
Title Page
Abstract Introduction
Conclusions References
Tables Figures
◭ ◮
◭ ◮
Back Close
Full Screen / Esc
Printer-friendly Version
Interactive Discussion
Discussion
P
a
per
|
Dis
cussion
P
a
per
|
Discussion
P
a
per
|
Discussio
n
P
a
per
|
the determination ofk1. The most likely impurities generated during the synthesis of
methylglyoxal were CO (∼2×10⁻¹³cm3molecule−1s−1at 298 K and 200 Torr N2) and formaldehyde, H2CO (9×10
−12
cm3molecule−1s−1) where their OH reaction rate co-efficients are given in parenthesis. CO, H2CO, and other unidentified volatile impurities
were removed from the sample by pumping on the methylglyoxal sample until their
5
levels were below the FTIR detectable limit, as discussed earlier. At these levels CO and H2CO would not contribute significantly to the measured loss of OH at the
tem-peratures included in this work. There was no significant loss of methylglyoxal in the prepared mixtures over a period of 3 weeks. In addition, the rate coefficients obtained with the older mixtures were identical, within the uncertainty of the measurements, to
10
the values obtained with freshly prepared samples.
The absolute uncertainty in k1 is estimated to be 10 % at the 95 %
confi-dence level. Including the systematic error in the rate coefficient values yields k1(298 K)=(1.26±0.13)×10
−11
cm3molecule−1s−1 and k1(T)=(1.74±0.20)×10 −12
exp((590±40)/T) cm3molecule−1s−1.
15
3.1.2 Comparison with previous studies
A summary of previous Reaction (1) rate coefficient results along with the parameters determined in this work is given in Table 3. The rate coefficient data from the previous studies, which extend over the temperature range 223–500 K, are included in Fig. 4 for comparison with the present work. The k1(298 K) values reported by Baezo-Romero 20
et al. (2007) and Tyndall et al. (1995) are in good agreement with our results, while Plum et al. (1983) report a value that is∼30 % greater. The rate coefficient measured by Kleindienst et al. (1982) at 297 K is roughly a factor of 2 less than that reported here. The presence of significant levels of low reactivity impurities in their samples could have lead to lower measured rate coefficients. However, in the absence of a sample
25
analysis, it is not clear why their k1 value is significantly lower than obtained in the
present work.
ACPD
11, 18211–18248, 2011Rate coefficients for methylglyoxal and
glyoxal reactions
R. K. Talukdar et al.
Title Page
Abstract Introduction
Conclusions References
Tables Figures
◭ ◮
◭ ◮
Back Close
Full Screen / Esc
Printer-friendly Version
Interactive Discussion
Discussion
P
a
per
|
Dis
cussion
P
a
per
|
Discussion
P
a
per
|
Discussio
n
P
a
per
|
Baeza-Romero et al. (2007) and Tyndall et al. (1995) have reported on the tempera-ture dependence of Reaction (1). The data of Baeza-Romero et al. are in reasonable agreement with the present work, in the overlapping temperature range, but show more scatter. Their data for temperatures>366 K deviate greatly from their rest of the data, see Fig. 4. The larger scatter may in part be the result of the method used to extract
5
values ofk1 from bi-exponential fits of their measured non-exponential OH temporal
profiles. Bi-exponential fitting of simulated OH temporal profiles, under their conditions, confirmed that a larger uncertainty in the returned values ofk1should be expected. On
the other hand, the Arrhenius parameters reported by Baeza-Romero et al. agree very well with those derived from our data (Table 3).
10
The rate coefficient values reported by Tyndall et al. (1995) below 298 K are sys-tematically greater than obtained in this work, leading to a substantially larger nega-tive value of E/R. Tyndall et al. reported observing reversible sticking of methylglyoxal on the walls of their flow tube at temperatures<298 K, although it is not clear if this would account for the difference in the rate coefficients at low temperatures. Tyndall
15
et al. (1995) reported a value ofk1(298 K) at low pressure (2–3 Torr) that agrees well
with the present work and the Baeza-Romero et al. (2007) value. The agreement in k1(298 K) over a broad range of pressure, 2–200 Torr, implies that there is no pressure
dependence of Reaction (1) under relevant atmospheric conditions.
Galano et al. (2004) calculatedk1(T) using quantum chemistry and canonical vari-20
ational transition state theory including small curvature tunneling and their values are included in Table 3 for comparison with the experimental results. The theoretically calculated value fork1(298 K), 1.35×10
−11
cm3molecule−1s−1, is in excellent agree-ment with that determined in this work and reported by Tyndall et al. (1995) and Baeza-Romero et al. (2007) (Table 2 and Fig. 4). However, the theoretically
cal-25
ACPD
11, 18211–18248, 2011Rate coefficients for methylglyoxal and
glyoxal reactions
R. K. Talukdar et al.
Title Page
Abstract Introduction
Conclusions References
Tables Figures
◭ ◮
◭ ◮
Back Close
Full Screen / Esc
Printer-friendly Version
Interactive Discussion
Discussion
P
a
per
|
Dis
cussion
P
a
per
|
Discussion
P
a
per
|
Discussio
n
P
a
per
|
et al. at temperatures <298 K, we obtain, by weighted fit, the Arrhenius expression k1(T)=(1.82±0.33)×10
−12
exp[(577±50)/T] cm3molecule−1s−1. The errors are at the 95 % confidence interval. Figure 4 includes the estimated error range in k1(T)
calculated with the expression used in the NASA/JPL evaluation, (Sander et al., 2006) f(T)=f(298K) expg T1−2981
, wheref(298 K) is the uncertainty in the rate coefficient
5
at 298 K, andgis an additional uncertainty term to account for increased uncertainty at temperatures other than 298 K. We recommend 2σ values of f(298 K)=1.10 and g=40.
All available studies of Reaction (1) report negative temperature dependence fork1.
The temperature dependence is slightly larger than reported for the reaction of OH
10
with aliphatic aldehydes, e.g. E/R=−330 K for the OH+CH3CHO reaction at temper-atures <300 K. Unlike glyoxal, which exhibits a weak non-Arrhenius behavior (Feier-abend et al., 2008), Reaction (1) follows an Arrhenius behavior, within the precision of the measurements, over the temperature range 211–373 K. The negative temperature dependence is consistent with Reaction (1) proceeding via a hydrogen-bonded
pre-15
reactive complex (Smith and Ravishankara, 2002). Theoretical calculations (Galano et al., 2004) found a reaction mechanism involving the formation of six- and seven-membered hydrogen-bonded adducts, [CH3COCHO...OH]
∗
, as reaction intermediates in the H atom abstraction from the –CHO and –CH3 groups, respectively. Galano
et al. calculated the stabilization energies of the adducts for H abstraction from the
20
–CHO and –CH3groups to be−3.28 and−2.82 kcal mol −1
, respectively. Although the stabilization energies of the adducts are very close, the calculated overall activation energy for aldehydic H-atom abstraction is negative (−2.39 kcal mol−1), while that for H-atom abstraction from –CH3group is substantially positive (3.65 kcal mol
−1
), leading to the former being the most probable pathway for reaction (Galano et al., 2004). The
25
fraction of H atom abstraction from –CH3 group could contribute at most∼1 % of k1
based on a comparison of the rate coefficients for the OH+CH3COCH3(acetone)
reac-tion,k(298 K)=1.8×10⁻¹³cm3molecule−1s−1, to that of the OH+CH3CHO reaction,
k(298 K)=1.5×10⁻¹¹cm3molecule−1s−1. In summary, experimental and theoretical
ACPD
11, 18211–18248, 2011Rate coefficients for methylglyoxal and
glyoxal reactions
R. K. Talukdar et al.
Title Page
Abstract Introduction
Conclusions References
Tables Figures
◭ ◮
◭ ◮
Back Close
Full Screen / Esc
Printer-friendly Version
Interactive Discussion
Discussion
P
a
per
|
Dis
cussion
P
a
per
|
Discussion
P
a
per
|
Discussio
n
P
a
per
|
results point to the formation of a pre-reactive complex and the abstraction of aldehydic H atom in Reaction (1) leading to the observed negative activation energy.
3.2 NO3rate coefficients
3.2.1 NO3+Glyoxal
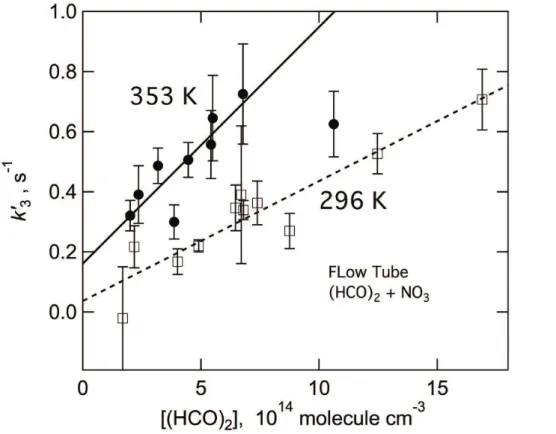
Figure 5 shows the measured values of k′ as a function of [glyoxal] obtained at
5
296 and 353 K using the absolute flow tube kinetic method. The measured pseudo-first-order rate coefficients, k′, are small, i.e., the rate coefficients for this reac-tion are small. The wall loss of NO3 was 1–2 s
−1
. The k3 values obtained are
k3(296 K)=(4.2±0.8)×10 −16
and k3(353 K)=(7.9±3.6)×10 −16
cm3molecule−1s−1, which show an increase in reactivity with increasing temperature that is consistent with
10
an abstraction reaction mechanism. However, due to the large uncertainty ink3(353 K),
the temperature dependence ofk3(T) is not well established and it is not advisable to
calculate the activation energy from these data points.
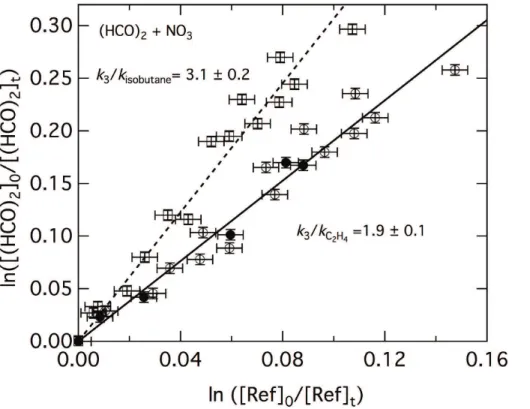
Figure 6 shows the results from the relative rate data for Reaction (3) with CH2=CH2 as the reference compound. The rate coefficient ratio, k3/kRef, obtained 15
from a linear least-squares fit of the data to Eq. (III) is 1.9±0.2, which yields k3(296 K)=(4.0±1.0)×10
−16
cm3molecule−1s−1. The possible formation of HO2
rad-icals in the presence of NO3 would lead to the formation of OH radicals, so
experi-ments were also performed with an OH radical scavenger added to the reaction mix-ture. CF3CF=CHF, 1.7×10¹⁶molecules cm−3, was used as the OH scavenger due to
20
its slow reaction with NO3
OH+CF3CF=CHF→Productsk(298K)=1.3×10⁻¹²cm3molecule−1s−1
(Papadimitriou et al.,2008) (11)
NO3+CF3CF=CHF→Productsk(295K)=4.2×10⁻¹⁸cm3molecule−1s−1
(Papadimitriou et al.,2011) (12)
ACPD
11, 18211–18248, 2011Rate coefficients for methylglyoxal and
glyoxal reactions
R. K. Talukdar et al.
Title Page
Abstract Introduction
Conclusions References
Tables Figures
◭ ◮
◭ ◮
Back Close
Full Screen / Esc
Printer-friendly Version
Interactive Discussion
Discussion
P
a
per
|
Dis
cussion
P
a
per
|
Discussion
P
a
per
|
Discussio
n
P
a
per
|
The measuredk3was identical to that obtained in the absence of CF3CF=CHF, which
indicates that secondary OH radical chemistry did not influence the determination of k3.
Experiments were performed usingiso-butane as the reference compound to evalu-ate the possible interference of NO2and N2O5reaction with the unsaturated CH2=CH2 5
reference compound. NO2is known to react slowly with conjugated dialkenes (Barnes
et al., 1990), while it is possible that N2O5 may react with alkenes. Therefore, k3 was measured relative to iso-butane, a saturated hydrocarbon that is not likely to react with N2O5 or NO2. The ratio of k3/kiso−butane was determined to be 3.0±0.2, which
yieldsk3=(3.3±0.85)×10 −16
cm3molecule−1s−1, which agrees, within the
measure-10
ment uncertainty, withk3 obtained using C2H4 as the reference. The apparatus and
methods were also tested by measuring the rate coefficient ratios for the reaction of NO3 with CH2=CH2 and iso-butane. The measured rate coefficient ratio for the
re-actions of CH2=CH2 and iso-butane with NO3 was 1.53±0.38. The measured ratio
is lower than the recommended literature rate coefficient ratio of 1.91±0.50, but falls
15
within the current estimated uncertainties for these relatively slow reactions (Atkinson et al., 2006; Barnes et al., 1990; Canosa-Mas et al., 1988). Thus, it appears that there was no significant interference from the reactions of NO2or N2O5in our experiments.
3.2.2 NO3+Methylglyoxal
k4 was measured using the relative rate technique with CH2=CH2 as the refer-20
ence compound. Two sets of experiments were performed, using different methyl-glyoxal samples, with CF3CF=CHF, 1.7×10
16
molecule cm−3, added as an OH rad-ical scavenger. The experimental results are shown in Fig. 7. The rate coeffi -cient ratios, k4/kRef, were determined from a linear least-squares fit of the data to Eq. (III) to be 2.9±0.5 and 1.9±0.20, where the quoted error limits are 2σ
25
from the precision of the fit. Taking an average rate coefficient ratio of 2.4±1.0 yieldsk4(295 K)=(5.1±2.1)×10−
16
cm3molecule−1s−1. The agreement between the two experiments is rather poor when compared with the results obtained in the
ACPD
11, 18211–18248, 2011Rate coefficients for methylglyoxal and
glyoxal reactions
R. K. Talukdar et al.
Title Page
Abstract Introduction
Conclusions References
Tables Figures
◭ ◮
◭ ◮
Back Close
Full Screen / Esc
Printer-friendly Version
Interactive Discussion
Discussion
P
a
per
|
Dis
cussion
P
a
per
|
Discussion
P
a
per
|
Discussio
n
P
a
per
|
glyoxal+NO3 reaction study given above. There is no explanation for the less re-producible results in the methylglyoxal experiments. The total reactant and reference compound losses (10–40 %) were relatively small over long time duration (4 h), which led to greater uncertainty in the measured rate coefficients.
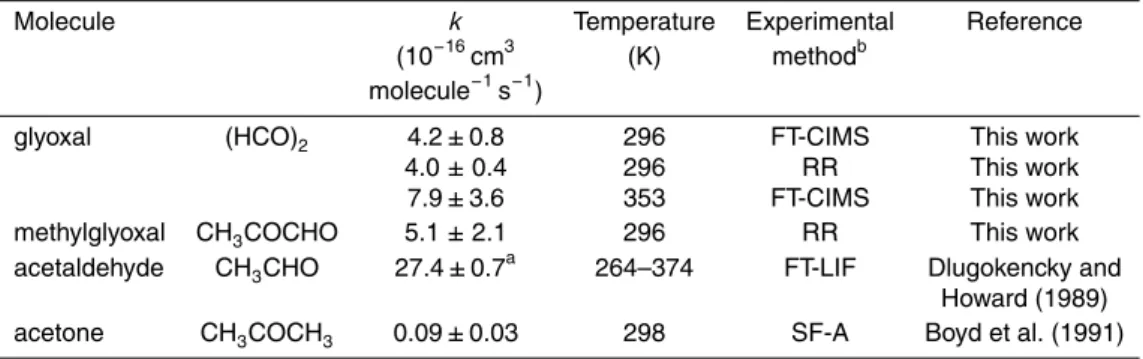
3.2.3 Comparison of NO3rate coefficients
5
Rate coefficients for the reaction of NO3with glyoxal and methylglyoxal have not been
reported previously. So here, we compare the present results with rate coefficients reported for aldehydes and ketones. The measured values ofk3andk4from this work
along with the rate coefficients for the acetaldehyde (CH3CHO) and acetone reactions
are listed in Table 4.
10
k3 and k4 are slow and similar in magnitude, k3 is ∼20 % less than k4. That is,
although, glyoxal has two identical –C(O)H groups, its reactivity is actually slightly less than that of methylglyoxal. The reactivity could be attributed to the mutual deactivation of the aldehydic H atom reactivity by the adjacent electron withdrawing –C=O groups in glyoxal. The presence of the –CH3 group in methylglyoxal may offset the electron 15
withdrawing of theα-carbonyl group thereby making the aldehydic H atom in methyl-glyoxal more reactive. This could, in part, account for the similar reactivity observed for glyoxal and methylglyoxal.
k3 and k4 are a factor of 5–7 less than the NO3+acetaldehyde reaction rate
coef-ficient and, therefore, does not follow the same trend as in the OH radical reactivity.
20
The room temperature OH rate coefficients of glyoxal and methylglyoxal are ∼40 % and∼13 % less than that of acetaldehyde, which is 1.5×10⁻¹¹cm3molecule−1s−1 at 298 K. Based on the C-H bond energies for the –C(O)H group alone, the rate coeffi -cients for the reaction of NO3 radical with glyoxal and methylglyoxal would be greater than in acetaldehyde reaction. The estimated C–H bond energies of the –C(O)H group
25
ACPD
11, 18211–18248, 2011Rate coefficients for methylglyoxal and
glyoxal reactions
R. K. Talukdar et al.
Title Page
Abstract Introduction
Conclusions References
Tables Figures
◭ ◮
◭ ◮
Back Close
Full Screen / Esc
Printer-friendly Version
Interactive Discussion
Discussion
P
a
per
|
Dis
cussion
P
a
per
|
Discussion
P
a
per
|
Discussio
n
P
a
per
|
most likely site for H atom abstraction because the C–H bond energy in the –CH3 group (95.9 kcal mol−1) is much greater and the barrier for H-abstraction from the – CH3group is higher,∼7 kcal mol
−1
compared to∼3 kcal mol−1from the -C(O)H group (D’Anna et al., 2003). For acetone, abstraction of H from the CH3group (–C–H bond energy=96.4±1.0 kcal mol−1) (Espinosa-Garcia et al., 2003) is the only reaction
path-5
way and is much slower than that from an aldehyde group –C(O)H group. Based on the thermochemical data, the major pathway in the reaction of NO3with methylglyoxal and acetaldehyde is expected to be abstraction of H from aldehydic group rather than from the –CH3group. Another factor that can influence the trend in the reactivity is the
steric effect due to the much larger size of NO3 radical compared to that of OH and
10
could alter the reactivity trend. At present, it is not clear whyk3 and k4 are
substan-tially less than the NO3+acetaldehyde rate coefficient. High-level quantum chemistry
calculations may shed some light on the reactivity trend of NO3radical with dicarbonyls and other aldehydes.
4 Atmospheric implications
15
The primary atmospheric loss processes of methylglyoxal include reaction with the OH radical, UV/vis photolysis, and uptake on clouds and aerosols as outlined in Fig. 1. Dry deposition and reaction with Cl atoms are expected to be minor loss processes. Fu et al. (2008) calculated the lifetime for methylglyoxal due to uptake on cloud and aerosol to be ∼17 h using the uptake coefficient for methylglyoxal on sulfuric acid solutions
20
(50–85 weight percent, T: 250–298 K) of 2.3×10⁻³ reported by Zhao et al. (2006). Fu et al. (2008) also calculated the global lifetime due to UV/vis photolysis and OH reaction to be 2.2 and 20 h, respectively. They also report a negligible effect of the NO3 reaction on the atmospheric loss of methylglyoxal, even though a greater value
ofk3 than measured in the present work was used in their analysis (Fu et al., 2008; 25
Myriokefalitakis et al., 2008). Using the rate coefficient data from this work we estimate the lifetime with respect to NO3radical reactive loss would be∼9 d, assuming∼100 ppt
ACPD
11, 18211–18248, 2011Rate coefficients for methylglyoxal and
glyoxal reactions
R. K. Talukdar et al.
Title Page
Abstract Introduction
Conclusions References
Tables Figures
◭ ◮
◭ ◮
Back Close
Full Screen / Esc
Printer-friendly Version
Interactive Discussion
Discussion
P
a
per
|
Dis
cussion
P
a
per
|
Discussion
P
a
per
|
Discussio
n
P
a
per
|
NO3. The NO3 reaction, therefore, represents only a minor atmospheric loss process for methylglyoxal.
The loss of methylglyoxal due to the OH reaction leads to a null HOxproduction
cy-cle. The CH3C(O)CO radical, which is formed in channel 1a with a∼99 % yield (see the comparison section on OH reaction), decomposes promptly to CH3CO and CO 5
under atmospheric conditions in<15 µs (Green et al., 1990). CH3CO reacts with O2
to form the peroxyacetyl (PA) radical, CH3C(O)O2, which in turn reacts with NO2 to produce peroxyacetyl nitrate (PAN), CH3C(O)O2NO2. The NO reaction produces the
CH3C(O)O radical and eventually HOx. The atmospheric lifetime of PAN is
predom-inantly controlled by its temperature dependent thermal decomposition and therefore
10
highly altitude dependent. At altitudes>7 km PAN lifetimes can exceed several months. Thus, methylglyoxal, which has a short lifetime, leads to the formation of PAN, which is potentially much longer lived and can be transported longer distances and, therefore, impact atmospheric chemistry in remote locations. The PAN yield from this degra-dation mechanism will depend on the rate coefficients of the PA radical with NO and
15
NO2, which are 2.0×10 −11
cm3molecule−1s−1 and 1.2×10⁻¹¹cm3molecule−1s−1 at 298 K and atmospheric pressure, and the NO2/NO ratio (Atkinson et al., 2006). Plum et al. (1983) has qualitatively observed the formation of PAN following the irradiation of a mixture of methylglyoxal-NOx-air using a solar simulator, but quantitative yields are
currently not available.
20
UV/vis photolysis of methylglyoxal leads to a net production of HOx because HOx
is not consumed in the initial methylglyoxal destruction step. PAN is also formed fol-lowing photolysis of methylglyoxal via the same mechanism described above. The NO3 reaction contributes negligibly (<1 %) to the loss of methylglyoxal, but would be
a nighttime source of PAN. Uptake of methylglyoxal in clouds and aerosol would lead
25
ACPD
11, 18211–18248, 2011Rate coefficients for methylglyoxal and
glyoxal reactions
R. K. Talukdar et al.
Title Page
Abstract Introduction
Conclusions References
Tables Figures
◭ ◮
◭ ◮
Back Close
Full Screen / Esc
Printer-friendly Version
Interactive Discussion
Discussion
P
a
per
|
Dis
cussion
P
a
per
|
Discussion
P
a
per
|
Discussio
n
P
a
per
|
The global lifetime of glyoxal due to loss via UV/visible photolysis, OH reaction, and uptake on cloud and aerosol are reported to be 4.9, 20, and 20 h, respectively (Chen et al., 2000; Fu et al., 2008; Staffelbach et al., 1995). An atmospheric modeling study, based on an estimated rate coefficient for the NO3+glyoxal reaction greater than ob-tained in this work, showed this loss process to be negligible (Fu et al., 2008). On the
5
basis of the rate coefficient measured in this work the estimated glyoxal lifetime due to NO3reaction is∼12 d for an NO3 abundance of 100 pptv. The NO3reaction would contribute<1 % to the total loss of glyoxal.
Supplementary material related to this article is available online at: http://www.atmos-chem-phys-discuss.net/11/18211/2011/
10
acpd-11-18211-2011-supplement.pdf.
Acknowledgements. This work was funded in part by NOAA’s Health of the Atmosphere Program.
References
Atkinson, R., Baulch, D. L., Cox, R. A., Crowley, J. N., Hampson, R. F., Hynes, R. G.,
15
Jenkin, M. E., Rossi, M. J., Troe, J., and IUPAC Subcommittee: Evaluated kinetic and photochemical data for atmospheric chemistry: Volume II – gas phase reactions of organic species, Atmos. Chem. Phys., 6, 3625–4055, doi:10.5194/acp-6-3625-2006, 2006.
Baasandorj, M., Papanastasiou, D. K., Talukdar, R. K., Hasson, A. S., and Burkholder, J. B.: (CH3)3COOH (tert-butyl hydroperoxide): OH reaction rate coefficients between 206 and
20
375 K and the OH photolysis quantum yield at 248 nm, Phys. Chem. Chem. Phys., 12, 12101–12111, doi:10.1039/c0cp00463d, 2010.
Baeza-Romero, M. T., Glowacki, D. R., Blitz, M. A., Heard, D. E., Pilling, M. J., Rickard, A. R., and Seakins, P. W.: A combined experimental and theoretical study of the reaction between methylglyoxal and OH/OD radical: OH regeneration, Phys. Chem. Chem. Phys., 9, 4114–
25
4128, 2007.
ACPD
11, 18211–18248, 2011Rate coefficients for methylglyoxal and
glyoxal reactions
R. K. Talukdar et al.
Title Page
Abstract Introduction
Conclusions References
Tables Figures
◭ ◮
◭ ◮
Back Close
Full Screen / Esc
Printer-friendly Version
Interactive Discussion
Discussion
P
a
per
|
Dis
cussion
P
a
per
|
Discussion
P
a
per
|
Discussio
n
P
a
per
|
Barnes, I., Bastian, V., Becker, K. H., and Tong, Z.: Kinetics and products of the reactions of NO3with monoalkenes, dialkene and monoterpenes, J. Phys. Chem., 94, 2413–2419, 1990. Boyd, A. A., Canosa-Mas, C. E., King, A. D., Wayne, R. P., and Wilson, M. R.: Use of a
stopped-flow technique to measure the rate constants at room temperature for reactions between the nitrate radical and various organic species, J. Chem. Soc. Faraday T., 87, 2913–2919, 1991.
5
Canosa-Mas, C., Smith, S. J., Toby, S., and Wayne, R. P.: Temperature dependences of the reactions of the nitrate radical with some alkynes and with ethylene, J. Chem. Soc. Faraday T., 2(84), 263–272, 1988.
Chen, Y., Wang, W., and Zhu, L.: Wavelength-dependent photolysis of methylglyoxal in the 290–440 nm region, J. Phys. Chem. A, 104, 11126–11131, 2000.
10
D’Anna, B., Bakken, V., Beukes, J. A., Nielsen, C. J., Brudnik, K., and Jodkowski, J. T.: Exper-imental and theoretical studies of gas phase NO3 and OH radical reactions with formalde-hyde, acetaldehyde and their isotopomers, Phys. Chem. Chem. Phys., 5, 1790–1805, 2003. Dlugokencky, E. J. and Howard, C. J.: Studies of NO3radical reactions with some atmospheric
organic compounds at low pressures, J. Phys. Chem., 93, 1091–1096, 1989.
15
Ervens, B. and Volkamer, R.: Glyoxal processing by aerosol multiphase chemistry: towards a kinetic modeling framework of secondary organic aerosol formation in aqueous particles, Atmos. Chem. Phys., 10, 8219–8244, doi:10.5194/acp-10-8219-2010, 2010.
Espinosa-Garcia, J., Marquez, A., and Dobe, S.: Theoretical enthalpy of formation of the acetonyl radical, Chem. Phys. Lett., 373, 350–356, doi:10.1016/s0009-2614(03)00551-7,
20
2003.
Feierabend, K. J., Zhu, L., Talukdar, R. K., and Burkholder, J. B.: Rate coefficients for the OH+HC(O)C(O)H (glyoxal) reaction between 210 and 390, J. Phys. Chem. A, 112, 73–82, 2008.
Feierabend, K. J., Flad, J. E., Brown, S. S., and Burkholder, J. B.: HCO quantum yields in
25
the photolysis of HC(O)C(O)H (glyoxal) between 290 and 420 nm, J. Phys. Chem. A, 113, 7784–7794, 2009.
Fu, T.-M., Jacob, D. J., Wittrock, F., Burrows, J. P., Vrekoussis, M., and Henze, D. K.: Global bud-gets of atmospheric glyoxal and methylglyoxal, and implications for formation of secondary organic aerosols, J. Geophys. Res.-Atmos., 113, D15303, doi:10.1029/2007JD009505,
30
2008.
methylgly-ACPD
11, 18211–18248, 2011Rate coefficients for methylglyoxal and
glyoxal reactions
R. K. Talukdar et al.
Title Page
Abstract Introduction
Conclusions References
Tables Figures
◭ ◮
◭ ◮
Back Close
Full Screen / Esc
Printer-friendly Version
Interactive Discussion
Discussion
P
a
per
|
Dis
cussion
P
a
per
|
Discussion
P
a
per
|
Discussio
n
P
a
per
|
oxal: a quantum chemistry+CVT/SCT approach, Chem. Phys. Chem., 5, 1379–1388, doi:10.1002/cphc.200400127, 2004.
Green, M., Yarwood, G., and Niki, H.: FTIR study of the Cl-atom initiated oxidation of methyl-glyoxal, Int. J. Chem. Kinet., 22, 689–699, 1990.
Grossmann, D., Moortgat, G. K., Kibler, M., Schlomski, S., Bachmann, K., Alicke, B., Geyer, A.,
5
Platt, U., Hammer, M. U., Vogel, B., Mihelcic, D., Hofzumahaus, A., Holland, F., and Volz-Thomas, A.: Hydrogen peroxide, organic peroxides, carbonyl compounds, and or-ganic acids measured at Pabstthum during BERLIOZ, J. Geophys. Res.-Atmos., 108, 8250, doi:10.1029/2001jd001096, 2003.
Ho, K. F., Lee, S. C., Cao, J. J., Kawamura, K., Watanabe, T., Cheng, Y., and Chow, J. C.:
10
Dicarboxylic acids, ketocarboxylic acids and dicarbonyls in the urban roadside area of Hong Kong, Atmos. Environ., 40, 3030–3040, doi:10.1016/j.atmosenv.2005.11.069, 2006.
Kleindienst, T. E., Harris, G. W., and Pitts, J. N.: Rates and temperature dependences of the reaction of OH with isoprene, its oxidation products, and selected terpenes, Environ. Sci. Technol., 16, 844–846, 1982.
15
Liggio, J. and McLaren, R.: An optimized method for the determination of volatile and semi-volatile aldehydes and ketones in ambient particulate matter, Int. J. Environ. Anal. Chem., 83, 819–835, 2003.
Moortgat, G. K., Grossmann, D., Boddenberg, A., Dallmann, G., Ligon, A. P., Turner, W. V., Gab, S., Slemr, F., Wieprecht, W., Acker, K., Kibler, M., Schlomski, S., and Bachmann, K.:
20
Hydrogen peroxide, organic peroxides and higher carbonyl compounds determined during the BERLIOZ campaign, J. Atmos. Chem., 42, 443–463, 2002.
Myriokefalitakis, S., Vrekoussis, M., Tsigaridis, K., Wittrock, F., Richter, A., Br ¨uhl, C., Volka-mer, R., Burrows, J. P., and Kanakidou, M.: The influence of natural and anthropogenic secondary sources on the glyoxal global distribution, Atmos. Chem. Phys., 8, 4965–4981,
25
doi:10.5194/acp-8-4965-2008, 2008.
Papadimitriou, V. C., Talukdar, R. K., Portmann, R. W., Ravishankara, A. R., and Burkholder, J. B.: CF3CF=CH2 and (Z)-CF3CF=CHF: temperature dependent OH rate coefficients and global warming potentials, Phys. Chem. Chem. Phys., 10, 808–820, doi:10.1039/b714382f, 2008.
30
Papadimitriou, V. C., Lazarou, Y. G., Talukdar, R. K., and Burkholder, J. B.: Atmospheric chemistry of CF3CF=CH2 and (Z)-CF3CF=CHF: Cl and NO3 rate coefficients, Cl reac-tion product yields, and thermochemical calculareac-tions, J. Phys. Chem. A, 115, 167–181,
ACPD
11, 18211–18248, 2011Rate coefficients for methylglyoxal and
glyoxal reactions
R. K. Talukdar et al.
Title Page
Abstract Introduction
Conclusions References
Tables Figures
◭ ◮
◭ ◮
Back Close
Full Screen / Esc
Printer-friendly Version
Interactive Discussion
Discussion
P
a
per
|
Dis
cussion
P
a
per
|
Discussion
P
a
per
|
Discussio
n
P
a
per
|
doi:10.1021/jp110021u, 2011.
Paulot, F., Crounse, J. D., Kjaergaard, H. G., Kroll, J. H., Seinfeld, J. H., and Wennberg, P. O.: Isoprene photooxidation: new insights into the production of acids and organic nitrates, At-mos. Chem. Phys., 9, 1479–1501, doi:10.5194/acp-9-1479-2009, 2009.
Paulson, S. E. and Seinfeld, J. H.: Development and evaluation of a photooxidation mechanism
5
for isoprene, J. Geophys. Res.-Atmos., 97, 20703–20715, 1992.
Plum, C. N., Sanhueza, E., Akinson, R., Carter, W. P. L., James, N., and Pitts, J.: OH radical rate constants and photolysis rates ofα-dicarbonyls, Environ. Sci. Technol., 17, 479–484, 1983.
Rudich, Y., Talukdar, R. K., Fox, R. W., and Ravishankara, A. R.: Rate coefficients for reactions
10
of NO3with a few olefins and oxygenated olefins, J. Phys. Chem., 100, 5374–5381, 1996. Sander, S. P., Friedl, R. R., Golden, D. M., Huie, R. E., Kolb, C. E., Kurylo, M. J., Molina, M. J.,
Moortgat, G. K., Orkin, V. L., Ravishankara, A. R., and Finlayson-Pitts, B. J.: Chemical ki-netics and photochemical data for use in atmospheric studies, JPL Pub. 06-2, Jet Propulsion Laboratory, Pasadena, 2006.
15
Smith, I. W. M. and Ravishankara, A. R.: Role of hydrogen-bonded intermediates in the bi-molecular reactions of the hydroxyl radical, J. Phys. Chem. A, 106, 4798–4807, 2002. Staffelbach, T. A., Orlando, J. J., Tyndall, G. S., and Calvert, J. G.: The UV-visible
absorption-spectrum and photolysis quantum yields of methylglyoxal, J. Geophys. Res.-Atmos., 100, 14189–14198, 1995.
20
Talukdar, R. K., Burkholder, J. B., Schmoltner, A. M., Roberts, J. M., Wilson, R. R., and Ravis-hankara, A. R.: Investigation of the loss processes for peroxyacetyl nitrate in the atmosphere – UV photolysis and reaction with OH, J. Geophys. Res.-Atmos., 100, 14163–14173, 1995. Talukdar, R. K., Gierczak, T., McCabe, D. C., and Ravishankara, A. R.: Reaction of hydroxyl
radical with acetone. 2. Products and reaction mechanism, J. Phys. Chem. A, 107, 5021–
25
5032, 2003.
Taylor, S. E., Goddard, A., Blitz, M. A., Cleary, P. A., and Heard, D. E.: Pulsed Laval nozzle study of the kinetics of OH with unsaturated hydrocarbons at very low temperatures, Phys. Chem. Chem. Phys., 10, 422–437, doi:10.1039/b711411g, 2008.
Tuazon, E. C. and Atkinson, R.: A product study of the gas-phase reaction of methyl vinyl
30
ketone with the OH radical in the presence of NOx, Int. J. Chem. Kinet., 21, 1141–1152, 1989.
![Fig. 3. Plots of (k ′ −k d ′ ) vs. [CH 3 COCHO] where the data points were obtained using 248 nm photolysis of H 2 O 2 for the OH radical source in the absence and presence of O 2](https://thumb-eu.123doks.com/thumbv2/123dok_br/16474829.199374/34.918.97.634.80.496/plots-cocho-obtained-photolysis-radical-source-absence-presence.webp)
![Fig. 4. Arrhenius plot for k 1 (T ) ( • ) from this work. The solid line is linear least-squares fit that yields k 1 ( T ) = (1.74 ± 0.20) × 10 −12 exp[(590 ± 40)/T ] cm 3 molecule −1 s −1](https://thumb-eu.123doks.com/thumbv2/123dok_br/16474829.199374/35.918.96.624.52.470/fig-arrhenius-plot-solid-linear-squares-yields-molecule.webp)