ACPD
12, 24287–24349, 2012Global sensitivity of aviation
K. Gottschaldt et al.
Title Page
Abstract Introduction
Conclusions References
Tables Figures
◭ ◮
◭ ◮
Back Close
Full Screen / Esc
Printer-friendly Version Interactive Discussion
Discussion
P
a
per
|
Dis
cussion
P
a
per
|
Discussion
P
a
per
|
Discussio
n
P
a
per
|
Atmos. Chem. Phys. Discuss., 12, 24287–24349, 2012 www.atmos-chem-phys-discuss.net/12/24287/2012/ doi:10.5194/acpd-12-24287-2012
© Author(s) 2012. CC Attribution 3.0 License.
Atmospheric Chemistry and Physics Discussions
This discussion paper is/has been under review for the journal Atmospheric Chemistry and Physics (ACP). Please refer to the corresponding final paper in ACP if available.
Global sensitivity of aviation NO
x
e
ff
ects
to the HNO
3
-forming channel of the
HO
2
+
NO reaction
K. Gottschaldt1, C. Voigt1,2, P. J ¨ockel1, M. Righi1, R. Deckert1, and S. Dietm ¨uller1
1
Deutsches Zentrum f ¨ur Luft- und Raumfahrt, Institut f ¨ur Physik der Atmosph ¨are, Oberpfaffenhofen, Germany
2
Johannes-Gutenberg-Universit ¨at, Institut f ¨ur Physik der Atmosph ¨are, Mainz, Germany
Received: 28 June 2012 – Accepted: 24 August 2012 – Published: 17 September 2012
Correspondence to: K. Gottschaldt ([email protected])
ACPD
12, 24287–24349, 2012Global sensitivity of aviation
K. Gottschaldt et al.
Title Page
Abstract Introduction
Conclusions References
Tables Figures
◭ ◮
◭ ◮
Back Close
Full Screen / Esc
Printer-friendly Version Interactive Discussion
Discussion
P
a
per
|
Dis
cussion
P
a
per
|
Discussion
P
a
per
|
Discussio
n
P
a
per
|
Abstract
The impact of a recently proposed HNO3-forming channel of the HO2+NO reaction (Butkovskaya et al., 2005, 2007) on atmospheric mixing ratios of ozone, methane and their precursors is assessed with a global stratosphere-troposphere chemistry-climate model. Previous modelling studies applied a rate coefficient that depends only on
pres-5
sure and temperature. We additionally considered a possible enhancement of the re-action by humidity, as found by a laboratory study (Butkovskaya et al., 2009). This par-ticularly reduces the oxidation capacity of the atmosphere, increasing methane lifetime significantly.
The effects of aircraft NOx emissions on atmospheric chemistry are altered when
10
considering the above reaction, resulting in a negative net radiative forcing relative to an atmosphere without aviation NOx. Uncertainties associated with the inclusion of the HO2+NO→HNO3 reaction and with its corresponding rate coefficient propagate a considerable additional uncertainty on estimates of the climate impact of aviation and on NOx-related mitigation strategies.
15
1 Introduction
Aircraft emissions of reactive nitrogen oxides (NOx=NO+NO
2) peak in the upper
tro-posphere and lower stratosphere (UTLS), and the resulting NOx increase impacts on the radiatively active trace gases ozone (O3), methane (CH4) and stratospheric water vapour. The level of scientific understanding of this contribution to anthropogenic
cli-20
mate forcing has been judged as moderate to poor (Lee et al., 2009, 2010; Holmes et al., 2011). This judgement did not include the possible effects of the proposed HO2+NO→HNO
3reaction (Butkovskaya et al., 2005, 2007, 2009; Chen et al., 2009).
The concentration of ozone in the UTLS is determined by transport, mixing and by chemical processes, mainly the ozone destroying, catalytic peroxy radical
25
(HOx=HO
ACPD
12, 24287–24349, 2012Global sensitivity of aviation
K. Gottschaldt et al.
Title Page
Abstract Introduction
Conclusions References
Tables Figures
◭ ◮
◭ ◮
Back Close
Full Screen / Esc
Printer-friendly Version Interactive Discussion
Discussion
P
a
per
|
Dis
cussion
P
a
per
|
Discussion
P
a
per
|
Discussio
n
P
a
per
|
reactive nitrogen oxides (Wennberg et al., 1998). Adding (aviation) NOxto the chemical system and considering gas phase chemistry only, the effect on ozone changes sign in the altitude range of 12 to 25 km (Kawa et al., 1998; Penner et al., 1999; Søvde et al., 2007; K ¨ohler et al., 2008; Fichter, 2009). Above that altitude region of zero net effect, aircraft NOxemissions intensify the NOx cycle, enhancing catalytic ozone destruction.
5
This cycle operates more efficiently higher up in the stratosphere, because peroxy rad-icals (sequestering NOx into reservoir species such as nitric acid, HNO3) and NO2 photolysis are less important at higher altitudes. Below that region, the ozone destroy-ing NOxcycle is bypassed via peroxy radicals, and direct emissions of NOx by aircraft can lead to increased ozone production by reducing the abundance of HOxmolecules.
10
Furthermore, the rates of the major net loss reactions of peroxy radicals, as well as ozone production, all depend nonlinearly and even non-monotonically on NOx levels (Ehhalt and Rohrer, 1994). However, such chemical nonlinearities are expected to be small for the atmospheric response to aircraft emissions (Grewe et al., 1999; Holmes et al., 2011).
15
Methane is emitted from the Earth’s surface and lost in the troposphere mainly by the reaction with OH. Thus NOx emissions affect methane life time via OH. Methane perturbations in turn have an effect on ozone (Ehhalt et al., 2001). Methane oxidation is also a major source of stratospheric water vapour.
Beyond these well-known reactions, the effects of NO
x emissions may be further
af-20
fected by (i) the uptake of HNO3into ubiquitous super-cooled aerosol particles, in par-ticular in the stratosphere (Fahey et al., 1993; Schreiner et al., 1999; Voigt et al., 2000), or into ice (e.g. Voigt et al., 2006, 2007; K ¨archer and Voigt, 2006), but also by (ii) the re-cently discovered HNO3-forming channel of the HO2+NO reaction (Butkovskaya et al., 2005, 2007; Chen et al., 2009):
25
HO2+NO→NO2+OH (R1a)
ACPD
12, 24287–24349, 2012Global sensitivity of aviation
K. Gottschaldt et al.
Title Page
Abstract Introduction
Conclusions References
Tables Figures
◭ ◮
◭ ◮
Back Close
Full Screen / Esc
Printer-friendly Version Interactive Discussion
Discussion
P
a
per
|
Dis
cussion
P
a
per
|
Discussion
P
a
per
|
Discussio
n
P
a
per
|
with the rate coefficientsk1aandk2a, respectively. Butkovskaya et al. (2009) supposed that HO2+NO forms the HOONO intermediate complex that mostly decomposes into OH+NO2. A small fraction forms nitric acid, possibly involving another molecule (M).
The effects of Reaction (R2a) on atmospheric composition have been studied before (Br ¨uhl et al., 2007; Cariolle et al., 2008; Søvde et al., 2011), accounting for pressure
5
and temperature dependence of k2a. We additionally considered that both reaction channels may be modified in the presence of water vapour (Butkovskaya et al., 2009), which will be introduced as Reactions (R1b) and (R2b) in Sect. 2.3. The combinations of (R1a) with (R2a) and of (R1b) with (R2b) are two alternative formulations for the net reaction of HO2 with NO, forming NO2, OH and HNO3. For the sake of readability,
10
the HNO3forming channel in general (R2a or R2b) is denoted by (R2), whereas (R1) indicates the other channel (R1a or R1b). Likewise,k2 refers to k2a ork2b, and k1 to k1aork1b.
We note that Reaction (R2) is not generally accepted yet, according to IUPAC (2008): “Although the possibility for HNO3 formation via rearrangement of an initially formed
15
HOONO adduct has been confirmed in the theoretical study of Zhang and Donanhue (2006), further studies of the formation of HNO3 in the title reaction are urgently re-quired to reduce uncertainties”, and according to Sander et al. (2011): “Until the results have been confirmed by other groups and are better understood, no recommendation can be made”.
20
Hoor et al. (2009) already mentioned Reaction (R2) in the context of air traffic NO
x
effects. Unger (2011) reported a negligible impact of (R2a) on short-lived ozone per-turbations due to aviation NOx. Søvde et al. (2011) investigated the response of ozone and methane to the difference between pre-industrial and modern emissions of ozone precursors (NOx, CH4, CO, NMHC). The consideration of (R2a) affected their results,
25
ACPD
12, 24287–24349, 2012Global sensitivity of aviation
K. Gottschaldt et al.
Title Page
Abstract Introduction
Conclusions References
Tables Figures
◭ ◮
◭ ◮
Back Close
Full Screen / Esc
Printer-friendly Version Interactive Discussion
Discussion
P
a
per
|
Dis
cussion
P
a
per
|
Discussion
P
a
per
|
Discussio
n
P
a
per
|
Reaction (R2) that are valid in the entire range of atmospheric temperatures, pres-sures, and water vapour concentrations.
The paper is organized as follows: Sect. 2 describes the base model configuration and the changes to the chemical mechanism when including Reaction (R2) for sensi-tivity simulations. The results of the base simulation and of two sensisensi-tivity simulations
5
with different rate coefficients are presented in Sect. 3. All three simulations were re-peated with aircraft NOxemissions switched offexclusively, to isolate the perturbations from aviation. Chemical effects of aviation NO
x are discussed in Sect. 4, and Sect. 5
deals with the corresponding radiative forcings. Finally, Sect. 6 provides a discussion of our results and the conclusions.
10
2 Methodology
2.1 Base model configuration, no additional HNO3forming channel
This study is based on the global ECHAM/MESSy Atmospheric Chemistry (EMAC) model. EMAC is a numerical chemistry and climate simulation system that includes submodels describing tropospheric and middle atmosphere processes and their
in-15
teraction with oceans, land and human influences (J ¨ockel et al., 2006). It uses the first version of the Modular Earth Submodel System (MESSy1, J ¨ockel et al., 2005) to link multi-institutional computer codes. The core atmospheric model is the 5th genera-tion European Centre Hamburg general circulagenera-tion model (ECHAM5, Roeckner et al., 2003 and 2006). For the present study EMAC was applied (ECHAM5: version 5.3.01,
20
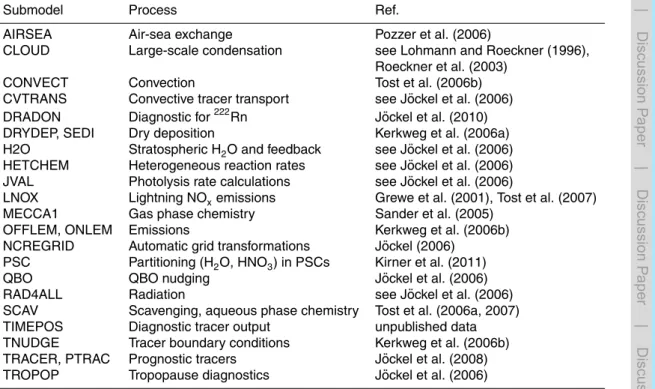
MESSy: modified version 1.10) in the T42L90MA-resolution, i.e. with a spherical trun-cation of T42 (corresponding to a quadratic gaussian grid of approx. 2.8 by 2.8 degrees in latitude and longitude) with 90 vertical hybrid pressure levels up to 0.01 hPa. The model setup comprised the submodels listed in Table 1.
Dynamics in the free troposphere (up to about 200 hPa) was nudged towards the
25
ACPD
12, 24287–24349, 2012Global sensitivity of aviation
K. Gottschaldt et al.
Title Page
Abstract Introduction
Conclusions References
Tables Figures
◭ ◮
◭ ◮
Back Close
Full Screen / Esc
Printer-friendly Version Interactive Discussion
Discussion
P
a
per
|
Dis
cussion
P
a
per
|
Discussion
P
a
per
|
Discussio
n
P
a
per
|
shown for the “S2” setup of J ¨ockel et al. (2006). Gravity wave forcing was treated as in S2, and clouds with a standard EMAC scheme (Sundqvist, 1978; Lohmann and Roeck-ner, 1996). An aerosol climatology (Tanre et al., 1984) was used for the calculation of the radiation field and other climatologies (troposphere: Kerkweg, 2005, stratosphere: H2SO4 from Stratospheric Aerosol and Gas Experiment – SAGE) to provide aerosol
5
surfaces for heterogeneous chemistry. The chemical setup considered 13 heteroge-neous reactions, some of them on different surface types: 11 on nitric-acid trihydrate particles, 11 on polar stratospheric ice clouds, 8 on liquid stratospheric aerosol, and one on liquid tropospheric sulphate aerosol.
Gas phase chemistry was calculated with the MECCA1 chemistry submodel (Sander
10
et al., 2005), consistently from the surface to the stratosphere. The applied chemi-cal mechanism included full stratospheric complexity, but neglected the sulphur and halogen families in the troposphere. It has been evaluated by J ¨ockel et al. (2006). A temperature-dependent rate coefficient,
k0=k1+k2=A·exp
−B
T
(1)
15
was assumed for the HO2+NO conversion via both reaction pathways (R1 and R2). All simulations for this paper were carried out with the Arrhenius factor A= 3.5×10⁻¹²cm3s−1, and activation temperatureB=250 K (Sander et al., 2003). Tem-peratureT is in K. The base simulation hadk1=k0 for Reaction (R1). Reaction (R2) was switched off, i.e.k2=0. The scavenging submodel accounted for 41 aqueous
re-20
actions in rain and Langmuir uptake of nitric acid on ice. The code was modified with respect to the standard version to avoid unrealistically high convective liquid and ice water contents. Compared to Tost et al. (2010), this particularly reduced uptake and subsequent removal of nitric acid in the tropical UTLS.
Emissions from natural and anthropogenic sources were provided to the model as
25
ACPD
12, 24287–24349, 2012Global sensitivity of aviation
K. Gottschaldt et al.
Title Page
Abstract Introduction
Conclusions References
Tables Figures
◭ ◮
◭ ◮
Back Close
Full Screen / Esc
Printer-friendly Version Interactive Discussion
Discussion
P
a
per
|
Dis
cussion
P
a
per
|
Discussion
P
a
per
|
Discussio
n
P
a
per
|
2010). Anthropogenic non-traffic emissions were taken from the inventory by Lamarque et al. (2010) in support of IPCC 5th Assessment Report. Shipping emissions are based on the same dataset, but were rescaled to the time period 1998–2007 using the scaling factors of Eyring et al. (2010). Road traffic and aircraft emissions for the year 2000 were taken from the QUANTIFY project (Lee et al., 2005; QUANTIFY, 2008). Aircraft
emis-5
sions included NOxonly, emitted as 1.815 Tg NO per year. Other sources included NH3 emissions from the EDGAR3.2FT database (van Aardenne et al., 2005), SO2volcanic emissions from AeroCom (Dentener et al., 2006), terrestrial DMS (Spiro et al., 1992) and biogenic emissions (Ganzeveld et al., 2006). Speciation of Non-Methane Hydro Carbons (NMHCs) was realized following von Kuhlmann et al. (2001), as described
10
also in Hoor et al. (2009).
Online emissions of soil NO and isoprene were simulated as a function of specific meteorological conditions. Note that isoprene oxidation in the chemical mechanism used for this study does not include the recently described recycling of the hydroxyl radical (Taraborrelli et al., 2012). The implications of this simplification will be discussed
15
later. Lightning NOx production was parameterized following the scheme by Grewe et al. (2001), resulting in 5.5 Tg nitrogen (N) per year in all simulations of this study for the year 2001. This value is close to the observation-based estimate of 5 Tg N yr−1 (Schumann and Huntrieser 2007). Boundary conditions for long-lived species (CO2, CH4, N2O, CFCs, HCFCs, Halons and H2) were nudged to prescribed surface mixing
20
ratios as in J ¨ockel et al. (2006). Finally, external fields for oceanic DMS, isoprene and ocean salinity were provided in order to simulate the exchange between ocean and atmosphere.
All simulations cover two years and were nudged to the synoptic meteorological con-ditions of the years 2000 and 2001. A slightly negative ENSO index (Wolter and Timlin,
25
ACPD
12, 24287–24349, 2012Global sensitivity of aviation
K. Gottschaldt et al.
Title Page
Abstract Introduction
Conclusions References
Tables Figures
◭ ◮
◭ ◮
Back Close
Full Screen / Esc
Printer-friendly Version Interactive Discussion
Discussion
P
a
per
|
Dis
cussion
P
a
per
|
Discussion
P
a
per
|
Discussio
n
P
a
per
|
from output on 31 December 1999 of a previous simulation with the chemistry mecha-nism as in J ¨ockel et al. (2006). The first year was discarded as chemical spin-up time.
All simulations shown were performed on the IBM Power6 system “Blizzard” at Deutsches Klimarechenzentrum (DKRZ Hamburg), using 4 nodes with 64 tasks each, a Rosenbrock-3 solver with the chemistry submodel MECCA1, 12 min model time step,
5
and 5-hourly output. It took about 4.5 h real time to calculate one model month per sim-ulation. This high computational cost was the reason for limiting the simulation period to 24 months.
2.2 Sensitivity simulations with HNO3forming channel, no humidity modification
10
These simulations differ from the base simulation in the definition ofk1andk2:
k2a=
k0·β
1+β (2)
k1=k0−k2 (3)
i.e.k1a=k0−k2a ork1b=k0−k2b. Butkovskaya et al. (2007) proposed
15
β(p,T)=0.01·
530
T +p·4.8×10
−6−1.73 (4)
with pressurepin Pa andT in K. Equation (4) is based on an empirical fit to laboratory data and is valid for dry conditions, in the pressure range 93–800 hPa and the tem-perature range 223–298 K. Consequently both reaction rates depend on temtem-perature and pressure in this case. Br ¨uhl et al. (2007) applied Eq. (4) for atmospheric
condi-20
tions up to a pressure altitude of 0.01 hPa, and concluded that it brings nitric acid in the upper atmosphere of EMAC into better agreement with MIPAS observations. We adopted Eq. (4) like Br ¨uhl et al. (2007), although Butkovskaya et al. (2009) stated that βremains uncertain at low pressure and requires further experimental work. The focus of our study is on the UTLS, which is well within the claimed validity range of Eq. (4).
ACPD
12, 24287–24349, 2012Global sensitivity of aviation
K. Gottschaldt et al.
Title Page
Abstract Introduction
Conclusions References
Tables Figures
◭ ◮
◭ ◮
Back Close
Full Screen / Esc
Printer-friendly Version Interactive Discussion
Discussion
P
a
per
|
Dis
cussion
P
a
per
|
Discussion
P
a
per
|
Discussio
n
P
a
per
|
2.3 Sensitivity simulations with HNO3forming channel, with humidity modification
An enhancement of HNO3 formation in the presence of water has been measured in the laboratory for the range of 0–70 % relative humidity with respect to liquid water (Butkovskaya et al., 2009). The enhancement of HNO3 formation in the presence of
5
water vapour may be due to the formation of an H2O·HO2complex:
H2O+HO
2↔H2O·HO2 (R3)
suggesting the following chemical mechanism instead of Reactions (R1a) and (R2a):
H2O·HO2+NO→OH+NO2+H2O (R1b)
H2O·HO2+NO→HNO3+H2O (R2b)
10
By fitting the enhancement factor of HNO3 formation as a function of H2O concen-tration, Butkovskaya et al. (2009) derived the ratioγ=k
2b/k2a at 298 K and 267 hPa.
Then, humidity effects can be considered as a modification of Eq. (2):
k2b=k0·β·(1+γ·α)
(1+β)·(1+α) (5)
Butkovskaya et al. (2009) infer that the effect of water vapour on HNO3formation
de-15
pends only weakly on pressure in the range of 133 to 933 hPa, while the tempera-ture dependence is unknown (LeBras, 2011). A constant factorγ=42 (Adams, 1979; Butkovskaya et al., 2009) is assumed in the simulations featuring Reaction (R2b) (and thusk2b). Equation (5) allows us to build on the representation of (R1a) and (R2a) in the code, instead of explicitly implementing Reactions (R3), (R1b) and (R2b). The term
20
α=cH
ACPD
12, 24287–24349, 2012Global sensitivity of aviation
K. Gottschaldt et al.
Title Page
Abstract Introduction
Conclusions References
Tables Figures
◭ ◮
◭ ◮
Back Close
Full Screen / Esc
Printer-friendly Version Interactive Discussion
Discussion
P
a
per
|
Dis
cussion
P
a
per
|
Discussion
P
a
per
|
Discussio
n
P
a
per
|
depends on the equilibrium coefficient (in cm3)
Keq=6.6×1027·T·exp
3700 T
(7)
of Reaction (R3) (Kanno et al., 2006) and on the molecular concentration of water,cH2O in cm−3.
The total rate coefficientk
0=k1+k2of the HO2+NO reaction does not depend on
5
cH2Oin this formulation, consistent with Bohn and Zetzsch (1997).
2.4 Interpretation of sensitivity simulations and methodological limitations
Six simulations will be discussed in this study that all share the same meteorology, but differ in their atmospheric chemistry (Table 2). The Base simulation without (R2), and withAircraft emissions (BA) serves as reference for the comparison to simulations
10
DA (Dry=rate coefficient for Reaction (R2a) according to Eq. (2), with Aircraft emis-sions) and WA (Wet=rate coefficient for R2b with humidity modification according to Eq. (5), withAircraft emissions). Any pair of a reference and a sensitivity simulation is denoted as “sensitivity block”. The sensitivity blocks (BA versus DA) and (BA versus WA) are discussed to isolate the effects of (R2) on atmospheric HNO3, HOx, NOxand
15
O3background mixing ratios.
Each of the above simulations represents a different chemical atmospheric chemical regime, but all three have identical emissions. Thus three more reference simulations are needed to isolate aviation NOx effects by pairs. B0 (Base simulation,0=zero air-craft emissions) is compared to BA. D0 and W0 serve as reference cases for the
sensi-20
tivities DA and WA, respectively. The corresponding sensitivity blocks are denoted∆B, ∆D and∆W.
Sensitivity method: Considering aviation NOx as a small chemical perturbation, the deviations of a simulation with aircraft NOxemissions from one without are evaluated. The response to the perturbation may weakly depend on background NOx mixing
ra-25
ACPD
12, 24287–24349, 2012Global sensitivity of aviation
K. Gottschaldt et al.
Title Page
Abstract Introduction
Conclusions References
Tables Figures
◭ ◮
◭ ◮
Back Close
Full Screen / Esc
Printer-friendly Version Interactive Discussion
Discussion
P
a
per
|
Dis
cussion
P
a
per
|
Discussion
P
a
per
|
Discussio
n
P
a
per
|
effects. Furthermore, buffering in the chemical system may partially compensate the effects of switched-offemissions (Grewe et al., 2012). Thus the sensitivity method is inappropriate for source attribution, but well suited to evaluate the atmospheric impact of changed emissions (Grewe et al., 2010). We refer to the differences between oth-erwise identical simulations with and without aviation NOxas “effects of aviation NO
x”.
5
The term is ambiguous though and may have a different physical meaning with other methodologies, e.g. tagging. Since we only apply the sensitivity method, “effects of . . . ” is still used throughout the paper for brevity. The sensitivity method shows the net re-sponse of the chemical system to a perturbation, including all chemical nonlinear and buffering effects without discrimination. It is discussed for sensitivity blocks∆B,∆D and
10
∆W how each hypothetical atmosphere would change without aircraft NO
xemissions.
QCTM mode: This study focuses on chemical effects, but not on the potential feed-backs between perturbed chemistry and dynamics. Small chemical differences cause a divergence of model dynamics in a coupled system. In such cases, the strategy to compare a base simulation with a chemically modified sensitivity simulation would
re-15
quire very long integration times to find a statistically significant chemical signal, due to the dynamically induced “noise”. For small perturbations this might not be possible at all. Therefore EMAC was operated in Quasi Chemistry Transport Model (QCTM) mode (Deckert et al., 2011) for all simulations, switching offany feedback from chemical per-turbations to the dynamical state (meteorology) of the atmosphere. Model configuration
20
here is largely similar to the one used for Deckert et al. (2011). The same predefined cli-matologies (for radiatively active gases, nitric acid and chemical water vapour tenden-cies) were used in all simulations to calculate chemical feedbacks on model dynamics. In turn, the meteorological parameters (e.g. temperature, pressure, flow field, radiation, humidity) entering atmospheric chemistry calculations are also identical throughout the
25
ACPD
12, 24287–24349, 2012Global sensitivity of aviation
K. Gottschaldt et al.
Title Page
Abstract Introduction
Conclusions References
Tables Figures
◭ ◮
◭ ◮
Back Close
Full Screen / Esc
Printer-friendly Version Interactive Discussion
Discussion
P
a
per
|
Dis
cussion
P
a
per
|
Discussion
P
a
per
|
Discussio
n
P
a
per
|
signal is not possible for one simulation year. At the most, variation throughout the year may give some indication of the sensitivity of the chemical signal to different states of the background atmosphere.
The analysis of chemical signals from QCTM simulations neglects any potential dif-ferences that might occur in response to the feedbacks from chemical perturbations
5
on dynamics, and back from dynamics on atmospheric chemistry. However, aviation induced chemical perturbations are too small to modify meteorology enough to change the chemistry response (Grewe et al., 2002).
3 Effects of the HO2+NO→HNO3reaction on atmospheric chemistry
In this section it will be discussed how Reactions (R2a) or (R2b) (summarized as R2)
af-10
fect background atmospheric chemistry, without considering aviation effects. Two sim-ulations (DA, WA) with different reaction rate coefficients for (R2) are compared to a reference simulation (BA) without (R2). All three simulations have identical emissions (including aviation) and meteorology.
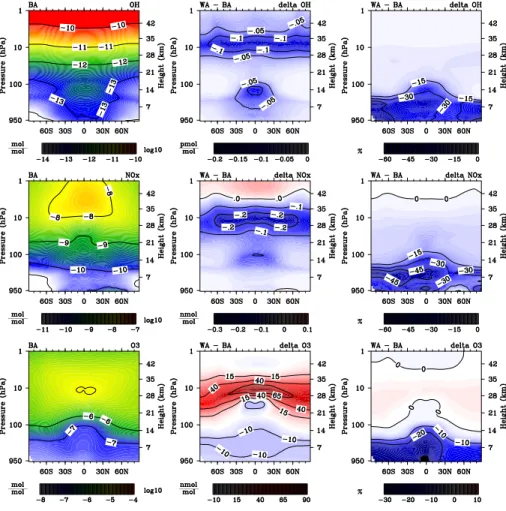
The left column of Fig. 1 shows the 12-month average of zonal mean mixing ratios
15
of HNO3, HOx, NOxand O3for simulation BA. Mixing ratios of trace gas X are denoted [X] in the following text. These plots serve as a reference when interpreting plots of absolute or relative deviations in the sensitivity simulations. Absolute and relative devi-ations of annual zonal mean [HNO3], [NOx], [OH], [HO2] and [O3] of WA with respect to BA are shown in the middle and right columns of Fig. 1, respectively. Differences to
20
simulation DA will be discussed in the text but not shown.
In an attempt to check if any of the chemical regimes yields unrealistic results, [HNO3], [NOx], [CO] and [O3] profiles from simulations BA, DA and WA were compared to observational profiles of Emmons et al. (2000). However, all simulations match the observed trace gas mixing ratios well (see Supplement). Neither the regime without
25
ACPD
12, 24287–24349, 2012Global sensitivity of aviation
K. Gottschaldt et al.
Title Page
Abstract Introduction
Conclusions References
Tables Figures
◭ ◮
◭ ◮
Back Close
Full Screen / Esc
Printer-friendly Version Interactive Discussion
Discussion
P
a
per
|
Dis
cussion
P
a
per
|
Discussion
P
a
per
|
Discussio
n
P
a
per
|
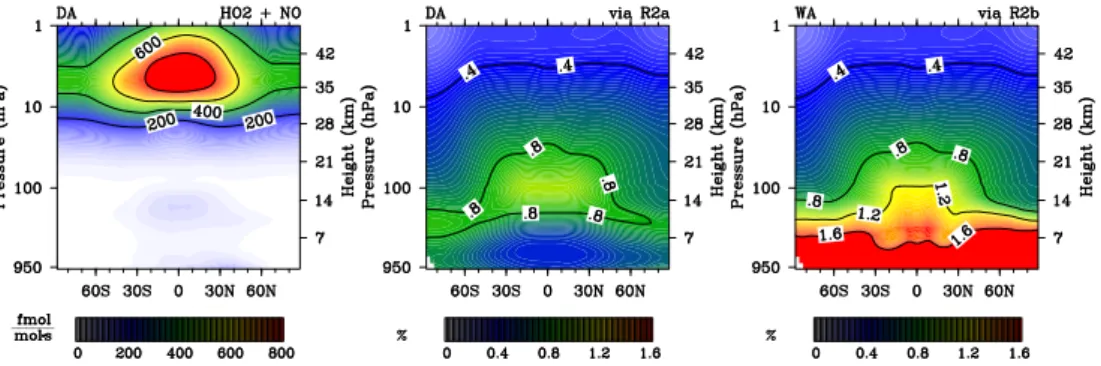
3.1 Reaction rates
Figure 2 (left) shows the cumulative rate of Reactions (R1a) and (R2a). It peaks in the tropics between 10 and 1 hPa, at 0.94 pmol mol−1s−1. There is also a smaller local maximum in the tropical UTLS. (R2a) is favoured at low temperatures and high pres-sures. This causes a local maximum in the cold spot of the tropical UTLS, where about
5
1 % of the HO2+NO reaction proceed via the HNO3forming channel (Fig. 2, middle). NOx is reused in the catalytic cycle involving (R1). Each time a NOx molecule passes through this cycle, it has a small chance of getting lost via (R2). The small branching ratio will consequently be amplified by the cycling. Humidity is highest near the sur-face, decreasing by nearly 4 orders of magnitude towards the UTLS. This makes the
10
humidity modification (Eq. 5) most important in the troposphere, where up to 5.5 % of the HO2+NO reaction form HNO3(Fig. 2, right). Humidity effects might be slightly un-derestimated, because all water vapour leading to relative humidity higher than 100 % is immediately transferred into clouds.
In the following [HNO3], [HOx], [NOx] and [O3] in simulations DA and WA are
com-15
pared to BA, isolating the impact of (R2) on background mixing ratios of those species. A more detailed analysis of the spatial and temporal patterns for the relevant reaction rates (rate coefficients and concentration of educts) would be necessary to fully un-derstand the observed sensitivity patterns. This might be warranted once reaction (R2) and its rate coefficient are fully accepted.
20
3.2 Effects of the HNO3-forming channel on [HNO3] background
Reaction (R2) is the only major source of HNO3above about 40 km, putting the relative effect offthe scale at altitudes with near zero background [HNO3] (Fig. 1, 1st row). How-ever, absolute deviations from BA are small there. They have a maximum at 10 hPa, where high absolute HO2+NO reaction rates meet high HNO3background mixing
ra-25
ACPD
12, 24287–24349, 2012Global sensitivity of aviation
K. Gottschaldt et al.
Title Page
Abstract Introduction
Conclusions References
Tables Figures
◭ ◮
◭ ◮
Back Close
Full Screen / Esc
Printer-friendly Version Interactive Discussion
Discussion
P
a
per
|
Dis
cussion
P
a
per
|
Discussion
P
a
per
|
Discussio
n
P
a
per
|
UTLS, due to the maximum of the branching ratio. [HNO3] increases by more than 50 % there in the dry case, confirming the results of Cariolle et al. (2008). The local maximum is even more pronounced when considering humidity. While directly produc-ing HNO3, Reaction (R2) also indirectly reduces the educts for HNO3 formation via NO2+OH. The latter effect may prevail in the tropical lower troposphere and at an
alti-5
tude of about 14 km at high latitudes, leading to lower HNO3mixing rations than in the reference simulation. There is a strong seasonal dependence of the HNO3 response to (R2) (not shown), with reductions at high latitudes only occurring during autumn and spring in the respective hemispheres. Please note that the above discussion refers to HNO3calculated online by the chemistry submodel MECCA1, while all simulations
10
used the same HNO3 offline climatology for partitioning in polar stratospheric clouds (PSCs). This inconsistency in PSC chemistry must be accepted in order to use the QCTM mode.
3.3 Effects of the HNO3-forming channel on [HOx] background
The [HOx] response to (R2b) is dominated by [HO2], varying from −0.18 to
15
+0.38 pmol mol−1in DA and by±1.1 pmol mol−1in WA, both with respect to BA (Fig. 1, 2nd row). HO2 mixing ratios decrease in WA in the lower troposphere, in the trop-ics more than at high latitudes. Above is a change of sign in the response, followed by a local [HO2] increase, reaching more than 50 % in the tropical UTLS. Although positive and negative perturbations are higher in WA, the magnitude of the negative
20
perturbation increases more, due to higher humidity at lower altitudes. [HO2] changes are close to zero for the next 14 km, to rise again locally at 10 hPa. Above is another change of sign and [HO2] decreases again throughout the uppermost part of the atmo-sphere. This response pattern is similar for DA, with nearly identical altitudes of zero net response, but lower magnitude in the troposphere. Relative [HO2] changes are
25
ACPD
12, 24287–24349, 2012Global sensitivity of aviation
K. Gottschaldt et al.
Title Page
Abstract Introduction
Conclusions References
Tables Figures
◭ ◮
◭ ◮
Back Close
Full Screen / Esc
Printer-friendly Version Interactive Discussion
Discussion
P
a
per
|
Dis
cussion
P
a
per
|
Discussion
P
a
per
|
Discussio
n
P
a
per
|
reaction. Therefore [OH] decreases in DA and WA all over, by more than 0.1 pmol mol−1 at 10 hPa across all latitudes (Fig. 1, 3rd row). This coincides with the maximum abso-lute impact of Reaction (R2) on [HNO3] and NOx. There is a local maximum of absolute [OH] decrease in the tropical UTLS, matching the local maximum of [HNO3] deviations. The local maximum in DA reaches only about 50 % of the corresponding feature in
5
WA. Relative [OH] deviations from BA match those of [NOx]. [OH] decreases by more than 15 % throughout the troposphere in WA. Reaction (R2) shifts the OH/HO2ratio to-wards HO2(Fig. 4, 2nd row). This effect is most pronounced in the upper troposphere, reaching 29 % in DA and 57 % in WA, both compared to BA.
Following Lawrence et al. (2001), the global OH burden for the tropospheric domain
10
with a climatological tropopause is calculated as
p=300−215 (cos (φ))2, (8)
wherep is pressure in hPa and φ is latitude. The OH concentrations in Table 3 are annual mean values, computed from global monthly mean concentrationshcOHi:
hcOHi=
P
(w·[OH]·cair)
P
w , (9)
15
where h i denotes the global spatial integral, the sum P
is over all grid cells in the tropospheric domain, [OH] is a 3-D field of monthly mean OH mixing ratios,cair is the corresponding 3-D field of the concentration of air (in cm−3), and w is a 3-D field of weighting factors. Weighting with the reaction rate coefficientk
CH4 of CH4+OH→CH
3+H2O (R4)
20
ACPD
12, 24287–24349, 2012Global sensitivity of aviation
K. Gottschaldt et al.
Title Page
Abstract Introduction
Conclusions References
Tables Figures
◭ ◮
◭ ◮
Back Close
Full Screen / Esc
Printer-friendly Version Interactive Discussion
Discussion
P
a
per
|
Dis
cussion
P
a
per
|
Discussion
P
a
per
|
Discussio
n
P
a
per
|
weighting factor and on the domain used for the computation, hampering comparisons between different studies (Lawrence et al., 2001). In order to facilitate comparability, results with grid cell air mass as weighting factor are also provided.
The global OH concentrations (
cmassOH
,DckOHE) of simulation BA are higher than in other modelling studies (Spivakovsky et al., 2000; J ¨ockel et al., 2006, 2010) that also
5
did not consider (R2). Spivakovsky et al. (2000) utilize a top-down approach, starting from observations of precursors for HOx−NOx photochemistry. The global mean OH concentration is then derived from simulations with an accuracy of ±15 %. BA falls within this uncertainty range. J ¨ockel et al. (2006) suggest that the differences to Spi-vakovsky et al. (2000) may lay in the representation of convection (via lightning NOxand
10
transport of HOx precursors), or in missing heterogeneous chemical processes. Sim-ulation BA was done with a newer version of EMAC and different emissions, but with an otherwise similar setup as in J ¨ockel et al. (2006). They prescribed biomass burning CO emissions of 452.36 Tg yr−1, simulations of this study had only 254.79 Tg yr−1. The reaction CO+OH→CO2+H accounts for approximately 41 % of all tropospheric OH
15
losses (von Kuhlmann et al., 2003). Biomass burning CO emissions in the simulation of J ¨ockel et al. (2010) ranged from 335.77 to 588.39 Tg yr−1, corresponding to a variation of−21 % to +38 % for the period 1997 to 2006. Montzka et al. (2011) show
cmassCO
variations of−3.5 % to+9 % for that simulation, and
cmassOH
is roughly anticorrelated, with+3 % to−2.5 %. We have not tested the sensitivity of global [OH] to CO emissions
20
in our model, but lower CO mixing ratios might at least partially explain the higher OH levels. An update in the scavenging parameterisation might also have contributed to the differences between EMAC simulations for previous studies (J ¨ockel et al., 2006, 2010) and the current study.
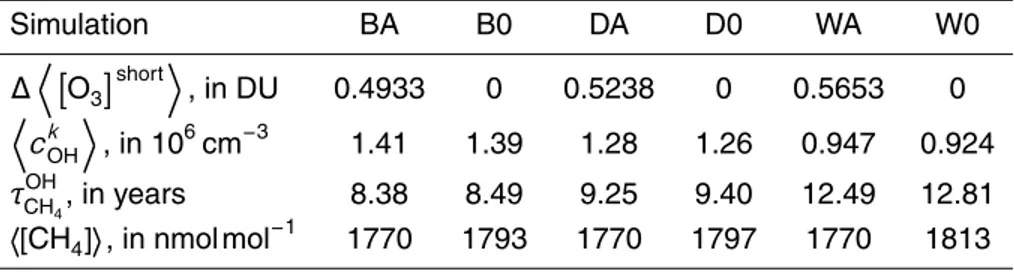
Reaction (R2) decreaseshcOHi by about 10 % in DA and by 33 % in WA, both with
25
ACPD
12, 24287–24349, 2012Global sensitivity of aviation
K. Gottschaldt et al.
Title Page
Abstract Introduction
Conclusions References
Tables Figures
◭ ◮
◭ ◮
Back Close
Full Screen / Esc
Printer-friendly Version Interactive Discussion
Discussion
P
a
per
|
Dis
cussion
P
a
per
|
Discussion
P
a
per
|
Discussio
n
P
a
per
|
ofhcOHiare based on measurements of longer lived trace gases that are removed from the atmosphere mainly through reactions with OH. Spivakovsky et al. (2000) verify their results with measurements of CH3CCl3, HCFC-22, and others. Global mean OH con-centrations derived from the mass balance of these species have an uncertainty of
−20 % to +28 % with respect to their preferred value (Table 3). BA and DA are within
5
this range, WA is just outside.
Although only important close to the surface, the recently discovered OH recycling during NMHC oxidation increased global
cmassOH
from 1.08 to 1.22×106cm−3in a sim-ulation with the EMAC model (Taraborrelli et al., 2012). Only one simsim-ulation year has been evaluated to obtain these numbers, but little interannual variability is expected
10
(Montzka et al., 2011). The new chemical mechanism has not yet been available for this study, but assuming a similar impact of 13 % in our simulations would bring
cmassOH
to 1.44, 1.27 and 0.96 cm−3in BA, DA and WA, respectively. Then all three simulations would be within the range given by Spivakovsky et al. (2000), i.e. compatible with ob-servations.
15
Note that the combination of the new NMHC oxidation mechanism (Taraborrelli et al., 2012) and (R2) including humidity effects (WA) might yield the most realistic global OH concentration.
3.4 Effects of the HNO3-forming channel on methane lifetime with respect to
background [OH]
20
Methane is a long-lived greenhouse gas, playing an important role in global climate change. Top–down methods for the quantification of methane fluxes are constrained mainly by uncertainties in the sink estimates and the choice of lifetime used in the mass balance calculations (Denman et al., 2007). The lifetime of a gas is essentially its atmo-spheric mass burden divided by the loss rate. Reaction (R4) mainly determines the
life-25
ACPD
12, 24287–24349, 2012Global sensitivity of aviation
K. Gottschaldt et al.
Title Page
Abstract Introduction
Conclusions References
Tables Figures
◭ ◮
◭ ◮
Back Close
Full Screen / Esc
Printer-friendly Version Interactive Discussion
Discussion
P
a
per
|
Dis
cussion
P
a
per
|
Discussion
P
a
per
|
Discussio
n
P
a
per
|
on τCH
4 with respect to Reaction (R4) (τ
OH
CH4). Recent model based estimates range from 9.72+−5.332.81yr (Shindell et al., 2006), 9.9+−5.23.0yr (Stevenson et al., 2006)1, or 7.23 to 11.43 yr (Hoor et al., 2009). These values are only comparable to simulation BA, be-cause none of those previous works considered (R2). Independent estimates ofτOHCH
4 are based on methane and methyl chloroform (MCF=CH3CCl3) observations, giving
5
9.6+−2.41.6yr (Denman et al., 2007)2 or 11.2±1.3 yr (Prather et al., 2012). Thus it may serve as a reference for simulations with and without (R2).
Methane lifetime was calculated according to Lawrence et al. (2001), with
τCHOH 4
=
P
mCH4
D
ckOHE·P
kCH4·mCH4
(10)
for the tropospheric domain defined by Eq. (8). The sums are over all grid boxes in the
10
domain,mCH4 is the methane mass per grid cell, kCH4 is the reaction rate coefficient
of (R4), andDckOHEis the global mean concentration of OH (Eq. 9), weighted bykCH4. Before calculating the annual mean, Eq. (9) is evaluated with monthly mean 3-D fields ofkCH4 andmCH4, and monthly mean values forDckOHE. About a decade of simulation time would be needed for methane mixing ratios to adjust to a perturbation, while the
15
short-lived [OH] almost immediately adjusts. The actual mCH4 from each simulation
entered Eq. (9). However, using methane from BA would reduceτCHOH
4 in DA and WA by negligible 0.1 yr, compared to the values in Table 3.
1 τCHOH
4 was not given by Stevenson et al. (2006). The given value is based on their scenario S1, minimum, mean and maximum for all models, a soil sink for methane of 30 Tg yr−1, and a stratospheric sink of 40 Tg yr−1.
2
ACPD
12, 24287–24349, 2012Global sensitivity of aviation
K. Gottschaldt et al.
Title Page
Abstract Introduction
Conclusions References
Tables Figures
◭ ◮
◭ ◮
Back Close
Full Screen / Esc
Printer-friendly Version Interactive Discussion
Discussion
P
a
per
|
Dis
cussion
P
a
per
|
Discussion
P
a
per
|
Discussio
n
P
a
per
|
Simulation BA is on the low side of estimates for τCHOH
4 (7.6 yr, Table 3). Methane lifetime increases to 8.4 yr in DA, and to 11.4 yr in BA. All values are in the range of other estimates. Uncertainties in the rate coefficient of (R4) impose uncertainties of up to−30 % and+44 % on methane lifetime in the simulations of this study, though the corresponding uncertainties ofDckOHE are small (see Supplement). Methane lifetime
5
changes moderately, if an upper domain boundary of 100 hPa is considered instead of the climatological tropopause (Eq. 8), because (R4) is most important in the tropo-sphere (Stenke et al., 2012). The rate coefficient formulation of Atkinson (2003), as used in this study, is in between the recommendations of IUPAC (2007) and Sander et al. (2011). However, the recommended temperature dependent rate coefficients
10
(kCHbest
4) of the di
fferent studies agree remarkably well (Supplement, Fig. S5).
The methane lifetime change of 10.5 % from BA to DA is in good agreement with Søvde et al. (2011), who found 10.9 % for a similar comparison with a different model. Cariolle et al. (2008) reported only about 5 %. M ¨uller (2011) found τCHOH
4
=7.7 yr in
a simulation without (R2), 8.8 yr when considering (R2) similar to DA, and 9.8 yr for
15
the equivalent to simulation WA. Considering humidity in the rate coefficient of (R2) has a bigger effect in this study. More details about the methodology of M ¨uller (2011) would be needed for an attempt to pinpoint the causes of this difference. Taraborrelli et al. (2012) reported a decrease of methane lifetime from 8.02 yr to 7.2 yr when taking into account OH recycling during NMHC oxidation. Assuming a similar 10 % reduction
20
of methane lifetime in simulations BA, DA and WA would bringτOHCH
4 in WA closest to the observation based value of Denman et al. (2007). WA is the only regime consistent with the MCF-derivedτCHOH
4 of Prather et al. (2012), with and without 10 % reduction.
3.5 Effects of the HNO3-forming channel on [NOx] background
As for [HNO3] and [OH], the biggest absolute effects on annual zonal mean [NO
x]
25
ACPD
12, 24287–24349, 2012Global sensitivity of aviation
K. Gottschaldt et al.
Title Page
Abstract Introduction
Conclusions References
Tables Figures
◭ ◮
◭ ◮
Back Close
Full Screen / Esc
Printer-friendly Version Interactive Discussion
Discussion
P
a
per
|
Dis
cussion
P
a
per
|
Discussion
P
a
per
|
Discussio
n
P
a
per
|
251 pmol mol−1in DA and by up to 245 pmol mol−1in WA (Fig. 1, 4th row). There is an altitude of less [NOx] changes around 70 hPa, followed by a region of again pronounced [NOx] reduction at 100 hPa in the tropics. Humidity effects are bigger there, with the maximum decrease above the equator being 60 pmol mol−1in DA and 100 pmol mol−1 in WA. [NOx] is reduced throughout the troposphere, except between 30◦N and 70◦N,
5
near emission sources at the ground. This indicates a non-monotonic response, de-pending on NOx background mixing ratios. The [NOx] response to the introduction of (R2) becomes positive at NOx mixing ratios higher than about 200 pmol mol−1 near the ground, both in DA and WA. The region of zero response is shifted to NOxmixing ra-tios of 100 pmol mol−1at 750 hPa in DA, but not shifted in WA. Thus (R2) seems to
mod-10
ify the chemical response function not only quantitatively, but also qualitatively. Peak [NOx] perturbations in the planetary boundary layer lie between−4 and+20 pmol mol−1 in DA, and between−18 and+79 pmol mol−1in WA. The minimum and maximum ex-treme values are located at 20◦N and 52◦N, respectively. There is another region of zero net [NOx] change around 3 hPa, corresponding to the highest NOx background
15
concentrations.
The relative NOx effect most pronounced in the troposphere, reaching−35 % in DA and −60 % in WA. It is skewed towards the less polluted Southern Hemisphere, as noted already by Cariolle et al. (2008).
In addition to the overall NOx decrease, Reaction (R2) shifts the NO/NO2 ratio
to-20
wards NO throughout the troposphere and UTLS (Fig. 4, 1st row). The lower NOx background created by (R2) seems to slow down OH- and NO2-formation by (R1), because the OH/HO2ratio is also being shifted towards the educt of (R2).
The response of atmospheric chemistry to aircraft NOx emissions depends on NOx background mixing ratios (Ehhalt and Rohrer, 1994). This nonlinear effect will ultimately
25
ACPD
12, 24287–24349, 2012Global sensitivity of aviation
K. Gottschaldt et al.
Title Page
Abstract Introduction
Conclusions References
Tables Figures
◭ ◮
◭ ◮
Back Close
Full Screen / Esc
Printer-friendly Version Interactive Discussion
Discussion
P
a
per
|
Dis
cussion
P
a
per
|
Discussion
P
a
per
|
Discussio
n
P
a
per
|
3.6 Effects of the HNO3-forming channel on [O3] background
As shown in the last row of Fig. 1, the decrease in NOx near 10 hPa corresponds to increased ozone mixing ratios in DA and WA. However, the effect of (R2) on [O3] changes sign in this sensitivity block at altitudes of 14 km above the poles and 26 km above the equator. Reaction (R1) produces NO2, and the subsequent photolysis of
5
NO2 is a major source of O3 in the troposphere. NOx mixing ratios decrease due to Reaction (R2), and the NO/NO2 ratio is additionally shifted towards NO. Both effects result in less ozone production via NO2 photolysis. Ozone production depends non-linearly on NOx levels, and the [NOx] perturbation due to (R2) is superimposed on the vertical background [NOx] gradient. The local [NOx] minimum at 100 hPa in the
10
tropics might translate into increased ozone production (Lin et al., 1988; Wu et al., 2007), leading to a less negative ozone response than at the altitude of 22 km. There is a monotonic ozone response to [NOx] perturbations at aircraft flight altitudes and the reduced [NOx] background in DA and WA moves the chemical system away from the nonlinear region. Transport is superimposed on these chemical effects: compared
15
to a simulation without (R2), there is less ozone in the tropical upwellings, and more ozone in the downwellings at high latitudes. Ozone decreases below the altitude of zero net change throughout the troposphere, by more than 10 nmol mol−1 at 9 km at all latitudes in WA. The tropospheric ozone decrease reaches only 4 nmol mol−1at all latitudes in DA, and more than 10 nmol mol−1 just in a small spot in the tropics. The
20
relative impact on ozone is most pronounced in the troposphere, where background concentrations are low. It reaches−11 % in DA and−32 % in WA. Following the NOx response to (R2), the ozone effect is larger in the Southern Hemisphere. There is no big difference between the stratospheric ozone effects in DA and WA. Mixing ratios increase by up to 1.5 % there.
25
ACPD
12, 24287–24349, 2012Global sensitivity of aviation
K. Gottschaldt et al.
Title Page
Abstract Introduction
Conclusions References
Tables Figures
◭ ◮
◭ ◮
Back Close
Full Screen / Esc
Printer-friendly Version Interactive Discussion
Discussion
P
a
per
|
Dis
cussion
P
a
per
|
Discussion
P
a
per
|
Discussio
n
P
a
per
|
increase of Keq due to decreasing temperature (Eq. 7, Fig. 2). Ozone increases by
up to 94 nmol mol−1 in the tropical stratosphere in DA, but only by 89 nmol mol−1 in WA. According to Eq. (5) humidity should always enhance the effects of (R2) (given α >0). Possibly the humidity effect is negligible in that altitude, and enhanced ozone loss from below the zone of no change in zonal mean mixing ratios prints through via
5
atmospheric transport.
Higher atmospheric density in the troposphere over-compensates higher absolute ozone increases in the stratosphere. Thus the global annual mean ozone column de-creases, from 316 DU in simulation BA, by 0.5 % in DA, and by 1.8 % in WA (Ta-ble 2). A comparison to TOMS total ozone (http://toms.gsfc.nasa.gov/ftpdata v8.html,
10
not shown) revealed a slight high bias of model O3, as already noted by J ¨ockel et al. (2006). Compared to their coupled simulations, using a HNO3 climatology for decoupling tends to average out individual PSC events, and impairs denitrification and ozone destruction further. The effects of (R2) act in the right direction.
4 Chemical effects of aviation NOx
15
In this section the effects of identical aircraft NO
x emissions in three different
atmo-spheric chemical regimes are isolated. The three background regimes were discussed in the previous section. Three different reference cases without aircraft NOx emissions are introduced (Table 2: B0, D0, W0), one for each regime. Here each sensitivity block refers to a pair of simulations within the same chemical regime:∆B refers to BA versus
20
B0,∆D to DA versus D0, and∆W to WA versus W0. This notation applies to absolute and relative deviations between the two simulations of each pair.
4.1 Chemical effects of aviation NOxon [NOx]
The plots for aviation effects (Fig. 3a and 3b) are cut at the 50 hPa level to zoom into the altitude range where aircraft fly. The colour bar does not cover the full range of values
ACPD
12, 24287–24349, 2012Global sensitivity of aviation
K. Gottschaldt et al.
Title Page
Abstract Introduction
Conclusions References
Tables Figures
◭ ◮
◭ ◮
Back Close
Full Screen / Esc
Printer-friendly Version Interactive Discussion
Discussion
P
a
per
|
Dis
cussion
P
a
per
|
Discussion
P
a
per
|
Discussio
n
P
a
per
|
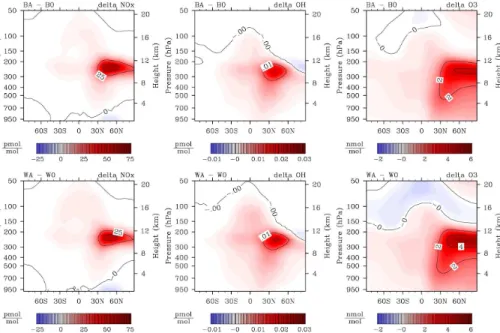
in each picture to improve the visibility of the interesting features. The subsequent discussion refers to annual zonal mean values for the simulation year 2001.
Aircraft NOx emissions peak in the mid-latitudes of the Northern Hemisphere (NH), between 8 and 12 km altitude. Compared to simulation B0, annual zonal mean [NOx] increases in simulation BA by up to 66 pmol mol−1 due to aircraft emissions.
Reac-5
tion (R2) generally decreases [NOx] in the simulations, which also affects NO
x from
aviation. Thus [NOx] increases slightly less when Reaction (R2) is included, by up to 64 pmol mol−1in sensitivity block ∆D, and only 61 pmol mol−1in∆W (Fig. 3a, 1st col-umn). In contrast, the relative effect of aviation NO
x increases when background NOx
is lower due to Reaction (R2) (Fig. 3b, 1st column). It reaches 73 % for sensitivity block
10
∆B, 83 % for ∆D, and 97 % for ∆W. The lowering effect of (R2) on [NOx] affects the background chemistry more than the perturbation by emissions.
In northern mid latitudes near the ground, aircraft NOx emissions decrease NOx mixing ratios in all sensitivity blocks. This corresponds to the only tropospheric region, where Reaction (R2) increases [NOx] (as discussed in Sect. 3.5).
15
4.2 Chemical effects of aviation NOxon [O3]
Ozone mixing ratios in the troposphere rise in response to the additional NOx from aviation, by up to 4.2 nmol mol−1, 4.7 nmol mol−1 and 5.4 nmol mol−1 for ∆B, ∆D, and ∆W, respectively (Fig. 3a, 3rd column). The annual mean peak ozone perturbation in sensitivity block ∆B agrees well with those found by other studies: 4.5 nmol mol−1
20
(Fichter, 2009), about 4 nmol mol−1(Grewe et al., 2002), 4.3 nmol mol−1(Gauss et al., 2006), 2.8 nmol mol−1(Hoor et al., 2008), 6 to 9 nmol mol−1(Koehler et al., 2008).
Relative effects on ozone are additionally pronounced when (R2) is considered, be-cause (R2) lowers [O3] in the troposphere. Ozone mixing ratios increase by up to 3.6 % in∆B, 3.9 % in∆D, and 4.7 % in∆W (Fig. 3b, 3rd column). Absolute and relative ozone
25
ACPD
12, 24287–24349, 2012Global sensitivity of aviation
K. Gottschaldt et al.
Title Page
Abstract Introduction
Conclusions References
Tables Figures
◭ ◮
◭ ◮
Back Close
Full Screen / Esc
Printer-friendly Version Interactive Discussion
Discussion
P
a
per
|
Dis
cussion
P
a
per
|
Discussion
P
a
per
|
Discussio
n
P
a
per
|
decrease in response to aviation NOx (Fig. 3a). This is expected from photochemical considerations (Sect. 1), but difficult to interpret here. There are no direct aircraft NO
x
emissions from the inventory into the altitude range of negative ozone response. Ozone perturbations in Fig. 3 show the integrated results of photochemistry and the transport of species with different lifetimes. The annual global mean ozone burden increases due
5
to aviation NOxin all sensitivity blocks, but most in∆W (Table 2). This is consistent with the known increase in ozone production as [NOx] decreases (Lin et al., 1988; Wu et al., 2007).
4.3 Chemical effects of aviation NOxon [HOx]
The relative [HO2] response (not pictured) is nearly identical in∆B,∆D and∆W,
reach-10
ing−23 %. This corresponds to respective absolute peak perturbations of−0.43,−0.45 and −0.48 pmol mol−1 in the region of maximum aviation NOx. Below an altitude of about 7 km the [HO2] perturbation becomes positive (∼ 0,07 pmol mol−1 in ∆B, ∆D, ∆W). The crossover between positive and negative response to aviation NOx occurs at the same altitude as in the background response to (R2) (Fig. 1), but with reversed
15
signs. Thus the pattern of [HO2] perturbations in Fig. 1 also primarily reflects the inher-ent response of the photochemical system to [NOx] perturbations, which were caused by the introduction of Reaction (R2).
Mixing ratios of the hydroxyl radical, [OH], increase in the troposphere in response to aircraft NOx emissions. The peak perturbation in ∆B is 19 fmol/mol or 17 %.
Ad-20
ditional NOx in the troposphere enhances (R1), shifting the [OH]/[HO2] ratio towards [OH]. Furthermore, OH production is increased, due to additional O3 photolysis and the subsequent reaction with water vapour. Note a small spot of decreasing [OH] at high northern latitudes, just above the tropopause. The [OH] response to aviation NOx changes sign in the same altitude in all sensitivity blocks, regardless of different NO
x
25
ACPD
12, 24287–24349, 2012Global sensitivity of aviation
K. Gottschaldt et al.
Title Page
Abstract Introduction
Conclusions References
Tables Figures
◭ ◮
◭ ◮
Back Close
Full Screen / Esc
Printer-friendly Version Interactive Discussion
Discussion
P
a
per
|
Dis
cussion
P
a
per
|
Discussion
P
a
per
|
Discussio
n
P
a
per
|
temperature dependence of reaction rate coefficients in the base photochemical mech-anism (i.e. independent of R2) dominate the non-monotonic response of [OH].
Both, absolute and relative effects on [OH] are stronger, when (R2) is considered: peaking at 20 fmol/mol (20 %) for∆D, and 21 fmol/mol (25 %) for ∆W (Fig. 3a, b, 2nd column). Perturbation patterns for the OH concentration,ckOH, look similar to [OH]
per-5
turbations in Fig. 3. Peak values are 0.167×106cm−3(18 %) for∆B, 0.169×106cm−3 (20 %) for∆D, and 0.173×106cm−3 (25 %) for∆W. The altitude of the peak [OH] per-turbation is lower than that of [NOx], but higher than that of [O3]. This reflects the superposition of ozone and NOx perturbations, both interacting with OH.
Global annual mean OH concentrations (Eq. 9) for the region below 50 hPa are given
10
in Table 4. About a decade of simulation time would be needed for methane mixing ra-tios to adjust to a perturbation. The corresponding methane lifetimes were calculated according to Eq. (10), always taking [CH4] from simulation BA. Using the same distri-bution for all sensitivity blocks is methodologically cleaner for analysing the differences between them, although using other [CH4] would changeτCHOH
4 only by∼1 %. Methane
15
lifetime in Table 4 was derived from monthly mean values. Aviation NOx increases
D
ckOHEin ∆D more than in ∆B, but most in ∆W (Table 5). Methane lifetime reduces accordingly, most in∆W (Table 5).
4.4 Contrasts between aviation NOxeffects for different implementations of the
HO2+NO reaction
20
Summarizing the chemical effects, aviation NOx increases [NOx], [OH] and [O3] in all sensitivity blocks. Absolute and relative effects on [OH] and [O
3] are more pronounced
when considering Reaction (R2), most in sensitivity block∆W.
Why is (R2) enhancing the effects on [OH] and [O3]? Production and loss of peroxy radicals and ozone depend nonlinearly on temperature, pressure and ambient
concen-25
ACPD
12, 24287–24349, 2012Global sensitivity of aviation
K. Gottschaldt et al.
Title Page
Abstract Introduction
Conclusions References
Tables Figures
◭ ◮
◭ ◮
Back Close
Full Screen / Esc
Printer-friendly Version Interactive Discussion
Discussion
P
a
per
|
Dis
cussion
P
a
per
|
Discussion
P
a
per
|
Discussio
n
P
a
per
|
changed chemical background due to (R2) will shift the response depending on am-bient concentrations. Both effects change production and loss rates, translating into modified mixing ratios. Differences between sensitivity blocks ∆B, ∆D and ∆W are consequently due directly to the different chemical mechanisms, and indirectly to the resulting different background mixing ratios. The sensitivity method used for this study
5
provides only one final response of [NOx], [OH] and [O3] to a [NOx] perturbation. In or-der to find the response functions for each sensitivity block, production and loss terms for OH and O3would have to be evaluated for the relevant atmospheric conditions and for a range of different ambient concentrations. A box modelling approach would be suited for this and might be warranted for a future study, if Reaction (R2) becomes
10
established. Tagging (Grewe et al., 2010) or small perturbation methods (Hoor et al., 2008) might then help to disentangle the different nonlinear effects leading to the final response of [NOx], [OH] and [O3].
For the current study we do not attempt a thorough analysis, and note selected as-pects only. Reaction (R2) shifts the ratios [OH]/[HO2] and [NO]/[NO2] towards [HO2]
15
and [NO] (Fig. 4). Ambient [HO2] increases in the UTLS and dominates the [HOx] re-sponse to (R2). Background [NOx] decreases due to (R2). More ambient [HOx] and less [NOx] may make the coupled catalytic cycles involving those species more sen-sitive to additional NOx, which is more of a limiting factor in ∆D and ∆W. Simulations BA, B0, WA and W0 were repeated for short periods of time to diagnose the rates
20
of the main reactions affecting the HO
xand NOx catalytic cycles. Reactions with HO2
as educt become less effective above 7 km and more effective below. All other reac-tions are enhanced by aviation NOx. The rates of all reactions involving OH, HO2, NO or NO2 as an educt are more affected by aviation NO
x in ∆B than in ∆W. Aviation
NOx increases NOx mixing ratios absolutely more in ∆B than in ∆W, while the
rela-25


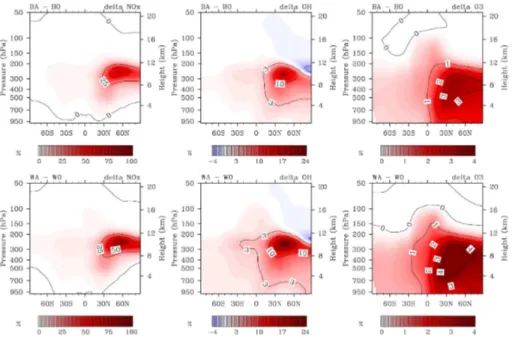
![Fig. 1. Comparison of [HNO 3 ], [HO 2 ], [OH], [NO x ] and [O 3 ] in a simulation with the HNO 3 - -forming channel to a reference simulation without HO 2 + NO → HNO 3](https://thumb-eu.123doks.com/thumbv2/123dok_br/17119528.238374/57.918.98.609.78.412/fig-comparison-hno-simulation-forming-channel-reference-simulation.webp)
![Fig. 4. Annual zonal mean ratio of [NO]/[NO 2 ] (top) and [OH]/[HO 2 ] (bottom) in simulations with aviation NO x](https://thumb-eu.123doks.com/thumbv2/123dok_br/17119528.238374/62.918.98.621.113.449/fig-annual-zonal-mean-ratio-oh-simulations-aviation.webp)
