Management Accounting Profile of Firms Located in Brazil: a Field Study
Management Accounting Profile of Firms Located in Brazil: a Field Study
Management Accounting Profile of Firms Located in Brazil: a Field Study
Management Accounting Profile of Firms Located in Brazil: a Field Study
Fábio Frezatti
R
R
R
R
ESUMOESUMOESUMOESUMOAs empresas têm que dispor de recursos que proporcionam vantagens competitivas, fatores importantes para o sucesso. Existe uma grande variedade de tais recursos – incluindo sistemas, conceitos de participação, modelos e estrutura organizacional. Devem ser considerados como componentes das práticas gerenciais. Cada empresa pode ser caracterizada como tendo uma configuração singular, única, em termos de ferramentas que pode ser reconhecida como perfil da empresa. Esta pesquisa analisa a aderência conceitual (que é uma relação entre a teoria e o que foi encontrado no mercado) em relação às práticas gerenciais das empresas Brasileiras de médio e grande portes. A utilização da estatística multivariada permitiu a identificação de cinco clusters dentro do grupo de empresas estudadas. A principal conclusão, para a amostra, é que a aderência conceitual aos componentes táticos é maior do que aos estratégicos. Adicionalmente, ficou evidenciada que os componentes de contribuições mais recentes são aqueles menos utilizados, similarmente ao que foi constatado pelos pesquisadores americanos e britânicos.
Palavras-chave:gestão; contabilidade; práticas gerenciais.
A
A
A
A
BSTRACTBSTRACTBSTRACTBSTRACTCompanies must have resources that provide competitive advantages and are important factors for success. There is a great variety of such resources—including information systems, concepts of participation, models, and organizational structures. These can be referred to as componentsof managerial practice. Each company can be characterized as having a unique configuration of tools that can be recognized as the company profile. This paper analyzes the conceptual adherence (i. e., the relationship between theory and practice) of the managerial accounting practices of medium-sized and large Brazilian companies. Statistical multivariate analysis has allowed for the identification of five clusters within the group of companies studied. The main conclusion for the sample is that conceptual adherence to tactical components is greater than to strategic components. In addition, it is apparent that the newer components have not been widely adopted in the sample, similar to other field studies in the UK and USA.
IIII
NTRODUCNTRODUCNTRODUCNTRODUCTIONTIONTIONTIONIn an environment that is volatile and uncertain, predictive planning tools should enable an organization to work more efficiently in seeking to control its future through the use of management-control tools (OTLEY, 1994). In this context, Scapens (1994) has consistently discussed the gap between theory and practice in management accounting, and has maintained that uncertainty can be reduced by information. Hansen, Otley and Van der Stede (2003) have agreed that there is a gap between theory and practice. Despite the long-term interest, this important issue remains unresolved.
An organization relies on various resources to maintain its competitive advantage and ensure its ongoing success. These resources include information systems, economic/financial concepts, models, and organizational structures. These resource components affect management practices, and each organization is characterized by a certain profile of components—which determines the overall profile of the organization. Some organizations possess many components, whereas others have few. In addition, organizations construct different strategic plans because they differ in the ‘ingredients’ (or set of components) that they can utilize in their plans.
The above discussion raises the question of the resources that organizations are using as a basis for their management accounting. Some studies into this matter have been conducted, but many of them have had a limited methodological and conceptual perspective. Methodology has been limited in terms of samples. Conceptual analysis has been limited in terms of understanding the nature of management accounting itself. These limitations in methodology and conceptual analysis are understandable—given the fact that management accounting is a relatively new discipline that has developed over recent decades. Given these limitations in previous research, a Brazilian survey comparing theory with actual practice in management accounting (that is, the degree of ‘adherence’ between theory and practice) constitutes the first step in understanding the current status of this discipline in Brazil.
This study deals with medium-sized and large organizations. This sample was chosen because small organizations present difficulties in terms of obtaining trustworthy information. The research question guiding this study is: Among Brazilian medium-sized and large companies, what is the ‘degree of adherence’ between actual practice and the theoretical framework of management accounting?
This research is justified by various factors. In the first place, given the scarcity of empirical studies in this area, this contribution is significant in offering guidance for improved management performance—especially in terms of how company management makes use of components. Secondly, a significant number of the entities studied in this research are publicly traded—thus offering a deeper understanding of this issue for financial markets in making decisions concerning future investments and assessments of corporate governance. Finally, given that the concept of ‘management accounting’ can mean different things to different people, this analysis will help to identify the vital elements that constitute effective practice in management accounting.
C
C
C
C
ONCEPTUAL ONCEPTUAL ONCEPTUAL ONCEPTUALR
R
R
R
EVIEWEVIEWEVIEWEVIEWAccording to Otley (1986), it is unlikely that generalized systems of management accounting will be successful—because they need to be customized if they are to offer answers to the questions raised by the specific circumstances of the organization in which they will be used. Previous studies have attempted to analyze the nature of management accounting in various countries (AMAT; CARMONA; ROBERTS, 1994; ASK; AX; JONSSON, 1996; BESCOS; MENDOZA, 1995; WIJEWARDENA; DE ZOYSA, 1999). In 1998, the International Federation of Accountants (IFA) issued a statement entitled ‘International Management Accounting Practice 1’ (IMAP 1, 1998), which identified certain stages in the evolution of management accounting. Four stages were identified.
. Stage 1: Prior to 1950, the main focus of management accounting was cost determination and financial control through a budget. In this stage, budgets, forecasts, and process controls were the major activities.
. Stage 2:This stage witnessed the growing importance of information supply through technologies, an emphasis on decision-making analysis, and responsible accounting.
. Stage 3: In this stage, attention has been given to waste-reduction projects and cost management.
. Stage 4: Value creation became the main attraction in this stage, while using drivers that link up clients, shareholders and organizational innovation.
On the basis of the IFA approach, the following elements were identified as the focus of the present study: structured costing systems, formalized strategic and budget planning, management reports, waste-reduction programs and value-management systems.
In addition to the IFA approach, a review of the literature reveals other elements of the accounting taxonomy that are worthy of mention.
Otley (1994), referring to Anthony, Dearden and Bedford (1984), considered that management accounting is the main tool for management control. Although Anthony, Dearden and Bedford (1984) distinguished both strategic planning and operations from management control, Otley (1994) recognized that, in practical terms, they are closely related. Baines and Langfield-Smith (2003) classified the following elements as more-advanced management-accounting practices: quality-improvement programs, product-profitability analysis, benchmarking, customer-profitability analysis, shareholder-value analysis (EVA), target costing, activity-based costing, activity-based management, value-chain analysis, and product life-cycle analysis. Most of these elements were included in this study, albeit not always explicitly. Chenhall and Langfield-Smith (1998) included strategic planning in management control—as does the present study.
In the following pages, the taxonomy will be detailed (Table 4). In this table, certain elements are identified in the first column. These elements correspond to certain stages in the IFA staging of management accounting discussed above. In the third column, the identified elementsare considered in terms of certain variables. Corresponding to these variables are certain components of management accounting (fourth column).
The ‘profile’ of a company is then considered to result from the extent to which it possesses and uses these various components. Certain organizations have a clearcut profile (and can be fitted easily into the framework of IFA staging), whereas others are more difficult to characterize. Part of this difficulty arises from various corporate understandings of what is covered by each of named components named.
For the market, investment cost is clearly defined, but the benefits do not seem to be as clearly worked out.
R
R
R
R
ESEARCH ESEARCH ESEARCH ESEARCHD
D
D
D
ESIGNESIGNESIGNESIGNThe research structure of the present study was based on the approach developed by Henry (1990) in terms of: (i) the type of study; (ii) the population to be studied; (iii) elements of the sample; (iv) variables of interest; (v) data collection; and (vi) statistical analysis. Each of these is considered below.
Type of
Type of
Type of
Type of S
S
S
Study
tudy
tudy
tudy
The present study was undertaken as a descriptive study—based on primary data collected by the author. The specific aims of the field research were:
. to identify a population of Brazilian medium-sized and large companies;
. within various organizations, to identify the range of management-accounting components utilized (as described in the literature), and to determine the degree of adherence between theory and practice;
. to collect and analyse data in a manner that facilitates the provision of an answer to the matter under research;
. to describe management accounting in Brazil in terms of an organization’s economic sector and size, therby allowing their profiles to be characterized;
. to analyze the different profiles of Brazilian medium-sized and large companies and, thus, to identify organizational clusters; and
. to identify any instances of the absence of management tools.
Population
Population
Population
Population
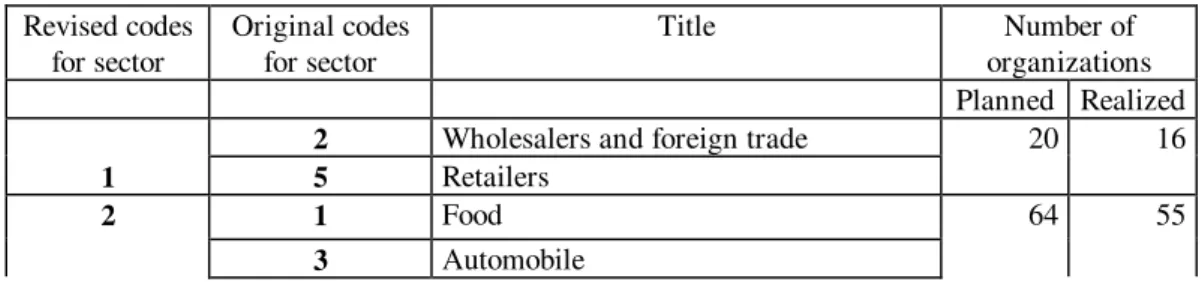
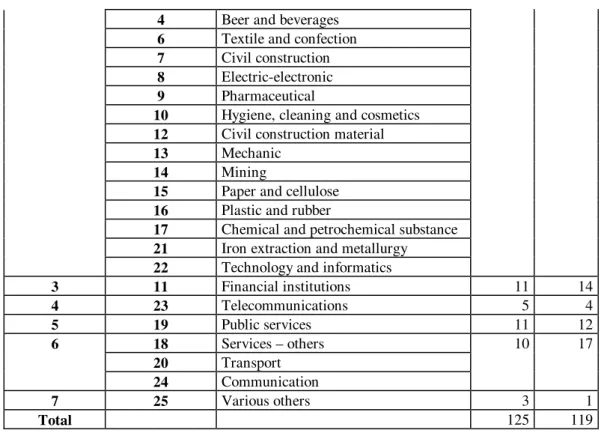
The population for the study included a range of organizations—including multinational, national, public, and private businesses—from all states of the Brazilian federation. The definition of a medium-sized company was based on the criteria of the Brazilian Economic and Social Development Bank (BNDES), which considers a medium-sized company to be one with annual revenues in excess of US$18 million. The database of the Brazilian magazine Melhores e Maiores was used as the source of organizational information for defining the study population. In total, 2,281 organizations were identified as medium-sized or large. The total income of this group was US$502 billion in 2001. The organizations had originally been divided into 25 layers by the magazine. These were reorganized into seven sectors according to annual revenue in dollars (Table 1).
Table 1: Segmentation of Population Per Sector
Revised codes for sector
Original codes for sector
Title Number of
organizations Planned Realized
2 Wholesalers and foreign trade
1 5 Retailers
20 16
2 1 Food 64 55
4 Beer and beverages
6 Textile and confection
7 Civil construction
8 Electric-electronic
9 Pharmaceutical
10 Hygiene, cleaning and cosmetics
12 Civil construction material
13 Mechanic
14 Mining
15 Paper and cellulose
16 Plastic and rubber
17 Chemical and petrochemical substance
21 Iron extraction and metallurgy
22 Technology and informatics
3 11 Financial institutions 11 14
4 23 Telecommunications 5 4
5 19 Public services 11 12
6 18 Services – others 10 17
20 Transport
24 Communication
7 25 Various others 3 1
Total 125 119
Elements of the
Elements of the
Elements of the
Elements of the S
S
S
Sample
ample
ample
ample
Owing to the average finite population, a 10% error (in relation to the average) and a sample of 125 entities was defined in the work plan. In the field study, 119 entities were obtained on the basis of valid data returns, which was considered satisfactory (Tables 2 and 3). The entities were identified randomly, taking into acount sector and size.
Table 2: Population and Sample
Description Planned Realized
Total population–entities 2,281 2,281
Sample size–entities 125 119
% sample/total population 5.4 5.2
Statistical error –(%) 10.0 12.2
Questionnaires sent 190 204
Cases in questionnaires sent 38 34
% of interviewed cases 30 29
Table 3: Sample Segmentation and Statistical Error
Level of revenues per year in US$
Planned Realized
Entities Error % Error in US$ Entities Error % Error in US$
Up to 50 million 30 10.0 3,260 20 12.1 4,100
>50 but <100 16 10.0 7,000 16 10.0 7,000
>100 but <250 25 10.0 15,300 17 12.4 19,000
>250 but <500 10 3.4 12,000 16 2.2 7,600
>500 but <1,000 13 10.0 69,000 20 7.7 53,000
>3,000 but <30,000 9 49.7 3,000,000 7 61.4 3,700,000
Total 125 10.0 119 12.2
Variables of
Variables of
Variables of
Variables of IIIInterest
nterest
nterest
nterest
The elements, variables, and components described above (see ‘Conceptual review’) are shown in Table 4.
Table 4: Elements, Variables, and Components – Rational
Elements MA Stage
origin
Variables Components
Structured costing system
1 Costing methods
Standard cost
Costing methods (absorption-ABC, absorption–others, variable and direct)
Existence of standard cost
Strategic planning Vision, Mission, Long-term Goals, External Scenarios and Long-Term Operational Plan
Budget Assumptions, Mkt plan,
Production+supplies+storage, Human Resources,
Investment Plan, Projected Financial Statements Strategic and budget
planning
1
Budget control Analysis of revenues, expenses and costs, net income analysis, return on net equity, cash flow
analysis, EVA, MVA
Entity segmentation Cost center, investment center, business unit Management focus Product group, business areas, markets,
clients, projects Management reports 2
Information on system integration
ERP fully or partially implemented or non-existent
Waste reduction programs
3 Waste reduction program
Waste reduction program
Value management systems
4 Indicators Return on Net Equity, EVA, MVA, BSC
In descriptive research such as this, conceptual problems can arise with the terminology used to describe these variables. For example, having a ‘budget system’ can imply a whole series of plans to one respondent, whereas to another a ‘budget system’ might imply nothing more than a financial statement forecast. Questions were therefore structured carefully in a manner that allowed the researcher to conclude whether (and to what extent) the components of that element were actually present in the business entity being considered.
. from the relatively more basic to the more complex or complete (in terms of concept or resource);
. from natural precedence to the last to be obtained (in terms of concept); or
. from the least required to the most desirable (from a conceptual perspective).
Adding up the scores for each component led to the total score possible(SP) in hierarchical terms. An
adherence percentage was obtained by dividing the sum of score obtained(SO) in each organization by the score possible(SP) for the component, and expressing the quotient as a percentage. The higher the percentage for a given component, the greater the adherence in relation to the theoretical framework.
Da
Da
Da
Data
ta
ta
ta C
C
Collection
C
ollection
ollection
ollection
A questionnaire was chosen as the instrument for data collection—because it can be used objectively with a broad range, and because it does not invalidate a personal interview (which can be implemented as a qualitative complement). All questionnaires were sent by e-mail and, on their return, a personal interview was arranged. The field study was carried out from April to November 2002, involving three interviewers who maintained contact with the organizations.
Statistical
Statistical
Statistical
Statistical A
A
A
Analysis
nalysis
nalysis
nalysis
This study used the following statistical resources:
. descriptive statistics (mean, standard deviation, minimum and maximum values); and
. multivariate analysis (specifically the cluster technique—to classify the entities and identify different management-accounting profiles).
The most critical aspects of cluster classification was the reliability of the sample. For these purposes, the reliability test, Cronbach’s alpha, is commonly considered to be an adequate measure (HAIR et al., 1995). The coefficient obtained from these data (77.3%) is excellent from any point of view.
Cluster analysis allows researchers “ to classify a sample of entities into a small number of mutually exclusive groups, based on similarities between the entities” (HAIR et al., 1995, p. 15). A hierarchical method was chosen for this research. Among various alternatives to construct a cluster, the furthest neighbor (also called ‘complete linkage’) was chosen. This was done to avoid relation distortions and to increase the chances of obtaining more balanced and symmetrical groups. A maximum of five clusters is enough to separate groups while also forming groups with relative similarity—starting with the group closest to the conceptual approach and ending with the most distant from the conceptual proposal. The following clusters were therefore constructed:
. Cluster 1: the profile that is most distant from the conceptual approach;
. Cluster 2: a profile somewhat distant from the conceptual approach;
. Cluster 3: a profile equally distant from both ends;
. Cluster 4: a profile somewhat adherent to the conceptual approach; and
. Cluster 5: the profile that is most adherent to the conceptual approach.
A
A
A
A
NALYSIS OF NALYSIS OF NALYSIS OF NALYSIS OFV
V
V
V
ARIABLESARIABLESARIABLESARIABLESThe analysis considered two issues—(i) the kinds of clusters; and (ii) differences among them.
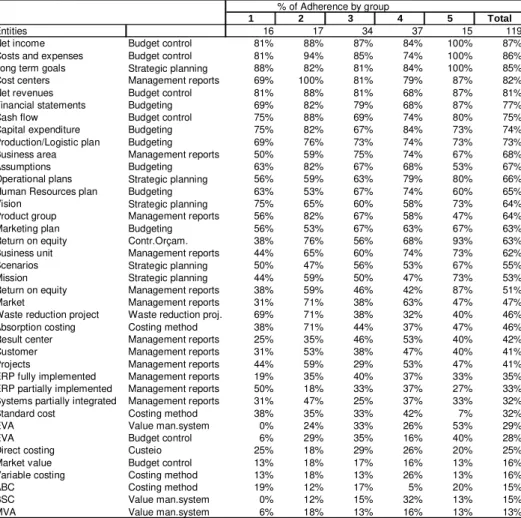
Table 5: Variables Per Degree of Adherence (%)
It is clear that the level of revenues is extremely important in this area. The organizations that displayed greatest adherence to the conceptual framework (cluster 5) were large organizations. In contrast, the organizations with lowest adherence (cluster 1) were the smallest organizations. This study does not offer any evidence to support either of the alternative explanations—that an organization is small because it does not possess a full management-tool usage profile, or that a smaller organization does not possess such tools because it is small.
Table 6: Clusters According to Revenues
Clusters Classification according to revenues in US$million
<50 >50
<100
>100
<250
>250
<500
>500
<1,000
>1,000
<3000
>3000
<30,000
Total
Cluster 1 9 5 0 0 2 0 0 16
Cluster 2 1 0 1 4 1 10 0 17
Cluster 3 8 10 8 3 5 0 0 34
Cluster 4 3 1 8 9 12 4 0 37
% of Adherence by group
1 2 3 4 5 Total
Entities 16 17 34 37 15 119
Net income Budget control 81% 88% 87% 84% 100% 87%
Costs and expenses Budget control 81% 94% 85% 74% 100% 86%
Long term goals Strategic planning 88% 82% 81% 84% 100% 85%
Cost centers Management reports 69% 100% 81% 79% 87% 82%
Net revenues Budget control 81% 88% 81% 68% 87% 81%
Financial statements Budgeting 69% 82% 79% 68% 87% 77%
Cash flow Budget control 75% 88% 69% 74% 80% 75%
Capital expenditure Budgeting 75% 82% 67% 84% 73% 74%
Production/Logistic plan Budgeting 69% 76% 73% 74% 73% 73%
Business area Management reports 50% 59% 75% 74% 67% 68%
Assumptions Budgeting 63% 82% 67% 68% 53% 67%
Operational plans Strategic planning 56% 59% 63% 79% 80% 66%
Human Resources plan Budgeting 63% 53% 67% 74% 60% 65%
Vision Strategic planning 75% 65% 60% 58% 73% 64%
Product group Management reports 56% 82% 67% 58% 47% 64%
Marketing plan Budgeting 56% 53% 67% 63% 67% 63%
Return on equity Contr.Orçam. 38% 76% 56% 68% 93% 63%
Business unit Management reports 44% 65% 60% 74% 73% 62%
Scenarios Strategic planning 50% 47% 56% 53% 67% 55%
Mission Strategic planning 44% 59% 50% 47% 73% 53%
Return on equity Management reports 38% 59% 46% 42% 87% 51%
Market Management reports 31% 71% 38% 63% 47% 47%
Waste reduction project Waste reduction proj. 69% 71% 38% 32% 40% 46%
Absorption costing Costing method 38% 71% 44% 37% 47% 46%
Result center Management reports 25% 35% 46% 53% 40% 42%
Customer Management reports 31% 53% 38% 47% 40% 41%
Projects Management reports 44% 59% 29% 53% 47% 41%
ERP fully implemented Management reports 19% 35% 40% 37% 33% 35%
ERP partially implemented Management reports 50% 18% 33% 37% 27% 33%
Systems partially integrated Management reports 31% 47% 25% 37% 33% 32%
Standard cost Costing method 38% 35% 33% 42% 7% 32%
EVA Value man.system 0% 24% 33% 26% 53% 29%
EVA Budget control 6% 29% 35% 16% 40% 28%
Direct costing Custeio 25% 18% 29% 26% 20% 25%
Market value Budget control 13% 18% 17% 16% 13% 16%
Variable costing Costing method 13% 18% 13% 26% 13% 16%
ABC Costing method 19% 12% 17% 5% 20% 15%
BSC Value man.system 0% 12% 15% 32% 13% 15%
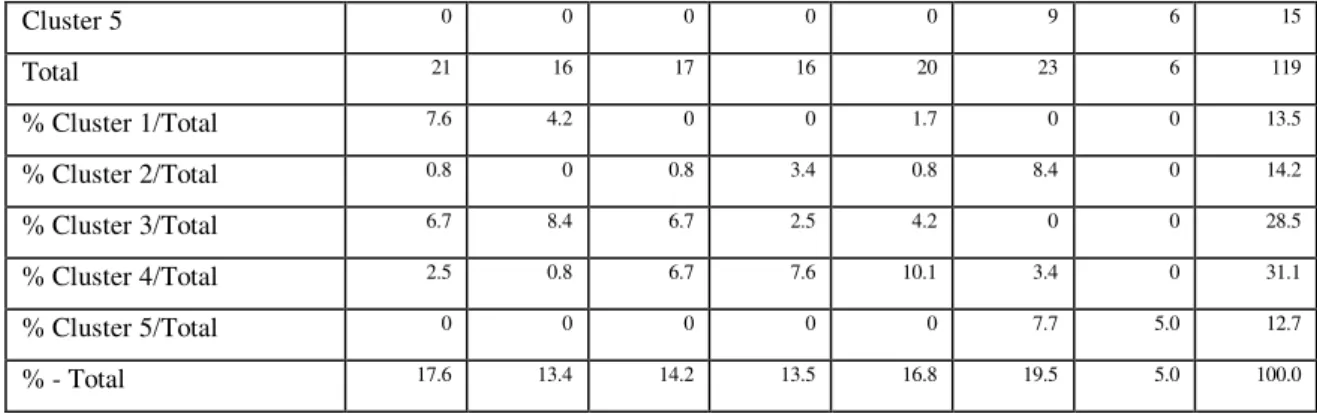
Cluster 5 0 0 0 0 0 9 6 15
Total 21 16 17 16 20 23 6 119
% Cluster 1/Total 7.6 4.2 0 0 1.7 0 0 13.5
% Cluster 2/Total 0.8 0 0.8 3.4 0.8 8.4 0 14.2
% Cluster 3/Total 6.7 8.4 6.7 2.5 4.2 0 0 28.5
% Cluster 4/Total 2.5 0.8 6.7 7.6 10.1 3.4 0 31.1
% Cluster 5/Total 0 0 0 0 0 7.7 5.0 12.7
% - Total 17.6 13.4 14.2 13.5 16.8 19.5 5.0 100.0
Financial institutions are most prevalent in cluster 5. This makes sense because they are relatively more subject to rapid changes and because management accounting is increasingly seen as a way of decreasing business risk. In contrast, the industrial sector is more represented in cluster 1; this could be associated with a traditional and stable business.
Clusters 2, 3, and 4 are relatively larger because they include entities with heterogeneous management-accounting profiles.
Table 7: Sector Clusters
Clusters Sector
Foreign
trade
whole-salers and
retailers
Industries
in general
Financial
institutions
Telecom-munication Public
services
Transport,
services
and
communica
tion
Others Total
Cluster 1 2 7 1 1 1 4 0 16
Cluster 2 2 12 1 0 2 0 0 17
Cluster 3 6 18 2 1 6 0 1 34
Cluster 4 4 17 4 1 3 8 0 37
Cluster 5 2 1 6 1 0 5 0 15
Total 16 55 14 4 12 17 1 119
% Cluster 1 /Total 1.7 5.9 0.8 0.8 0.8 3.4 0 13.4
% Cluster 2/Total 1.7 10.1 0.8 0 1.7 0 0 14.3
% Cluster 3/Total 5.0 15.1 1.7 0.8 5.0 0 0.8 28.6
% Cluster 4/Total 3.4 14.3 3.4 0.8 2.5 6.7 0 31.1
% Cluster 5/Total 1.7 0.8 5.0 0.8 0 4.2 0 12.6
% - Total 13.4 46.2 11.8 3.4 10.1 14.3 0.8 100.0
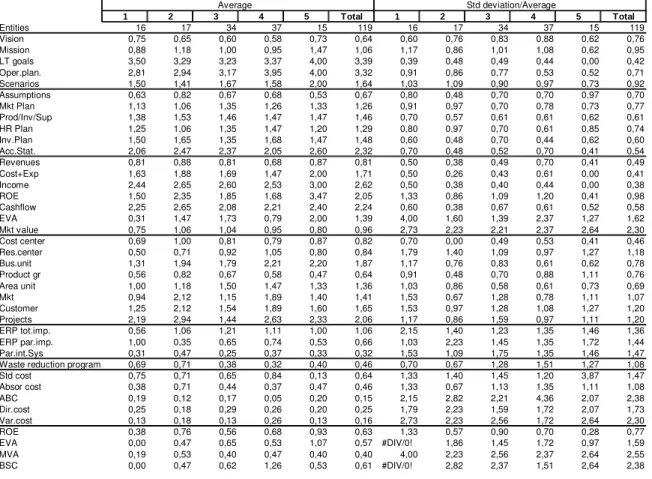
Table 8: Cluster Characteristics–Ordinal Measure Results
C
C
C
C
LUSTER LUSTER LUSTER LUSTER1
1
1
1
Cluster 1 contained the profiles that were relatively most distant from the conceptual approach. This cluster represented 13.4% of the total number of sample entities. The elements emphasized by the entities did not offer the benefits of mutual synergy and consistency.
The following elements were noted in this cluster.
. Costing systems: Activity-based costing (ABC) obtained approximately the same degree of adherence as cluster 5 (which is the highest score possible).
. Strategic planning: As a part of strategic planning, it is surprising that the vision component obtained the same adherence score as in cluster 5. One possible explanation is that, although vision is very important, it is not enough if the entity does not have a structured and formal planning system.
. Budget and budget control: Apart from revenues, no other component stood out.
. Management reports:Total implementation of enterprise-resource planning (ERP) systems received the lowest score in this cluster—which could justify the lesser emphasis on strategic planning, budget, and control, given database management difficulties. This is likely to be the explanation for the state of this group—because, in practice, the information system is the heart of the model.
Average Std deviation/Average
1 2 3 4 5 Total 1 2 3 4 5 Total
Entities 16 17 34 37 15 119 16 17 34 37 15 119
Vision 0,75 0,65 0,60 0,58 0,73 0,64 0,60 0,76 0,83 0,88 0,62 0,76
Mission 0,88 1,18 1,00 0,95 1,47 1,06 1,17 0,86 1,01 1,08 0,62 0,95
LT goals 3,50 3,29 3,23 3,37 4,00 3,39 0,39 0,48 0,49 0,44 0,00 0,42
Oper.plan. 2,81 2,94 3,17 3,95 4,00 3,32 0,91 0,86 0,77 0,53 0,52 0,71
Scenarios 1,50 1,41 1,67 1,58 2,00 1,64 1,03 1,09 0,90 0,97 0,73 0,92
Assumptions 0,63 0,82 0,67 0,68 0,53 0,67 0,80 0,48 0,70 0,70 0,97 0,70
Mkt Plan 1,13 1,06 1,35 1,26 1,33 1,26 0,91 0,97 0,70 0,78 0,73 0,77
Prod/Inv/Sup 1,38 1,53 1,46 1,47 1,47 1,46 0,70 0,57 0,61 0,61 0,62 0,61
HR Plan 1,25 1,06 1,35 1,47 1,20 1,29 0,80 0,97 0,70 0,61 0,85 0,74
Inv.Plan 1,50 1,65 1,35 1,68 1,47 1,48 0,60 0,48 0,70 0,44 0,62 0,60
Acc.Stat. 2,06 2,47 2,37 2,05 2,60 2,32 0,70 0,48 0,52 0,70 0,41 0,54
Revenues 0,81 0,88 0,81 0,68 0,87 0,81 0,50 0,38 0,49 0,70 0,41 0,49
Cost+Exp 1,63 1,88 1,69 1,47 2,00 1,71 0,50 0,26 0,43 0,61 0,00 0,41
Income 2,44 2,65 2,60 2,53 3,00 2,62 0,50 0,38 0,40 0,44 0,00 0,38
ROE 1,50 2,35 1,85 1,68 3,47 2,05 1,33 0,86 1,09 1,20 0,41 0,98
Cashflow 2,25 2,65 2,08 2,21 2,40 2,24 0,60 0,38 0,67 0,61 0,52 0,58
EVA 0,31 1,47 1,73 0,79 2,00 1,39 4,00 1,60 1,39 2,37 1,27 1,62
Mkt value 0,75 1,06 1,04 0,95 0,80 0,96 2,73 2,23 2,21 2,37 2,64 2,30
Cost center 0,69 1,00 0,81 0,79 0,87 0,82 0,70 0,00 0,49 0,53 0,41 0,46
Res.center 0,50 0,71 0,92 1,05 0,80 0,84 1,79 1,40 1,09 0,97 1,27 1,18
Bus.unit 1,31 1,94 1,79 2,21 2,20 1,87 1,17 0,76 0,83 0,61 0,62 0,78
Product gr 0,56 0,82 0,67 0,58 0,47 0,64 0,91 0,48 0,70 0,88 1,11 0,76
Area unit 1,00 1,18 1,50 1,47 1,33 1,36 1,03 0,86 0,58 0,61 0,73 0,69
Mkt 0,94 2,12 1,15 1,89 1,40 1,41 1,53 0,67 1,28 0,78 1,11 1,07
Customer 1,25 2,12 1,54 1,89 1,60 1,65 1,53 0,97 1,28 1,08 1,27 1,20
Projects 2,19 2,94 1,44 2,63 2,33 2,06 1,17 0,86 1,59 0,97 1,11 1,20
ERP tot.imp. 0,56 1,06 1,21 1,11 1,00 1,06 2,15 1,40 1,23 1,35 1,46 1,36
ERP par.imp. 1,00 0,35 0,65 0,74 0,53 0,66 1,03 2,23 1,45 1,35 1,72 1,44
Par.int.Sys 0,31 0,47 0,25 0,37 0,33 0,32 1,53 1,09 1,75 1,35 1,46 1,47
Waste reduction program 0,69 0,71 0,38 0,32 0,40 0,46 0,70 0,67 1,28 1,51 1,27 1,08
Std cost 0,75 0,71 0,65 0,84 0,13 0,64 1,33 1,40 1,45 1,20 3,87 1,47
Absor cost 0,38 0,71 0,44 0,37 0,47 0,46 1,33 0,67 1,13 1,35 1,11 1,08
ABC 0,19 0,12 0,17 0,05 0,20 0,15 2,15 2,82 2,21 4,36 2,07 2,38
Dir.cost 0,25 0,18 0,29 0,26 0,20 0,25 1,79 2,23 1,59 1,72 2,07 1,73
Var.cost 0,13 0,18 0,13 0,26 0,13 0,16 2,73 2,23 2,56 1,72 2,64 2,30
ROE 0,38 0,76 0,56 0,68 0,93 0,63 1,33 0,57 0,90 0,70 0,28 0,77
EVA 0,00 0,47 0,65 0,53 1,07 0,57 #DIV/0! 1,86 1,45 1,72 0,97 1,59
MVA 0,19 0,53 0,40 0,47 0,40 0,40 4,00 2,23 2,56 2,37 2,64 2,55
. Waste reduction programs: This was significant because most sample entities were from the industrial sector.
. Value-management systems: No organization used EVA or balanced scorecard (BSC), and other indicators received low scores. This demonstrates that value management is not a priority for this cluster.
C
C
C
C
LUSTER LUSTER LUSTER LUSTER2
2
2
2
Cluster 2 contained the profiles that were somewhat distant from the conceptual approach. This group represented 14.3% of the total sample. It is interesting that this cluster was not strong on strategic planning, but stronger than the previous cluster on some budget and budget-control elements. With respect to information systems, this cluster demonstrated two extremes—(i) entities that fully implemented an ERP; and (ii) those that had not yet implemented such a system and were still working with a non integrated system.
The following elements were noted in this cluster.
. Costing systems: This group emphasized the use of absorption criteria.
. Strategic planning: No element stood out for this component.
. Budget and budget controls: From the budget perspective, the premises and theproduction, supply, and storage plan obtained the highest scores in the sample. The investment plan and financial statements were also significant. In the case of control, cash flow and market value-added were the main points of focus for the market—which could indicate high control expectations based on complex management structures.
. Management reports: Scores for integrated ERP were relatively high in comparison with other clusters, in combination with a focus on information per area, cost center, product (reported by 100% of the entities in this cluster), product group, markets, client, and projects. In short, detailed and integrated information was available in this group to a greater extent than in others, but was not used for planning and control.
. Waste reduction programs: This cluster obtained the highest score in the sample with respect to this kind of element.
. Value-management systems: MVA received the highest average score in this cluster—consistent with the answers that indicated market value as an important subject for business control.
C
C
C
C
LUSTER LUSTER LUSTER LUSTER3
3
3
3
Cluster 3 contained the profiles that were equallyfrom both ends. This cluster corresponded to 28.5% of the total sample. The following elements were noted in this cluster.
. Costing systems: There was an emphasis on direct costing—which received the highest score in the sample.
. Budget and budget controls: With respect to budget, emphasis was placed on the marketing plan. From a budget-control perspective, EVA obtained one of the highest scores in the sample.
. Management reports: This area stands out as a focus of information. The highest level of implemented ERPs was found in this cluster.
. Waste reduction programs: This received no significant score in comparison with the total sample.
. Value-management systems: No significant score was recorded in comparison with the total sample.
C
C
C
C
LULULULUSTER STER STER STER4
4
4
4
Cluster 4 contained the profiles that were somewhat adherent to the conceptual approach. This cluster includes the largest number of sample entities (31.2% of the total sample). The following elements were noted in this cluster.
. Costing systems: This cluster had the highest average score for standard cost—which is important as a sign of more developed management accounting. The variable costing method obtained the highest score in this cluster.
. Strategic planning: There was no special emphasis on this element in this cluster.
. Budget and budget controls: From a budget perspective, the highest scores were for human-resource, production, supply, storage, and investment plans.
. Management reports: The elements that stood out were information per result center, business unit, area and project.
. Waste reduction programs: There were no significant scores for this item within the cluster.
. Value-management systems: The highest score for the use of the balanced scorecard was found in this cluster.
C
C
C
C
LUSTER LUSTER LUSTER LUSTER5
5
5
5
This was the profile that was most adherent to the conceptual approach. This cluster represented 12.6% of the sample and is clearly distinct from the other groups on the basis of consistency and a strong focus on strategic as well as tactical components. The following elements were noted in this cluster.
. Costing systems: ABC was the only component emphasized in this cluster, but it was not homogeneous across the cluster. It is somewhat surprising that, in this cluster, standard cost received the lowest score of the entire sample. One possible explanation is the small number of industrial companies in this cluster.
. Budget and budget controls: With respect to budget, the projected financial statement component received the highest score. Although other components were close, they were not as prominent. This might indicate that, in developing the annual budget, entities in this cluster emphasize only financial projections, but that this is not applied consistently in their plans. With respect to budget control, apart from control of cash flow the scores were no different from those of other clusters. A standard deviation analysis revealed that all the entities in this cluster indicated that control of costs, expenses, and profit were part of their focus—an observation that was not homogeneously apparent in the other clusters.
. Management reports: One characteristic of this cluster was the availability of information from business units—because this group included only large companies.
. Waste reduction programs: This component did not stand out.
. Value-management systems: EVA and return on earnings (ROE) received the highest scores among all the clusters analyzed.
F
F
F
F
INAL INAL INAL INALC
C
C
C
OMMENTSOMMENTSOMMENTSOMMENTSProfile clusters of management accounting are important in understanding the present practice within organizations and in forecasting tendencies and opportunities. In particular, an assessment of the degree of adherence between theory and practice is important. Although this study makes no claim regarding the generalizability of its conclusions, some observations can be made.
First, organizations within the Brazilian economy are at different stages in their utilization of management accounting. These differences are significant. Cluster 5 of the present study contained those organizations with a profile characterized by the closest adherence to the contemporary conceptual view. At the other end of the spectrum, Cluster 1 represented those organizations with a profile least adherent to the theory. This does not mean that the former cluster posessed all components and that the latter did not. Rather, it means that these various clusters used the various components in different ways and to varying extents.
Secondly, the clusters indicate significant differences in the ‘state of the art’ of the entities. There were similarities and differences in the intermediate clusters (clusters 2, 3 and 4) that do not mutually compensate. This must be studied more carefully if it is to be properly understood.
Thirdly, a link can be observed between entity size and cluster type. Management accounting development was most advanced in the larger companies, but was being incorporated only slowly into the smaller ones. This phenomenon is not restricted to Brazil, and has been reported by several researchers (SCAPENS, 1994; OTLEY, 1994).
Fourthly, this analysis did not observe any linkage between economic sector and cluster. This is unsurprising in view of the sample distribution.
Fifthly, cluster 5 was clearly characterized by a strong consistency between strategy and tactics. Consistency between planning and control was also clearly present in this cluster. In contrast, the opposite was observed in cluster 1 (in which the emphasized elements were not integrated or linked synergistically.
Sixthly, the variables analyzed in this study can be segmented into traditional or more-advanced
time now, and in view of the fact that the trading environment becomes more complex with greater uncertainty, a greater degree of adherence to these useful more-advanced elements might be expected. Some of these more-recent contributions include: standard cost (32% adherence), EVA as part of a value-management system and budgetary control (29% and 28% respectively), ABC (15% adherence), BSC (15% adherence), and MVA (13% adherence).
Because this was a descriptive study, questions of causation and consequence have not been explored. These matters lie outside the scope of this paper, but will be explored as another step in the larger project that gave rise to this article.
Artigo recebido em 25.11.2004. Aprovado em 02.02.2005.
A
A
A
A
CKNOWLEDGMENTCKNOWLEDGMENTCKNOWLEDGMENTCKNOWLEDGMENTThe author thanks CNPq and FIPECAFI for supporting the project that led to this paper.
R
R
R
R
EFERENCESEFERENCESEFERENCESEFERENCESAMAT, J.; CARMONA, S.; ROBERTS, H. Context and change in management accounting systems: a Spanish case study. Management Accounting Research, [S.L.], v. 5, p. 107-126, june 1994.
ANTHONY, R. N.; DEARDEN, J.; BEDFORD, N. Management Control Systems. Homewood: Irwin,1984.
ASK, U.; AX, C.; JONSSON, S. Cost management in Sweden: from modern to post-modern. In: BHIRMANI, A. (Ed.) Management Accounting: European Perspectives. 1th ed. Oxford: Oxford University Press, p. 199-217, 1996.
BAINES, A.; LANGFIELD-SMITH, K. Antecedents to management accounting change: a structural equation approach. Accounting, Organization and Society, [S.L.], v. 28, p. 675-698, oct./nov. 2003.
BESCOS, P. L.; MENDOZA, C. ABC in France. Management Accounting (UK), [S.L.], p. 33-41, apr. 1995.
CHENHALL, R. H.; LANGFIELD-SMITH, K. The relationship between strategic priorities, management techniques and management accounting: an empirical investigation using a system approach, Accounting, Organization and Society, [S.L.], v. 23, n. 3, p. 243-264, apr.1998.
HAIR JR, J. A. et al. Multivariate data analysis. 5. ed. Upper Saddle River: Prentice Hall, 1995.
HANSEN, S. C.; OTLEY, D. T.; VAN DER STEDE, W. Practice developments in budgeting: an overview and research perspective. Journal of Management Accounting Research, [S.L.], v. 15, p. 95-116, 2003.
HENRY, G. Practical sampling. 1th ed. London: Sage, 1990.
OTLEY, D. Accounting control and organizational behaviour, 1 th ed. Oxford: CIMA, 1986.
______. Management control in contemporary organizations: towards a wider framework.
Management Accounting Review, [S.L.], v. 5, 1994, p. 289-299, sept. 1994.
SCAPENS, R. W. Never mind the gap: towards an institutional perspective on management accounting practice. Management Accounting Review, [S.L.], v. 5, p. 301-321, sept. 1994.