Determinants of Audit Fees: a Study in the Companies Listed on the
BM&FBOVESPA, Brazil*
Walther Bottaro de Lima Castro
Fundação Escola de Comércio Álvares Penteado, Departamento de Pós-Graduação, São Paulo, SP, Brazil.
Ivam Ricardo Peleias
Fundação Escola de Comércio Álvares Penteado, Departamento de Pós-Graduação, São Paulo, SP, Brazil.
Glauco Peres da Silva
Universidade de São Paulo, Faculdade de Filosoia, Letras e Ciências Humanas, Departamento de Ciências Políticas, São Paulo, SP, Brazil.
Received on 01.16.2015 – Desk acceptance on 02.27.2015 – 3rd version approved on 07.03.2015.
ABSTRACT
This paper analyzes the determinants of audit fees paid by companies listed on the BM&FBOVESPA. Data referring to listed companies for 2012 show a positive relationship between fees and the variables size, client’s complexity, and Big N auditors. The risk perceived by the auditor demonstrated to affect the values of fees differently in larger and smaller clients. In smaller clients, the results suggest that the auditor charges lower fees to more leveraged and riskier clients, contrary to the hypothesis that the auditor might charge higher fees as a reward for his risk. In turn, in larger clients, the results demonstrate that clients with higher risk, as measured by liquidity and leverage, or those having stronger governance practices, tend to spend more on auditing. As for changing the auditor, the results pointed out that larger clients pay less in the first year of audit. These results qualify the findings of Hallak and Silva (2012), suggesting the need for further research with temporally more extensive bases.
Keywords: audit expenses, audit fees, Big N.
1 INTRODUCTION
sis on English-speaking countries. Some of these stu-dies point out convergence in the sense that clients’ size and complexity are the main determinants of fees char-ged (Köhler & Ratzinger-Sakel, 2012; Haskins & Willia-ms, 1988; Hassan & Naser, 2013; Kwon, Lim, & Simnett, 2014). Others indicate that the market pays higher va-lues for large companies in the industry (Palmrose, 1986; Thinggaard & Kiertzner, 2008), perhaps because of firms’ good reputation and market concentration.
Such research field is still embryonic in Brazil and little has been studied about the determinants of fees charged by the firms existing here. There is mandatory disclosure of fees in Brazil since 2009, when data used in the only re-search so far carried out in the country on the subject first became available (Hallak & Silva, 2012). Thus, it seeks to answer this question: which are the determinants of audit fees paid by Brazilian companies?
The contribution and academic relevance of this work derive from its analysis of the determinants of audit fees in the Brazilian context, addressing data from a new re-ference date (2012) and adding new variables, something which enables better understanding of the phenomenon of interest. It also contributes to market operation – with regard to grasping how fees are calculated – when pro-viding information for negotiations between firms and their clients. The results obtained may encourage audi-ted companies to seek new options of auditors, increasing competitiveness in the sector, as well as the development of new firms.
Supervision of performance and assurance of accoun-tability in management are key in corporate governance, and external audit constitutes a significant tool for main-taining good governance levels. In the 1980s and 1990s, large external audit firms (hereinafter firms) have gone through mega-mergers that reduced their number from eight – Big 8 – to five – Big 5 (Abidin, Beattie, & Gooda-cre, 2008). Added with accounting scandals in the 2000s – which led to Arthur Andersen’s termination –, the last decades have seen the consolidation of this sector around the current Big 4 (hereinafter Big N).
This concentration accentuates the value assigned to the accounting information quality. The case Enron re-veals that the reputation of firms has close ties with the independent audit conducted by them. Audit has value to the extent that investors and the market believe that the auditor is independent and, as a consequence, he will report significant distortions determined in the audited company, thus reducing expenses due to opportunistic behavior of managers (agency costs) (Watts & Zimmer-man, 1983). The concentration of the auditing industry undermines competitiveness and reduces the options available to audited companies; such concentration, along with accounting scandals and the importance of auditing for corporate governance shed light on professional inde-pendence issues and the determination of external audi-tors’ fees.
Studies on the determination of audit fees have been conducted since 1980 (Simunic, 1980), with an
2 LITERATURE REVIEW
2.1 Audit Fees
The value of an audit lies on the perception coming from users of audited statements on the auditor’s abili-ty to detect errors or breaches in the accounting system and to resist client pressures to disclose such discoveries (DeAngelo, 1981a). Auditing will have value to the ex-tent that users of financial statements believe that the auditor is capable and he will not omit or deliberately choose which findings should be reported.
The calculation of fees is a sensitive issue, where pro-fessional ethics and the interest of auditing did not allow that the prices budgeted are too high or too low. Marra and Franco (2001) suggest that the best way – for clients – to charge fees might be using a fixed and invariable va-lue. Nevertheless, this procedure might lead to very high fees, damaging the client, or very low, damaging the au-ditor, having in mind that prices are budgeted by taking into account the number of hours or days required to conduct the audit. The intuitive pricing of expenses is calculated through a simple equation between estimated
number of hours (cost) and hourly rate to be applied, which may be expressed by this equation:
AudE = HR x RT Where:
AudE: Audit expenses
HR: Estimated number of hours RT: Hourly rate to be charged
This calculation method enables the auditor to ne-gotiate charging additional hours when the amount of hours significantly differs from that budgeted.
and corporate governance levels are not explicitly inclu-ded in the text of this standard, but they affect the cost of services to be provided, as well as the number of hours estimated for their execution.
Due to the conjuncture describe above and, in order to align the factors described by the NBC P1 to previous studies, the factors affecting the determination of fees were, in this study, divided into two groups, namely: global and specific. Global factors cover the “Cost of Services and Estimated Hours,” reaching many of the determinants listed in the NBC P1, and also the factor “Market Opportunities,” which encompasses aspects not related to the cost and time span of services, but it addresses market and client-related opportunities and issues; in turn, specific factors are introduced throu-ghout the paper.
A significant factor to assess client risk and to ca-librate the extent of audit testing consists in assessing the internal control environment. The CFC Resolution 1,212/2009 recommends that, in addition to assessing the internal control structure, in order to identify the relevant risks, an auditor must measure, among others, the risk factors inherent to client’s sector and its fun-ding form (Conselho Federal de Contabilidade, 2009). Simunic (1980) and Palmrose (1986, 1989) indicate that client’s sector significantly affects fees.
By determining the extent of sampling and testing, the auditor assesses the risk of auditing financial ac-counts and relevant procedures; such an assessment usually occurs after hiring and, in case of a failure in the estimation of fees, the auditor may have to undergo losses, because in spite of the possibility to negotiated additional fees, charging them is not guaranteed.
It is worth observing that an overall assessment of client risk occurs even before the audit is hired – i.e. still within the client acceptance process –, so that the audi-tor can estimate more accurately the number of hours required and the fees. This assessment will influence the amount of hours estimated to execute the service and the fee to be charged, as well as the decision whether to accept the client.
If a firm accepts a successful client, honest, with competent management and appropriate internal con-trols, the use of normal auditing procedures will enable the auditor to issue his opinion in the right way, and the reverse is true (Huss & Jacobs, 1991).
Such a general evaluation is also significant for plan-ning, but it does not comprise a detailed analysis of rele-vant procedures and financial accounts; as it occurs even before hiring, the information addressed by the auditor are rather related to business risks, client’s industry is-sues, governance profile, and funding structure, than to internal procedures, control risks, and features of book accounts.
Upon the fees budget, the assessment of procedures and financial accounts takes place in a superficial way, because the audit is still in the valuation phase, and that the auditor should estimate his fees before even knowing
and having appropriate access to the procedures and book accounts involved. It is also worth stressing that, if this survey occurred, this might result in an expense ei-ther to the auditor or the company, prior to the effective hiring of services.
Marra and Franco (2001) notice that the likelihood of errors in the estimation of audit fees would be lower if the auditor could conduct this survey prior to budget the auditing cost. However, the client might need to be willing to pay the cost of surveys, regardless of whether hiring the services.
2.2 Previous studies
A part of the academic studies addressing the re-lationship of risks and corporate governance does not converge completely. The literature suggests an inver-se relationship between cost of fees and internal con-trol. In addition, reported internal control deficiencies tend to positively affect the cost of fees.
Hogan and Wilkins (2008) investigated how audi-tors respond to higher internal control risk levels. To do this, they analyzed 410 companies listed on the U.S. Stock Exchange that had reported material weaknesses in internal control. Thus, the authors found that audit fees are significantly higher for companies that sho-wed significant weaknesses in internal control.
Munsif, Raghunandan, Rama and Singhvi (2011) corroborate this view by analyzing the behavior of au-dit fees in companies that have remedied deficiencies in internal control. Studies have shown that the fees paid tended to decline when compared to other com-panies that continued reporting internal control defi-ciencies.
Felix Jr., Gramlinga and Maletta (2001) found that internal audit contributes to reduce fees. This fact reinforces the premise that the quality of internal con-trol structures helps to reduce auditing costs, showing that the internal audit quality affects a company’s in-ternal controls.
In December 2000, the BM&FBOVESPA created the corporate governance levels in Brazil, whose pur-pose, among others, was distinguishing the internal control levels of listed companies.
Firms that adhere to corporate governance levels are more profitable and safer for investors (Macedo & Siqueira, 2006). So, they are expected to have higher requirement levels in board of directors’ organization and structure, enabling the use of various levels cre-ated by the BM&FBOVESPA as a proxy to indicate companies with better internal controls and observe whether they contribute to reduce fees.
Stewart and Kent (2006) showed that companies with greater governance structures pay higher fees.
Yatim, Kent and Clarkson (2006) provided the governance instruments with greater detail and they observed a positive relationship between fees and in-dependence of the board and the audit committee, as well as the frequency of meetings of the audit com-mission. According to the authors, this fact, from the temporal perspective, may require greater interaction of these agents with external auditors, requiring a gre-ater number of meetings.
Griffin, Lont and Sun (2008) studied the contro-versial relationship between corporate governance and audit fees. The results of this study suggest that better corporate governance has reduced these costs after the U.S. Sarbanes Oxley Act. Better governance levels re-quire more audit services; however, the auditor seems to notice an improved quality of financial statements and internal controls, a factor which decreases fees.
In studies conducted in Brazil, the results are also mixed. Bortolon, Sarlo and Santos (2013) observed a negative relationship between corporate governance and auditing costs, suggesting that better governance practices have reduced the external audit risks, leading to lower charges. Hallak and Silva (2012) found that companies with better corporate governance levels spend more on audit.
However, internal controls generate impacts on other observable variables in the results of a company. An inverse relationship to that expected for good in-ternal control levels can occur when there is high leve-rage, low liquidity, and losses. These factors were used, in previous studies, as proxies of the risk perceived by an auditor, also without converging conclusions.
Zaman, Hudaib and Haniffa (2011), by using fi-nancial leverage as a risk measure, observed a positive relationship with auditing costs, concluding that leve-raged companies require greater monitoring – in order to protect themselves from financial and market risks – and that the auditor can charge higher fees as a risk premium. Conversely, Naser and Nuseibeh (2008) – as well as Hallak and Silva (2012) – found a significant negative relationship between leverage and expenditu-res on audit. Sandra and Patrick (1996) and also Thin-ggaard and Kiertzner (2008) used leverage and liquidi-ty to measure the risk of auditing clients; however, the results were insignificant. Waresul Karim and Moizer (1996) found that client risks are statistically insignifi-cant to determine fees.
Other authors (Brinn, Peel, & Roberts, 1994; Bell, Landsman, & Shackelford, 2001) used clients’ liquidity to represent the risk of audits and they obtained evi-dence indicating that this variable is significant to de-termine fees. Another proxy used in previous studies in order to assess firms’ risk is that evaluating whether the client had losses within the last 3 years (Ireland & Lennox, 2002; Kwon et al., 2014).
Since the first paper (Simunic, 1980), the variable
“total assets” is the most widely used to measure com-pany size. Joshi and AL‐Bastaki (2000) mention seve-ral authors who concluded that client size is the most significant variable to explain fees. In turn, Brinn et al. (1994) indicate that clients’ size and complexity were the most significant factors to determine audit expen-ses.
Another factor under study is firms size; the large ones, known as Big N, have become consolidated in the market. Similarly, studies have shown the positive relationship between firm size and the quality of its services (Palmrose, 1986; Brinn et al., 1994; Waresul Karim & Moizer, 1996; Thinggaard & Kiertzner, 2008; Hassan & Naser 2013).
DeAngelo (1981b) observes that audit quality is not independent in relation to the size of the company car-rying it out; the larger the audit firm – measured by the number of clients – the smaller incentive for an auditor to behave inappropriately for establishing or maintaining a client. In other words, the higher finan-cial independence of large audit firms puts them at a less vulnerable position in relation to client pressures. This fact contributes to a greater perception of audit quality.
Furthermore, other studies show that the Big N charge premium fees, when compared to smaller firms in the sector (Francis, 1984; Palmrose, 1986; Whise-nant, Sankaraguruswamy, & Raghunandan, 2003; An-dré, Broye, Pong, & Schatt, 2011; Kwon et al., 2014).
Waresul Karim and Moizer (1996) report that pre-mium fees are justified because Big N firms have hi-gher quality teams and they apply better procedures, so it is expected that they better identify errors. Other studies notice that premium fees paid to Big N firms might be related to the fact that the market reacts more favorably when a client chooses a large firm (Nichols & Smith, 1983; Lennox, 1999).
However, the results of studies on audit quality and firm size are not convergent. Braunbeck (2010) conclu-ded that, in Brazil, BIG N firms provide higher quality services; Lawrence, Meza and Zhang (2011) analyzed the differences between audit quality of Big N compa-nies and non-Big N compacompa-nies, concluding that such a difference is insignificant.
Another factor under study is changing the auditor. When a client decides to change the auditor, the new one is elected, inter alia, by taking into account firms with better prices and conditions. Köhler and Ratzin-ger-Sakel (2012) found strong reductions in fees when auditors changed. Deis and Giroux (1996) and Simon and Francis (1988) highlighted that change is associa-ted with significant reductions in fees; this behavior might be justified by firms on the grounds that, to es-tablish new clients, they could charge lower initial va-lues, adjusting them later.
beha-vior is a competitive response from auditors and it does not necessarily hinder independence. It is worth noticing that, in the Brazilian context, such conduct is not per-mitted by the Conselho Federal de Contabilidade [Bra-zilian Federal Board of Accountancy] (2003) – through the NBC P1 – and it consists in non-compliance with the accountant’s code of ethics.
Nevertheless, audit cost does not necessarily follow this initial reduction; when it comes to new audits, au-ditors tend to apply more time to grasp business, risks, and thus deine auditing strategies. his process tends to
be quicker in recurrent audits, due to the expertise and knowledge acquired in previous years.
DeAngelo (1981a) also points out that, in audits where initial costs are signiicant, the auditor who is already in the entity enjoys a competitive advantage in further au-dits.
It is noticed that understanding of determinants of audit costs is controversial; although there is the same expectation with regard to the way how certain variables must afect these costs, new empirical approaches are nee-ded to make progress in knowledge about the theme.
3 METHODOLOGY AND LIMITATIONS
To analyze the determinants of audit fees, a multiple regression model was applied, through which this study aims to identify how and which variables impact on audit fees (dependent variable).
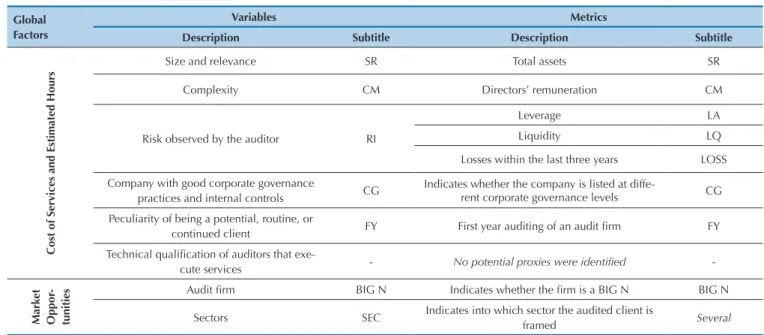
Table 1 summarizes this analysis and reorders factors with the variables and metrics observed in previous studies and also in the NBC P1.
Table 1 Factors and their respective metrics to determine the audit fees
Global Factors
Variables Metrics
Description Subtitle Description Subtitle
Cost of Services and Estimated Hours
Size and relevance SR Total assets SR
Complexity CM Directors’ remuneration CM
Risk observed by the auditor RI
Leverage LA
Liquidity LQ
Losses within the last three years LOSS
Company with good corporate governance
practices and internal controls CG
Indicates whether the company is listed at
diffe-rent corporate governance levels CG
Peculiarity of being a potential, routine, or
continued client FY First year auditing of an audit irm FY
Technical qualiication of auditors that
exe-cute services - No potential proxies were identiied
-Market Oppor
-tunities
Audit irm BIG N Indicates whether the irm is a BIG N BIG N
Sectors SEC Indicates into which sector the audited client is
framed Several
Source: Prepared by the authors.
Table 1 aims to demonstrate the relationship between the variables impacting on fees and the related metrics; such demonstration is relevant, because the variable risk may be measured in more than one way, which will re-sult in the presentation of more than one regression in this research, although this is the same model.
The rules requiring disclosure of audit fees do not require disclosure of the amount of hours and the rates use, and this information is restricted to the relationship between auditor and audited client. If such information were disclosed, it might be possible to analyze the effects
of the variables on each of these perspectives (hours and rates) and, as a consequence, intuitively grasp their im-pact on the calculation of fees.
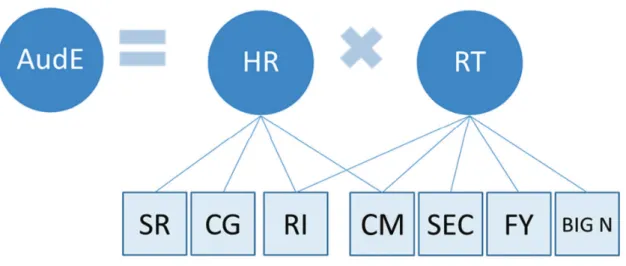
costs of experts to market opportunities.
Figure 1 aims to establish a theoretical connection between the primary and intuitive way how fees are cal-culated by auditors and the variables shown in previous
studies and the NBC P1.
Figure 1 condenses the basic formula introduced ear-lier in this topic (circles), interconnected to the variables (squares) of Table 1.
Figure 1 shows that variables such as Size and Relevance (SR) and Corporate Governance (CG) mainly impact the amount of hours that the auditor needs to execute the au-dit. In parallel, other variables – such as the fact that the audit irm is a BIG N, as well as the company sector (SEC) – impact the rate value to be applied, but they do not afect, in theory, the amount of hours needed for the audit. his occurs because the number of hours is not afected, but the rate is, indeed, because there may be both the charge of premium fees as it is a BIG N irm and increased rates in some sectors – given the need for participation of expert auditors, whose cost might be higher.
he governance metrics has a natural tendency to redu-ce the amount of hours. A company with good governanredu-ce and controls enables the auditor to test internal controls and considerably reduce the substantive audit procedures.
he risk metrics perceived by the auditor may impact the two quadrants: amount of hours and charged rate. he higher the risk, the higher the level of procedures an au-ditor must perform to achieve conidence. In parallel, the auditor may consider charging a higher price (rate) as a premium for the risk taken.
For this study, data on audit expenses of the compa-nies analyzed were obtained in reference forms available on the CVM website; in turn, market and inancial data were obtained from Economática. he initial population totaled 380 companies listed on the BM&FBOVESPA that reported their inancial statements for the year 2012, until August 26, 2013; out of these, 45 were excluded for not in-forming all data required for analysis, resulting in a sample of 335 companies.
he dependent variable under study was the total
an-nual expenditure on audit, in Brazilian reais. he explana-tory variables and the metrics adopted are described; for variables with two or more metrics, models were applied for each metrics, in order to verify which is best related to the factor under study.
he explanatory variables and their respective metrics are described below:
◆ Company size and relevance (SR): in line with pre-vious studies and, particularly, with Chan, Ezzamel and Gwilliam (1993) – who observed that the variable audited company size is mostly represented by total assets – total assets in millions of Brazilian reais were used with metrics;
◆ Client complexity (CM): the total remuneration of the board of directors was used, as well as that of the statutory board of directors and supervisory board of directors, in millions of Brazilian reais.
Studies conducted in the UK have used as a metrics the variable number of subsidiaries (Simunic, 1980; Brinn et al., 1994), perhaps due to the high internationalization le-vel of companies in that region. Taking the characteristics of the Brazilian economy into account, it may be assumed that the internationalization level of Brazilian companies is considerably lower, something which could limit the use-fulness of this metrics.
We chose to use, in an innovative way, the remunera-tion received by directors as a metrics of complexity and igure. he hypothesis that rather complex companies tend to spend more on administrators was established, this is due to the fact that a larger number – and more qualiied – of these professionals is needed;
hese metrics were used in previous studies, and their re-sults are oten divergent; in the scenario of this study, in an innovative way in the Brazilian context, the three metrics on the model were used, in order to see which are signii-cant and applicable;
◆ Internal control and governance levels (CG): just as Hallak and Silva (2012), we used a dummy variable repre-senting the possibility that the client is at some corporate governance level diferent from the BM&FBOVESPA, dis-regarding diferences between these divergent listing levels; this variable is a proxy to relect the best internal control levels and the best governance practices in companies;
◆ Auditor change: just as in previous studies (Deis Jr. & Giroux, 1996; Gregory & Collier, 1996; Whisenant et al., 2003), a dummy variable was used to indicate whether in the year under observation the irst auditor is named. he aim is verifying the practice of auditors to reduce their fees – in the irst year of audit –, in order to establish the new client and subsequently adjust such a reduction. Even ater the requirement created by the CVM, i.e. there should be a rotation of auditors in Brazil, it is expected that this practi-ce is identiied in spracti-cenarios with voluntary auditor change and in cases of mandatory rotation. his is so because the process to hire a new auditor requires competition – betwe-en many audit irms – which focuses, among other aspects, on fees. his competition usually includes the large audit irms, which dominate the Brazilian market;
◆ Audit irm: the variable BIG N was used to verify whe-ther the large companies charge premium fees when com-pared to the other ones. hen, regressions were performed with four dummy variables, one for each large irm (DTT, EY, KPMG, PWC), seeking to identify which irms charge higher or lower fees, as well as to check whether the efect of premium fees applies to each of the Big N irms;
◆ Sector: for each sector where the companies operate, models were tested by using the natural values with dummy variables – representing the sector where the client its – to identify higher or lower risk perception, from the auditor’s viewpoint. In the inal models, the dummy variables were maintained for the sectors with a signiicant efect.
Previous studies have shown a nonlinear association between the fees charged and the varying complexity and size; hence, these variables were presented in natural loga-rithm, just as in Francis (1984), Palmrose (1986), Zaman et al. (2011), Haskins and Williams (1988).
Due to the characteristics of the goals set out in this research, expectations about the behavior of factors un-der study in relation to the audit costs may be developed. hus, the expected relations between these factors and the amount paid on fees will are displayed:
◆ SR = Company size and relevance: it is expected that audit expenses are positively related to companies size and importance;
◆ CM = Complexity: it is expected that the complexity and igure of the audited company positively impact on au-dit expenses;
◆ RI = Risk perceived by the auditor in relation to the audited company: it is expected to observe a positive rela-tionship between risk and audit fees;
◆ CG = Corporate governance level and best practices in internal control: it is expected that the relation between audit expenses and corporate governance and internal con-trols is opposed to the risk perceived by the auditor. his expectation is grounded on the assumption that companies with best practices in internal controls and corporate go-vernance result in lower audit costs, because they provide the auditor with greater comfort and, as a consequence, re-duced efort and cost to execute the audit;
◆ FY = First year auditing and auditing irm change: it is expected that the audit fees behave negatively in relation to the fact that the company is undergoing the irst year with the new auditing service;
◆ BIG N = he audit irm is among the large ones in the sector: it is expected that this variable has a positive beha-vior along with audit fees;
◆ SEC = Sector: it is expected that certain sectors impact audit fees, in order to verify that auditors observe higher or lower risks in these sectors. he expectation is that variables in the sectors have some signiicance, however, a speciic behavior (positive or negative) is not initially expected.
4 EMPIRICAL RESULTS
4.1 Descriptive Statistics
Table 2 shows the correlation of explanatory variables with auditing expenses.
Table 2 Correlation matrix between the explanatory variables and the dependent variable
Factors Variable / Metrics
Correlation P value
Subtitle Description Subtitle Description
SR Size and relevance SR Total assets 0.79 100%
CM Complexity CM Directors’ remuneration 0.69 0%
RI Risk perceived by the auditor regarding the company
LA Leverage 0.05 0%
LQ Liquidity (0.03) 36%
Some preliminary observations on the initial correla-tions are worth highlighting:
◆ Strong positive correlation between the variables to-tal assets and directors’ remuneration, which represent, respectively, size and relevance and companies complexity, being in line with initial expectations. Another observation is the low correlation between variables;
◆ he variable FY showed a weak correlation, but nega-tive, indicating a trend of reduction in audit fees in audit irm changes;
◆ In line with the expectation that BIG N irms charge premium fees, the variable BIG N provided a positive but weak correlation;
◆ he variable CG showed a weak and positive corre-lation;
◆ he variables LA, LQ, and LOSS – which represent companies risk – provided insigniicant correlation values.
As for the sectors, there was a large concentration of the inancial industry, with about 30% of audit fees and the hi-ghest average value. Second, the electricity industry, with 8% of the total, and, unlike the inancial industry, with fees scattered among several irms (50), corresponding to 14% of the total amount. It is noticed that 47% of the companies under analysis are at diferent corporate governance sec-tors. In 55% of cases, it was the irst year the new auditor was providing services, due to the fact it was a year of audit rotation.
Table 3 displays the distribution of audit fees between each of the BIG N companies and the other companies (others).
Source: Prepared by the authors.
CG Corporate governance level and best
practi-ces in internal control GC
Dummy variable indicating whether the company is listed at different corporate governance levels
0.19 5%
FY Peculiarity of being an occasional, routine,
or continued client FY
Dummy variable that indicates whether this is the irst year auditing of an audit company
(0.11) 0%
BIG N Audit irm
BIG N Dummy variable indicating whether the auditing irm is a BIG N 0.17 3%
PWC
Dummy variable indicating whether the audit company is PricewaterhouseCoo-pers
0.17 0%
KPMG Dummy variable indicating whether the
audit company is KPMG (0.03) 0%
EY Dummy variable indicating whether the
audit company is Ernst & Young (0.06) 61%
DTT Dummy variable indicating whether the
audit company is Deloitte 0.02 25%
Table 2 Continuation
Table 3 Distribution of audit fees by company
COMPANY Value of fees Clients Average K
value R$
K R$ % Amount %
PRICEWATERHOUSECOOPERS 167,346 41% 74 21% 2,261
KPMG 90,751 22% 59 16% 1,538
DELOITTE TOUCHE TOHMATSU 75,637 19% 60 17% 1,261
ERNST & YOUNG 55,794 14% 75 21% 744
OTHERS 16,227 4% 91 25% 178
TOTAL 405,755 100% 359 100% 1,130
Source: Prepared by the authors.
he expected concentration of the audit market in the Big N companies was found, which account for 96% of the fees and 75% of the audited clients. Pricewaterhou-seCoopers stood out, with fees 84% higher than those of KPMG, the second largest in terms of the amount char-ged. he analysis of the amount of clients reveals a rather uniform distribution between the 4 large irms, and the
portion of other audit irms (not Big N) becomes more representative.
4.2 Results of Regressions
determinants of fees are not homogeneous in the sample un-der study.
his fact may be justiied by the fact that the pricing of fees considers market factors and business opportunities as variables, due to client size. For instance, the auditor may charge higher fees for larger clients, because of their inan-cial capacity. hus, it was decided to separate the sample into
two groups, namely: companies with total assets up to R$ 1 billion; and over R$ 1 billion.
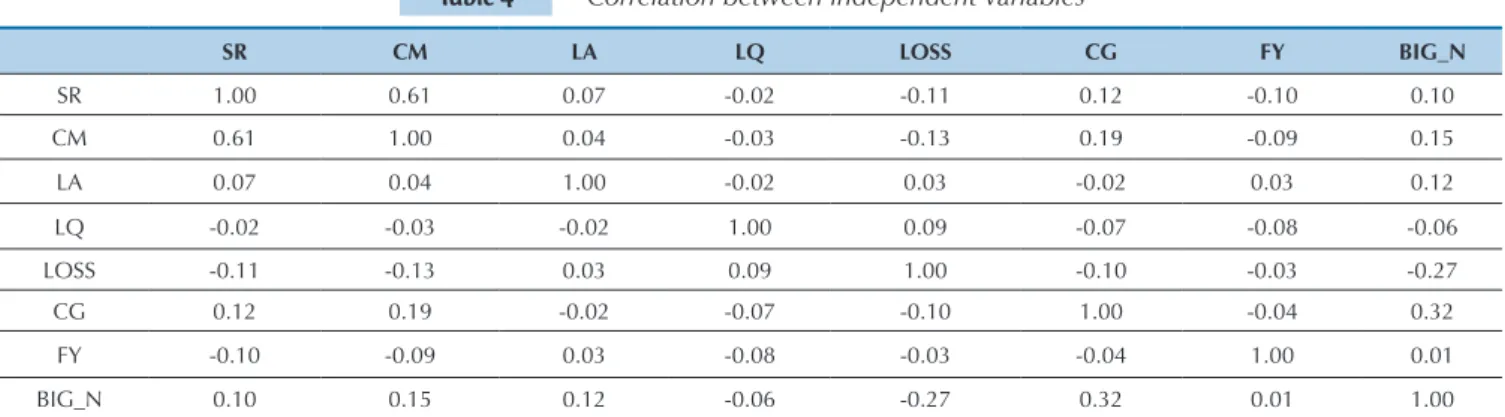
Due to the natural relationship between some metrics, such as Company Size (SR) and Complexity (CM) - repre-sented by the variable directors remuneration - the correla-tion between variables was analyzed to detect worrying mul-ticollinearity levels, whose results are displayed in Table 4.
Table 4 Correlation between independent variables
Table 5 Correlation between independent variables
SR CM LA LQ LOSS CG FY BIG_N
SR 1.00 0.61 0.07 -0.02 -0.11 0.12 -0.10 0.10
CM 0.61 1.00 0.04 -0.03 -0.13 0.19 -0.09 0.15
LA 0.07 0.04 1.00 -0.02 0.03 -0.02 0.03 0.12
LQ -0.02 -0.03 -0.02 1.00 0.09 -0.07 -0.08 -0.06
LOSS -0.11 -0.13 0.03 0.09 1.00 -0.10 -0.03 -0.27
CG 0.12 0.19 -0.02 -0.07 -0.10 1.00 -0.04 0.32
FY -0.10 -0.09 0.03 -0.08 -0.03 -0.04 1.00 0.01
BIG_N 0.10 0.15 0.12 -0.06 -0.27 0.32 0.01 1.00
Source: Prepared by the authors.
In line with Gujari and Porter (2011), the correlation indexes shown in Table 4 were below 0.8 – something which allows to rule out the hypotheses of a high mul-ticollinearity level. he variance inlation factors (VIFs), whose results ruled out the possibility of high multicolli-nearity levels in the sample under analysis.
With a sample separated – due to its size – into two parts, through total assets, it was sought to verify whether clients of various sizes change the auditor’s perception on determinants of fees. For instance: in smaller clients,
the auditor may take into account the risk taken, because the premium he will receive has a natural limiter due to company size and inancial capability. Due to heterosce-dasticity, all models have been corrected and calculated by using the robust error estimator proposed by White (1980).
Table 5 shows the inal models maintained in the sam-ple divided by size. Overall, two regressions were main-tained for large companies – as two risk variables were signiicant – and one for smaller companies.
Companies with assets over R$ 1 billion and risk measured by liquidity
Companies with assets over R$ 1 billion and risk measured by leverage
Companies with assets below R$ 1 billion and risk measured by leverage
_(1)_ _(2)_ _(3)_
LOG (SR) 0.42777***
(0.0582)
0.4392*** (0.0575)
0.2365*** (0.0654)
LOG (CM) 0.2575*** (0.0665) 0.2535*** (0.0670) 0.2626*** (0.0671)
LA 0.0024** (0.0009) -0.0229* (0.0108)
LQ -0.04549*
(0.0230)
FY -0.3628** (0.1271) -0.3681** (0.1270) (0.1365)-0.0698
CG (0.1334)0.2472* 0.2534* (0.1344) (0.1664)0.2259
DTT 0.5364** (0.1874) 0.5248** (0.1869) 0.6812* (0.3053)
EY (0.2017)0.1572 (0.2027)0.1274 0.6056** (0.1873)
KPMG (0.2016)0.0766 (0.2012)0.0730 0.9553*** (0.2265)
PWC 0.45301* (0.1800) 0.4164* (0.1794) 0.8850*** (0.1953)
FIN 0.1236
(0.1659)
B&F 0.5056* (0.2264)
0.4947* (0.2244)
CHE -0.7254***
(0.2578)
S&M (0.3002)0.7312* 0.7179* (0.3001)
SOFT 1.3624***
(0.2482) Observations
Adjusted R²
226 50.95%
226 50.77%
109 66.67% Table 5 Continuation
Robust standard errors in parentheses *** p<0.01, ** p<0.05, * p<0.1 Source: Prepared by the authors.
It was observed, in all models, that client size (SR) had a positive and signiicant impact on audit fees. hese re-sults reinforce the explanatory power of this variable and corroborate previous research (Simunic, 1980; Palmrose, 1986; Brinn et al., 1994; Joshi & AL‐Bastaki, 2000; Köhler & Ratzinger-Sakel, 2012; Hallak & Silva, 2012, Hassan & Naser, 2013; Kwon et al., 2014).
In order to verify whether the risk perceived by the auditor afects fees, regressions were tested for three di-ferent proxies, in order to measure risk: losses (LOSS), liquidity (LQ), and leverage (LA). he results obtained showed a diferent behavior according to companies size. It is possible to observe that, just as Sandra and Patrick (1996), hinggaard and Kiertzner (2008), and Hassan and Naser (2013), the metrics liquidity did not show signii-cant results in smaller companies; the metrics loss was insigniicant in all models tested.
In large companies, the metrics liquidity – used in gression 1 – showed strong signiicance and a negative re-lationship, corroborating the fact that clients with higher risk demand higher fees. Unlike leverage (the higher, the greater risk), liquidity has an inverse relationship, because higher indexes indicate greater inancial capacity to pay its liabilities, and lower ones indicate less inancial capaci-ty, as a consequence, greater risk.
Model 2 corroborates the indings of model 1. In mo-del 2, the metrics leverage was signiicant at 1% and it showed a positive relationship, demonstrating that the greater a company’s leverage degree, the higher the fees charged by the auditor.
Models 1 and 2 found that, for large clients, the auditor charges higher fees in the presence of higher risk, reinfor-cing indings of previous studies (Brinn et al., 1994; Bell et al., 2001; Zaman et al., 2011). he hypothesis that for clients with higher risk the auditor charges higher fees is corroborated, both due to increased eforts to monitor risks and to charging a premium for that risk.
Curiously, it was observed in regression 3 that, for small companies, leverage showed signiicance. However, the beta obtained is negative, suggesting that the auditor might charge lower fees for small-sized leveraged clients, corroborating the paper by Hallak and Silva (2012), but contrary to the hypothesis that the auditor might charge
higher fees as a premium for the risk taken.
he results obtained herein demonstrate the impor-tance of analyzing companies divided by size, allowing us to verify that the auditor evaluates some aspects of com-panies diferently according to size.
Due to the nature of inancial institutions’ activities – and, as a consequence, in changing the dynamics of leve-rage and liquidity among these companies when compa-red to other sectors – a regression was performed without inancial companies, in order to check whether such a dynamics could impact on the behavior of risk metrics: liquidity and leverage. he results show that the dummy variable for this sector, used in the models presented, captured in a satisfactory way occasional impacts of this dynamics, since the results without inancial companies were consistent with the global results.
he steel and metallurgy sectors (S&M) and food and beverages (B&F) positively afected the fees paid by large clients. he sotware sector (SOFT) showed to positive-ly afect audit expenses in smaller companies. It may be assumed, when determining fees for clients in these sec-tors, that the auditor perceives greater risk – or estimate increased eforts through more hours required to execute the audit – due, for instance, to a greater complexity in the sector.
he chemical sector (CHE) showed to negatively afect smaller clients, allowing us to assume that this sector re-quires less efort or it is perceived as less risky by the au-ditor. For the other sectors in the sample, there were no signiicant relationships with fees.
It is possible to make a brief comparison with the re-sults obtained herein and indings by Hassan and Naser (2013). When compared to services and trade, the authors identiied that auditors charge lower fees for industrial companies, just as observed in this study in the CHE sec-tor, typically industrial. However, sectors such as S&M, also industrial, had a diferent behavior. Comparisons are limited, because this study addressed sectors instead of industry types.
requi-re morequi-re efort and fees, corroborating prequi-revious studies (O’Sullivan, 2000; Larcker & Richardson, 2004; Köhler & Ratzinger-Sakel, 2012; Hassan & Naser, 2013; Kwon et al., 2014).
As for the relationship between corporate governance (CG) and fees, an insigniicant relationship was observed in small companies; in turn, regarding the large com-panies, there was a signiicant and positive relationship. he initial expectation, i.e. clients with better practices in internal controls and corporate governance might have lower audit costs by providing the auditor with greater comfort and, as a consequence, there would be a reduced efort and cost for the audit was not conirmed. hese re-sults corroborate other aspects of previous studies, which show that clients with higher governance structures tend to spend more on auditing (Goodwin‐Stewart & Kent, 2006; Yatim et al., 2006; Hallak & Silva, 2012).
In line with previous studies that showed a reduction of fees in the irst year auditing (Deis Jr. & Giroux, 1996; Gregory & Collier, 1996; Whisenant et al., 2003), the re-sults obtained in relation to larger companies show a sig-niicant and negative relationship. hese results suggest that the auditor charges less in the irst year to establish new clients, ofsetting the amounts in the following years of the contract. he results suggest that the auditor has greater motivation to establish large clients, reducing fees in the irst year auditing.
he results demonstrate that the practice of reducing fees in the irst year auditing occurs in environments where the change of auditors is required, as in the case of Brazil, where the CVM established such change every ive years. It was found that, regardless of the motivation to change, the new auditors tend to reduce initial fees, se-eking to establish a new client. It is worth noticing that, as of January 1, 2012, the deadline set by the CVM was extended for ten years, through the creation of a statutory audit committee.
he results obtained are in line with that proposed by Kwon et al. (2014), whose research speciically assessed
the impact of mandatory rotation of auditors. Such rese-arch evaluated the behavior of fees before and ater the requirement in South Korea and it found that the rotation of auditors leads, initially, to higher fees. However, the analysis allowed us to observe that, even in a scenario of mandatory rotation, fees in the years following the chan-ge of auditor were higher, making the practice of “low--balling” clear.
his fact demonstrates that the practice of “low--balling” occurs even in scenarios requiring auditor ro-tation. It is clear that comparisons between the indings of Kwon et al. (2014) and this research have limitations, because herein only the year 2012 is under analysis.
Concerning the fact that large irms charge premium fees (variable BIG N), models were tested for the consoli-dated samples and divided by size. All results showed this variable as signiicant and positive, reinforcing previous studies (Francis, 1984; Palmrose, 1986; Brinn et al., 1994; Waresul Karin & Moizer, 1996; Whisenant et al., 2003; hinggaard & Kiertzner, 2008; André et al., 2011; Hallak & Silva, 2012; Kwon et al., 2014), which showed that Big N irms charge higher fees. he reason for this fact may be related to the good reputation of these irms or the concentration in the Brazilian market, which limits the client’s choice of options.
In an innovative way when compared to previous stu-dies, a dummy variable was tested for each of the big ir-ms, and it was maintained in the inal models, seeking to notice the existence of signiicant diferences between the Big N irms.
Based on the results displayed in Table 5, Pricewa-terhouseCoopers (PWC) and Deloitte (DTT) stand out, with signiicant results in all models. EY and KPMG sho-wed no signiicant results in large companies, something which suggests they do not realize to charge higher fees when compared to the other irms. his fact may be rela-ted to major acquisitions made by EY and KPMG within the period under study, something which might have for-ced their fees down.
5 CONCLUSIONS AND FURTHER POSSIBILITIES
This study sought to analyze which factors determine audit fees and present the distribution in the Brazilian audit market among listed companies. The results obtai-ned indicate that fees are positively related to size, client complexity, corporate governance level, and the fact that the auditor works in a large firm.
It was found that complexity – measured by directors’ remuneration – is positively related to the fees charged, corroborating the hypothesis that rather complex clients require greater effort by the auditor and, as a consequen-ce, higher fees.
The effect of Big N firms on budgeted fees showed a positive relationship, corroborating previous studies
that, since the 1980s, have pointed out the charge of premium fees by these firms (Palmrose, 1986; Brinn et al., 1994; Waresul Karim & Moizer, 1996; Thinggaard & Kiertzner, 2008; Hallak & Silva, 2012). The results su-ggest that, in Brazil, higher fees are paid to these firms under the argument that Big N firms have higher quality teams and they apply better procedures (Waresul Karim & Moizer, 1996).
clients, difference in perceived risk between large and small clients, and higher audit expenses among large clients with better corporate governance levels.
For the hypothesis of reduced fees in the first year au-diting with auditor change, the results with large clients indicate that in the first year after auditor change, fees tend to be reduced, supporting the hypothesis that the auditors might charge less in the first year to regain this money in the subsequent years.
The risk perceived by the auditor demonstrated to affect the values of fees, differently in large and small clients. In smaller ones, leverage had a strong significan-ce, however, the results suggest that the auditor charges lower fees for more leveraged and lower-risk clients, contrary to the hypothesis that the auditor might charge higher fees as a premium for the risk taken. Such beha-vior might be related to the fact that clients undergoing financial problems tend to exert more pressure on their auditors to have lower expenses on audit.
In turn, in large companies, the results reinforced previous studies (Brinn et al., 1994; Bell et al., 2001), de-monstrating that clients with greater risk as measured by liquidity and leverage tend to spend more on audit due to the greater effort to monitor risks and the premium charged on risk.
As for corporate governance levels, there was a signi-ficant and positive relationship with fees in large clients. The initial hypothesis that the auditor might charge lo-wer fees on clients with better corporate governance le-vels (Bedard & Johnstone, 2004) was not confirmed, but
such results corroborate the hypothesis proposed by Ya-tim et al. (2006), i.e. higher corporate governance levels require greater effort by the auditor, due to increased need of meetings and interactions with players.
Despite the advances made in recent years in the Bra-zilian audit market, mainly due to the legal requirement that large companies are audited, the disclosure of opi-nion and fee is not mandatory for companies not listed. This fact limits the research field of audit fees among listed companies.
Given the importance of audit to society, it is ex-pected that, in the future, regulated and strategic sec-tors for the country – such as the electrical, financial, telecommunication, and transport industries – require disclosure of fees, opening a new front of research in the determinants of audit fees among companies not listed and those operating in specific sectors, just as in the UK (Brinn et al., 1994).
Further studies may consider new metrics and a pe-riod greater than one year, in order to verify the occur-rence of changes in determinants of audit fees over time, related to unobservable factors in a single year, such as: effect of financial crises, audit rotation, legislation chan-ge, among others.
No studies were found in other Latin countries. Fur-ther studies may address these countries, making a com-parison similar to that by Haskins and Williams (1988), who studied and compared determinants of audit fees in English-speaking countries: USA, UK, Ireland, New Zealand, and Australia.
Abidin, S., V. Beattie and A. Goodacre (2008), Audit Market Structure, Fees and Choice following the Andersen Break-Up: Evidence from the UK. British Accounting Review, 42(3), 187–206.
André, P., Broye, G., Pong, C., & Schatt, A. (2011). Audit fees, big four premium and institutional settings: the devil is in the details. Big Four Premium and Institutional Settings: he Devil is in the Details. Bedard, J. C., & Johnstone, K. M. (2004). Earnings manipulation risk,
corporate governance risk, and auditors' planning and pricing decisions. he Accounting Review, 79(2), 277-304.
Bell, T. B., Landsman, W. R., & Shackelford, D. A. (2001). Auditors' perceived business risk and audit fees: analysis and evidence. Journal of Accounting Research, 39(1), 35-43.
Bortolon, P. M., Sarlo, A., & Santos, T. B. (2013). Custos de auditoria e governança corporativa. Revista Contabilidade & Finanças, 24(61), 27-36.
Braunbeck, G. O. (2010). Determinantes da qualidade das auditorias
independentes no Brasil (Doctoral dissertation, Universidade de São Paulo).
Brinn, T., Peel, M. J., & Roberts, R. (1994). Audit fee determinants of independent & subsidiary unquoted companies in the UK—an exploratory study. he British Accounting Review, 26(2), 101-121. Chan, P., Ezzamel, M., & Gwilliam, D. (1993). Determinants of audit fees
for quoted UK companies. Journal of Business Finance & Accounting, 20(6), 765-786.
Chung, H. H., & Wynn, J. P. (2014). Corporate governance, directors' and oicers' insurance premiums and audit fees. Managerial Auditing Journal, 29(2), 173-195.
Conselho Federal de Contabilidade. Resolução Nº. 976 de 22.8. 2003. Aprova a NBC P 1 – IT 3 – Regulamentação do item 1.4 – Honorários, da NBC P 1 – Normas Proissionais do Auditor Independente. Recuperado em 24 novembro, 2013, de: http://www.cfc.org.br/ sisweb/SRE/docs/RES_976.doc
Correspondence Address:
Walther Bottaro de Lima Castro
WBLC Consultoria
Avenida Susana, 185 – CEP: 04130-000 Vila Gumercindo – São Paulo – SP
E-mail: [email protected]
Conselho Federal de Contabilidade. Resolução Nº. 1.212 de 27.11.2009. Aprova a NBC TA 315 – Identiicação e Avaliação dos Riscos de Distorção Relevante por meio do Entendimento da Entidade e do seu Ambiente. Recuperado em 24 novembro, 2013, de: www.cfc.org.br/ sisweb/sre/docs/RES_1212.doc
DeAngelo, L. (1981a). Elizabeth. “Auditor Independence, ‘Low Balling’ and Disclosure Regulation. Journal of Accounting and Economics (North—Holland Publishing Company), 3(2), 113-117.
DeAngelo, L. (1981b). Auditor size and audit quality. Journal of Accounting and Economics, 3(3), 183-199.
Deis Jr, D. R., & Giroux, G. (1996). he efect of auditor changes on audit fees, audit hours, and audit quality. Journal of Accounting and Public Policy, 15(1), 55-76.
Felix Jr, W. L., Gramling, A. A., & Maletta, M. J. (2001). he contribution of internal audit as a determinant of external audit fees and factors inluencing this contribution. Journal of Accounting Research, 39(3), 513-534.
Francis, J. R. (1984). he efect of audit irm size on audit prices: A study of the Australian market. Journal of accounting and Economics, 6(2), 133-151.
Goodwin‐Stewart, J., & Kent, P. (2006). Relation between external audit fees, audit committee characteristics and internal audit. Accounting & Finance, 46(3), 387-404.
Gregory, A., & Collier, P. (1996). Audit fees and auditor change; an investigation of the persistence of fee reduction by type of change.
Journal of Business Finance & Accounting, 23(1), 13-28. Griin, P. A., Lont, D. H., & Sun, Y. (2008). Corporate governance
and audit fees: evidence of countervailing relations. Journal of Contemporary Accounting & Economics, 4(1), 18-49. Gujarati, D. N., & Porter, D. C. (2011). Econometria Básica. Porto
Alegre: Editora Ailiada.
Hallak, R. T. P., & Silva, A. L. C. (2012). Determinantes das despesas com serviços de auditoria e consultoria prestados pelo auditor independente no Brasil. Revista Contabilidade & Finanças, 23(60), 223-231.
Haskins, M. E., & Williams, D. D. (1988). he association between client factors and audit fees: A comparison by country and by irm.
Accounting and Business Research, 18(70), 183-190.
Hassan, Y. M., & Naser, K. (2013). Determinants of audit fees: Evidence from an emerging economy. International Business Research, 6(8), p.13.
Hogan, C. E., & Wilkins, M. S. (2008). Evidence on the Audit Risk Model: Do Auditors Increase Audit Fees in the Presence of Internal Control Deiciencies?*. Contemporary Accounting Research, 25(1), 219-242.
Huss, H. F., & Jacobs, F. A. (1991). Risk containment: Exploring auditor decisions in the engagement process. Auditing: A Journal of Practice & heory, 10(2), 16-32.
Ireland, J. C., & Lennox, C. S. (2002). he large audit irm fee premium: a case of selectivity bias? Journal of Accounting, Auditing & Finance, 17(1), 73-91.
Joshi, P. L., & AL‐Bastaki, H. (2000). Determinants of audit fees: evidence from the companies listed in Bahrain. International journal of auditing, 4(2), 129-138.
Köhler, A., G., & Ratzinger-Sakel, N. (2012). Audit and non-audit fees in Germany – the impact of audit market characteristic**.
Schmalenbach Business Review: ZFBF, 64(4), 281-307. Kwon, S. Y., Lim, Y., & Simnett, R. (2014). he Efect of Mandatory
Audit Firm Rotation on Audit Quality and Audit Fees: Empirical Evidence from the Korean Audit Market. Auditing: A Journal of Practice & heory, 33(4), 167-196.
Larcker, D. F., & Richardson, S. A. (2004). Fees paid to audit irms, accrual choices, and corporate governance. Journal of Accounting Research, 42(3), 625-658.
Lawrence, A., Minutti-Meza, M., & Zhang, P. (2011). Can Big 4 versus non-Big 4 diferences in audit-quality proxies be attributed to client characteristics?. he Accounting Review, 86(1), 259-286.
Lennox, C. S. (1999). Audit quality and auditor size: An evaluation of reputation and deep pockets hypotheses. Journal of Business Finance & Accounting, 26(7‐8), 779-805.
Macedo, M., & Siqueira, B. (2006). Estudo da governança corporativa no Brasil através de uma análise comparativa do IGC e do IBOVESPA no período de 2002 a 2005. In 6º Congresso de Controladoria e Contabilidade.
Marra, E., & Franco, H. (2001). Auditoria contábil (4. ed.). São Paulo: Atlas.
Munsif, V., Raghunandan, K., Rama, D. V., & Singhvi, M. (2011). Audit fees ater remediation of internal control weaknesses. Accounting Horizons, 25(1), 87-105.
Naser, K., & Nuseibeh, R. (2008). Determinants of audit fees: empirical evidence from an emerging economy. International Journal of Commerce and Management, 17(3), 239-254.
Nichols, D. R., & Smith, D. B. (1983). Auditor credibility and auditor changes. Journal of Accounting Research, 534-544.
O’Sullivan, N. (2000). he impact of board composition and ownership on audit quality: evidence from large UK companies. he British Accounting Review, 32(4), 397-414.
Palmrose, Z. V. (1986). he efect of nonaudit services on the pricing of audit services: Further evidence. Journal of accounting research, 405-411.
Palmrose, Z. V. (1989). he relation of audit contract type to audit fees and hours. he Accounting Review, 64(3), 488-499.
Sandra, W. M., & Patrick, P. H. (1996). he deteminants of audit fees in HongKong: An empirical study. Asian Review of Accounting, 4(2), 32-50.
Simon, D. T., & Francis, J. R. (1988). he efects of auditor change on audit fees: Tests of price cutting and price recovery. Accounting Review, 255-269.
Simunic, D. A. (1980). he pricing of audit services: heory and evidence. Journal of accounting research, 161-190.
hinggaard, F., & Kiertzner, L. (2008). Determinants of audit fees: evidence from a small capital market with a joint audit requirement. International Journal of Auditing, 12(2), 141-158. Waresul Karim, A. K. M., & Moizer, P. (1996). Determinants of audit
fees in Bangladesh. he International Journal of Accounting, 31(4), 497-509.
Watts, R. L., & Zimmerman, J. L. (1983). Agency problems, auditing, and the theory of the irm: Some evidence. Journal of law and Economics, 613-633.
Whisenant, S., Sankaraguruswamy, S., & Raghunandan, K. (2003). Evidence on the Joint Determination of Audit and Non‐Audit Fees.
Journal of Accounting Research, 41, 721-744.
White, H. (1980). A heteroskedasticity-consistent covariance matrix estimator and a direct test for heteroskedasticity. Econometrica:
Journal of the Econometric Society, 817-838.
Yatim, P., Kent, P., & Clarkson, P. (2006). Governance structures, ethnicity, and audit fees of malaysian listed irms. Managerial Auditing Journal, 21(7), 757-782. doi:http://dx.doi.
org/10.1108/02686900610680530