Determinants of Financial Literacy: Analysis of the Influence of
Socioeconomic and Demographic Variables*,**
Ani Caroline Grigion Potrich
Universidade Federal de Santa Maria, Centro de Educação Superior Norte-RS, Departamento de Administração, Palmeira das Missões, RS, Brazil.
Kelmara Mendes Vieira
Universidade Federal de Santa Maria, Departamento de Administração, Programa de Pós-Graduação em Administração, Santa Maria, RS, Brazil.
Guilherme Kirch
Universidade Federal do Rio Grande do Sul, Escola de Administração, Departamento de Ciências Administrativas, Porto Alegre, RS, Brazil.
Received on 08.28.2014 – Desk acceptance on 10.18.2014 – 4th version approved on 06.16.2015.
ABSTRACT
Financial literacy helps individuals make more assertive and efficient decisions in the monetary context of their lives. This study has as its central axis developing a model that explains the individuals’ financial literacy level through socioeconomic and demographic variables. The sample consists of 1,400 individuals living in Rio Grande do Sul, Brazil, and data analysis was performed by using descriptive statistics and multivariate analysis techniques. As an indicator of the financial literacy level, a measure with three constructs was adopted: financial attitude, financial behavior, and financial knowledge. Logit and probit models were estimated from these explanatory variables: gender, marital status, dependent family members, occupation, age, educational level, father’s educational level, mother’s educational level, indivi-dual income, and family income. Marginal effects (incremental propensity) were positive and statistically significant at the usual levels for these variables: gender (9.56%), educational level (2.54%), individual income (6.32%), and family income (3.73%). The marginal effects (incremental propensities) were negative and statistically significant for the dummy dependent family members (-7.51%), indicating that men who do not have dependent family members and have higher educational and both individual income and family income levels are those who are more likely to belong to the group with high financial literacy levels. Furthermore, it was found that most respondents (67.1%) were classified as having a low financial literacy level. These findings confirm the urgency and need for devising effective actions to minimize the issue of financial illiteracy. It is particularly suggested that major efforts are undertaken to achieve women having depen-dent family members and low educational and income levels. Such a study is justified by the need to create a model that allows idepen-dentifying the Brazilians’ financial literacy level from socioeconomic and demographic variables. This identification may be useful, for instance, in assisting the various economic player to design financial strategies and products suitable to the customers profile. From the government viewpoint, it may enable, for instance, identifying the most vulnerable groups and thus focus on actions to improve the financial literacy level of these specific groups.
Keywords: financial literacy, forecasting models, socioeconomic variables, demographic variables.
1 INTRODUCTION
are only research that found some diferences in relation to socioeconomic and demographic variables (Flores, Vieira, & Coronel, 2013; Potrich, Vieira, & Ceretta, 2013), with no proposition of models to simultaneously assess these varia-bles. his article seeks to advance this issue. Speciically, it intends to develop a model in the Brazilian context that iden-tiies the individuals’ inancial literacy through socioecono-mic and demographic variables.
his study provides innovations in at least two aspects. First, by using a multidimensional construct to analyze i-nancial literacy, proposed by Potrich, Vieira and Kirch (2014), which simultaneously covers the inancial attitude, inancial behavior, and inancial knowledge, as suggested by the OECD (2013). According to Fernandes, Lynch and Ne-temeyer (2014), there is a marked disconnection between conceptual deinitions of inancial literacy, thus it might be worth devising new, rather connected measures. It is belie-ved that the measure proposed by Potrich et al. (2014) meets this need and it is, therefore, the most suitable option for our purposes.
Second, by estimating a model that seeks to explain i-nancial literacy level through socioeconomic and demogra-phic variables. According to Fernandes et al. (2014), people with certain psychometric proiles are more likely to engage in activities that increase their inancial literacy levels.
he estimation of a model having this nature is of pa-ramount importance, as governments around the world are interested in inding efective approaches to increase the i-nancial literacy level among the population, by creating or improving its national strategies, aiming to ofer learning opportunities at the various educational levels (Atkinson & Messy, 2012). It is also important that players in the inancial system determine the inancial literacy of their clients/inves-tors, so that they are able to devise various strategies and pro-ducts. It is believed that these innovations and contributions fully justify this study.
he rest of this study is structured as follows: irst, the key concepts and the relationship between socioeconomic and demographic variables and inancial literacy are introduced. hen, the most relevant aspects of the methodological pro-cedures are introduced and, inally, there are the analysis and discussion of results, as well as the inal remarks of the study conducted.
Financial literacy has been recognized as a key skill for individuals who are embedded in an increasingly complex inancial scenario. Despite its signiicance, many studies around the world indicate that much of the world’s popula-tion still sufers from inancial illiteracy and that measures to remedy the problem are urgently needed (Lusardi & Mi-tchell, 2011; Atkinson & Messy, 2012; Brown & Graf, 2013; haler, 2013; World Bank, 2014). For adopting efective i-nancial literacy strategies, it is a must there is initially a mo-del that allows determining the individuals’ inancial literacy level and which are the priority focuses of action.
he Organisation for Economic Co-Operation and De-velopment (OECD, 2013) conceptualizes inancial literacy as a combination of awareness, knowledge, skill, attitude, and behavior required to make inancial decisions and ultima-tely achieve individual inancial well-being. In the view of Criddle (2006), being inancially literate includes learning about the choice of many alternatives for establishing inan-cial goals.
A signiicant aspect related to the issue of inancial lite-racy is the identiication of its relationship with socioecono-mic and demographic variables. Several studies have sought to identify these relationships. Results shown by Lusardi and Mitchell (2011), Atkinson and Messy (2012), the OECD (2013), and Brown and Graf (2013) point out that women have lower inancial literacy levels than men. Chen and Vol-pe (1998) found out that college students had an inadequa-te knowledge level, especially in relation to investments. In turn, haler (2013) suggests that inancial literacy is highly correlated with other factors and, among them, Higher Edu-cation might be the key. Atkinson and Messy (2012) obser-ved that inancial literacy tends to be higher among adults in the middle of their life cycle, and it is usually lower among young and elderly individuals. Results reported by Resear-ch (2003) suggest that singles are signiicantly more likely to have poorer inancial literacy than married individuals. Monticone (2010) and Atkinson and Messy (2012) found that low income levels are associated with low inancial lite-racy levels. And, at last, Chen and Volpe (1998) and Research (2003) observed that individuals with longer labor experien-ce are more inancially literate.
In turn, in the Brazilian context, studies that seek to as-sess the individuals’ literacy are still very incipient, there
2 THEORETICAL FRAMEWORK
2.1 Financial Literacy
Financial literacy has been recognized worldwide as a significant element of stability and economic and fi-nancial growth, which is reflected in the recent approval of the High-Level Principles on National Strategies for
knowledge, since these two constructs are conceptually different and using them as synonyms may lead to pro-blems, because financial literacy goes beyond financial education. Huston (2010) argues that financial literacy has two dimensions: understanding, which represents personal financial knowledge or financial education, and its use, i.e. the application of such knowledge in per-sonal financial management.
Lusardi and Mitchell (2011) state that, although it is worth assessing how people are financially literate, in practice, it is hard to explore the way how people process financial information and make decisions based on this knowledge. This is so because financial literacy covers a number of concepts, including financial awareness and knowledge, financial skills, and financial capability, and it is hard to capture all this information in a reasonable length of time to research.
Although research in the financial literacy field has increased over the years, there is little consistency in the way how it is defined, as several authors address the topic differently, assigning different connotations to it (Hung, Parker, & Yoong, 2009). Also, studies have highlighted the ambiguous use of financial literacy, especially in grasping the differences between these constructs, i.e. financial knowledge or financial education. In this way, Robb, Babiarz and Woodyard (2012) make a distinction between the terms, claiming that financial literacy in-volves the ability to understand financial information and make effective decisions by using such information, while financial education means simply recalling a set of facts, i.e. financial knowledge. In short, the main fo-cus of financial education is knowledge, while financial literacy involves, in addition to knowledge, the indivi-duals’ behavior and financial attitude. Thus, as stated by
Mccormeck (2009) and Huston (2010), financial literacy goes beyond the primary idea of financial education.
A definition that properly covers this idea is propo-sed by the OECD, where financial literacy is regarded as a combination of awareness, knowledge, skill, attitude, and behavior needed to make sound financial decisions and ultimately achieve individual financial well-being (OECD, 2013). Thus, the OECD addresses financial li-teracy in three dimensions: financial knowledge, finan-cial behavior, and finanfinan-cial attitude. This paper adopts such a definition, where financial literacy is defined as a combination of financial behavior, financial knowledge, and financial attitude. This choice is justified because this concept is widely used in the literature, and it en-compasses the largest number of dimensions (Atkinson & Messy, 2012).
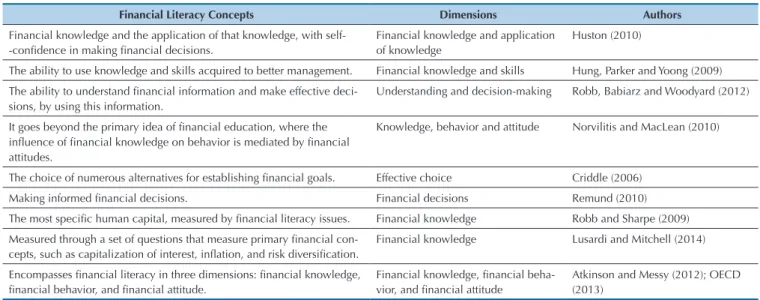
The dimension financial knowledge is a particular kind of human capital that is acquired throughout the life cycle, by learning subjects that affect the ability to effectively manage revenues, expenses, and savings (De-lavande, Rohwedder, & Willis, 2008). Financial behavior is a key element of financial literacy, and it is undou-btedly the most important (OECD, 2013). According to Atkinson and Messy (2012), the positive results of being financially literate are driven by behavior such as planning expenses and building financial security, on the other hand, certain behaviors, such as excessive use of credit, may reduce financial well-being. In turn, fi-nancial attitudes are established through economic and non-economic beliefs held by a decision maker on the outcome of a certain behavior and they are, therefore, a key factor in the personal decision-making process (Ajzen, 1991). Table 1 provides a synthesis of the key concepts and dimensions involving financial literacy.
Table 1 Key concepts and dimensions involving financial literacy
Financial Literacy Concepts Dimensions Authors
Financial knowledge and the application of that knowledge, with self--conidence in making inancial decisions.
Financial knowledge and application of knowledge
Huston (2010)
The ability to use knowledge and skills acquired to better management. Financial knowledge and skills Hung, Parker and Yoong (2009)
The ability to understand inancial information and make effective deci
-sions, by using this information.
Understanding and decision-making Robb, Babiarz and Woodyard (2012)
It goes beyond the primary idea of inancial education, where the inluence of inancial knowledge on behavior is mediated by inancial attitudes.
Knowledge, behavior and attitude Norvilitis and MacLean (2010)
The choice of numerous alternatives for establishing inancial goals. Effective choice Criddle (2006)
Making informed inancial decisions. Financial decisions Remund (2010)
The most speciic human capital, measured by inancial literacy issues. Financial knowledge Robb and Sharpe (2009)
Measured through a set of questions that measure primary inancial con
-cepts, such as capitalization of interest, inlation, and risk diversiication.
Financial knowledge Lusardi and Mitchell (2014)
Encompasses inancial literacy in three dimensions: inancial knowledge, inancial behavior, and inancial attitude.
Financial knowledge, inancial beha
-vior, and inancial attitude
Atkinson and Messy (2012); OECD (2013)
In summary, it is noticed that several authors con-ceptualize financial literacy as a synonym for financial knowledge or financial education, because they mea-sure it only through these constructs. Thus, most
it broadly, measuring it through other aspects, such as financial behavior, financial attitude, financial expe-riences, among others. So, it is noticed that the lack of a standardized set of consistent financial literacy me-asures did not prevent the emergence of a significant number of studies.
2.2 Relationship between Socioeconomic and
Demographic Variables and Financial
Literacy
In a survey conducted with undergraduate students, Shim, Barber, Card, Xiao and Serido (2010) found that, while some students were seeking to learn how to better manage their finances, others engaged in risky behaviors. According to the authors, a better un-derstanding of the reason for the occurrence of such behavior disparity may be obtained by analyzing the students’ socioeconomic and demographic profile, ha-ving in mind its influence on financial literacy. In this context, other studies have shown associations and in-fluences of socioeconomic and demographic variables with/on the individuals’ financial literacy levels. The main variables under analysis are gender, age, marital status, occupation, number of dependent family mem-bers, the educational level of an individual and her/his parents, and income.
Regarding gender, Lusardi and Mitchell (2011) found that women are significantly less likely to answer the questions correctly and more prone to say they do not know the answer. This fact is remarkably similar in financially different countries (Lusardi & Wallace, 2013). On the other hand, women also assess their own financial literacy level more conservatively. According to Lusardi and Mitchell (2011), this finding is the same both for developed countries and the developing coun-tries. Studies conducted by Chen and Volpe (1998) ex-tend the evidence that women have greater difficulty in performing financial calculations and lower knowledge level, which ultimately hinder the ability of making res-ponsible financial decisions.
The differences found in gender may be a result of the socialization of individuals. A study by Edwards, Allen and Hayhoe (2007) concluded that parents main-tain different expectations for sons and daughters, as they have higher expectations concerning work and sa-vings for their sons, thus they are more likely to talk about money with their sons. In contrast, the authors observed that parents educate daughters to be finan-cially dependent, since they receive more financial su-pport from their parents than sons at a university age. So, it seems that the significant difference between men and women is explained by the fact that men tend to see money as power and they believe that having mo-ney will make them more socially desirable, while wo-men seem to have a rather passive approach to money (Calamato, 2010).
Regarding age, major research suggests that finan-cial literacy tends to be higher among adults in the
mi-ddle of their life cycle and, it is usually lower among young and elderly individuals (Research, 2003; Aga-rwal, Driscoll, Gabaix, & Laibson, 2009). Lusardi and Mitchell (2011) showed that respondents aged between 25 and 65 tend to hit 5% more questions than those un-der 25 or over 65 years. In addition, Scheresberg (2013) found that young adults (25-34 years) have used loans with high costs.
Marital status is also correlated with the financial literacy level. According to Research (2003) and Brown and Graf (2013), singles have a significant propensity to lower financial literacy levels, when compared to mar-ried individuals. In general, when people have a low financial literacy level, they run the risk of making bad financial decisions that, in the long term, may result in debts and the latter endanger the well-being of their re-lationships (Calamato, 2010). Ratifying such evidence, Dew (2008) found that consumer debt is a major threat to marital satisfaction and, therefore, married indivi-duals have higher financial literacy levels.
Regarding the number of dependent family mem-bers, the same argument above might be used: aiming at family well-being, individuals with dependent fami-ly members might have greater concern with the bud-get, thus higher financial literacy level. The empirical results, however, do not corroborate this expectation. Servon and Kaestner (2008) found that those having a child are less likely to show low financial literacy le-vels than those with two or three children. In addition, Mottola (2013) found that families with dependent in-dividuals were more prone to show low financial lite-racy levels. A potential explanation for these results lies on the reverse causality: individuals with high (low) fi-nancial literacy level are more (less) concerned about family planning.
By analyzing occupation, Chen and Volpe (1998) found that individuals with longer labor experience undergo a larger number of financial situations, the-refore they acquire more knowledge, thus facilitating the analysis of more complex information and provi-ding a basis for decision-making. On the other hand, according to Research (2003), unskilled or unemployed workers tend to show lower performance due to less contact with financial issues. In addition, financial illiteracy is associated with low job performance and workers’ productivity (Kim & Garman, 2004). Working arrangements may also influence financial attitudes and behaviors, considering that individuals with stea-dy income have better conditions to organize and plan their financial life (Calamato, 2010).
knowledge level. Corroborating such evidence, Lusar-di and Mitchell (2011) found that inLusar-dividuals with low educational level are less likely to answer the questions correctly and also more likely to say they do not know the answer. However, Chen and Volpe (1998), when as-sessing students’ knowledge on personal inance, found that students, regardless of their educational degree, had an inadequate knowledge level, particularly with regard to investments.
In the same context, the literature suggests that pa-rents play a major role by inluencing their children’s con-sumer behavior. Studies have conirmed that most indi-viduals learn more about money management with their parents (Pinto, Parente, & Mansield, 2005; Clarke, Hea-ton, Israelsen, & Eggett, 2005). In turn, Jorgensen (2007) found that parents signiicantly inluence their children’s knowledge, attitudes, and inancial behavior and Mandell (2008) found that the inancial literacy of individuals is uniformly related to their parents’ education levels. For these reasons, parental education would might play a
sig-niicant role in their children’s literacy.
Regarding income, Atkinson and Messy (2012) found that low income levels are associated with lower inancial literacy levels. Monticone (2010) found that wealth has a little, but positive, efect on inancial literacy. In turn, Has-tings and Mitchell (2011) provide experimental evidence to show that inancial literacy is related to wealth. In a study on inancial literacy, students from high-income fa-milies had signiicantly higher knowledge levels than stu-dents from low-income families (Johnson & Sherraden, 2007). In addition, low-income individuals are more like-ly to drop out of school, something that, in the long run, contributes to their inancial illiteracy (Calamato, 2010). here is also in this case the possibility of reverse causa-tion: individuals with high inancial literacy levels, when making better inancial decisions, achieve higher income level than individuals with low inancial literacy levels. Table 2 shows a synthesis of the relationships between i-nancial literacy and socioeconomic and demographic va-riables mentioned above.
3 METHODOLOGICAL PROCEDURES
Table 2 Synthesis of the relationship between socioeconomic and demographic variables and financial literacy
Variables Relation with inancial literacy Authors
Gender
- Women generally have lower inancial literacy levels than men; - Women are less likely to answer the questions correctly and more
likely to say they do not know the answer;
- Men’s inancial literacy is increasingly faster than that of women; - Making a comparison between women, those married and having
higher incomes show higher inancial literacy levels.
Chen and Volpe (1998); Agarwal et al. (2009); Lusardi and Mitchell (2011); Atkinson and Messy (2012);
OECD (2013).
Age
- The average age from 30 to 40 years is associated with higher inancial literacy levels.
- Financial literacy is low among young and elderly individuals. - Young adults have used loans with high costs.
Agarwal et al. (2009); Lusardi and Mitchell (2011); Atkinson and Messy (2012);
OECD (2013); Scheresberg (2013).
Marital status - Singles are signiicantly more prone to have lower inancial literacy levels than married individuals.
Research (2003); Dew (2008); Calamato (2010); Brown and Graf (2013).
Having dependent family members
- Individuals who have a child are less likely to have low inancial literacy levels than those who have two or three children; - Families with dependent members are more likely to contract loans
with higher costs.
Servon and Kaestner (2008); Mottola (2013).
Occupation
- Individuals with longer labor experience have higher inancial literacy because of greater familiarity with economic and inancial subjects, while unskilled or unemployed workers show less desirable
attitudes and behaviors.
Chen and Volpe (1998); Research (2003); Kim and Garman (2004);
Calamato (2010).
Educational level
- Those with higher educational levels are those with higher inancial literacy levels;
- The number of courses related to the inancial ield attended at a undergraduate education is related to the inancial literacy level; - Those with lower education are less likely to answer the questions
correctly and more prone to say they do not know the answer.
Chen and Volpe (1998); Amadeu (2009); Lusardi and Mitchell (2011).
Parental educational level
- Parents inluence their children’s literacy; - Individuals’ inancial literacy is uniformly related to parental
educational levels;
- Parents play a major role by inluencing their children’s consumer behavior;
- Individuals learn more about money management with their parents.
Liao and Cai (1995);
Pinto et al. (2005);
Clarke et al. (2005); Jorgensen (2007);
Mandell (2008).
Income - Low income levels are associated with low inancial literacy levels. Hastings and Mitchell (2011);Monticone (2010);
Atkinson and Messy (2012).
3.1 Research Hypotheses
Based on the theoretical framework and
◆ H1: Men have higher propensity to join the group with higher financial literacy levels vis-à-vis women.
◆ H2: Young and elderly individuals are less likely to join the group with the highest financial literacy le-vel than middle-aged individuals.
◆ H3: Married individuals are more likely to join the group with higher financial literacy levels when compared to single individuals.
◆ H4: Individuals with dependent family members are less likely to join the group with the highest finan-cial literacy level vis-à-vis individuals with no depen-dent family members.
◆ H5: Individuals with occupation have higher pro-pensity to join the group with higher financial literacy levels than unemployed individuals.
◆ H6: The higher an individual’s education level, the more likely she/he is to join the group with higher financial literacy levels.
◆ H7: The higher the parental educational level, the more likely an individual is to join the group with hi-gher financial literacy levels.
◆ H8: The higher the income level (individual and family), the more likely the individual is to join the group with higher financial literacy levels.
3.2 Sample and Research Instrument
The research was conducted in the state of Rio Grande do Sul, Brazil, and it covered each of the seven mesoregions in this state, in order to determine the financial literacy level of the state‘s population, as well as to devise an indicator for its assessment. Thus, the target population consisted of inhabitants older than 18 years from the state of Rio Grande do Sul. Thus, considering the amplitude of this population, which totals 7,932,758 individuals, according to the Brazilian Institute of Geography and Statistics (IBGE, 2010), and adopting a sampling process with 95% confiden-ce level and 3.0% sampling error, a sample with 1,067 individuals was obtained, distributed according to the stratum of respondents to be achieved in each meso-region in Rio Grande do Sul. At the end of the col-lection period, a final sample of 1,400 individuals was obtained. To carry out data collection, 10 researchers were trained to apply the instrument in November and December 2013.
It is also noteworthy that the questionnaires were applied face to face to respondents, through home visits and meetings at public places. Along with the questionnaire, a free and informed consent term was handled to respondents, and only the study subjects who, after reading the term, agreed to participate in the survey.
To measure the financial literacy l evel, a multidi-mensional measure proposed by Potrich et al. (2014) was used, which includes the three constructs sugges-ted by the OECD (2013): financial attitude, financial behavior, and financial knowledge. To measure finan-cial attitude, an instrument prepared having the scales
proposed by Shockey (2002) and the OECD (2013) as a basis was used. The financial attitude scale, consisting of ten Likert-like questions, with five points, aims to identify how the individual assesses her/his financial management. The more a respondent partially or fully disagrees with the claims made, the better her/his fi-nancial attitude.
To measure the behavior adopted by respondents, measures proposed by Shockey (2002), O‘Neill and Xiao (2012), and the OECD (2013) were used. The scale, consists of 27 Likert-like questions, with five points, assesses the individuals’ financial behavior le-vel. The higher the frequency of a respondent with re-gard to her/his statements, the better her/his behavior in managing finances.
Finally, as for the questions related to financial knowledge, a financial literacy index was constructed, based on multiple choice questions adapted from Van Rooij, Lusardi and Alessie (2011), the OECD (2013), Klapper, Lusardi and Panos (2013), and on the Natio-nal Financial Capability Study (NFCS, 2013). The fac-tor, consisting of thirteen questions, aims to explore the respondent‘s knowledge level concerning issues such as inflation, interest rates, value of money over time, risk, return, diversification, stock market, cre-dit, and government securities. For each of the thirte-en financial literacy questions a value equal to 1 was assigned for the correct answer and a value equal to 0 for the incorrect answer. Thus, the financial know-ledge index ranged from 0 (where the individual fai-led in all questions) to 13 (where the individual hit all questions). According to Chen and Volpe (1998), res-pondents were then classified as low financial literacy level holders (score lower than 8), medium financial knowledge level (score between 8 and 10), and high financial knowledge level (score higher than 10).
By means of this instrument (see the Appendix) and using confirmatory factor analysis and cluster analysis, Potrich et al. (2014) developed a methodolo-gy for calculating the financial literacy level and they proposed two clusters of individuals, those with high financial literacy levels and those with a low level of it.
Following the indicator proposed, the measure used in this study is a binary variable whose value is zero (0) for individuals classified as having low finan-cial literacy level and one (1) for individuals with high financial literacy levels.
father’s education (ordinal scale: equal to that of the educational level), mother’s education (ordinal scale: equal to that of the educational level), individual in-come (ordinal scale: I do not have inin-come (1), up to R$ 700.00 (2), between R$ 700.01 and R$ 1,400,00 (3), between R$ 1,400.01 and R$ 2,100.00 (4), between R$ 2,100.01 and R$ 3,500.00 (5), between R$ 3,500.01 and R$ 7,000.00 (6), between R$ 7,000.01 and R$ 14,000.00 (7), and more than R$ 14,000.00 (8)), and family in-come (ordinal scale: up to R$ 700.00 (1), between R$
700.01 and R$ 1,400.00 (2), between R$ 1,400.01 and R$ 2,100.00 (3), between R$ 2,100.01 and R$ 3,500.00 (4), between R$ 3,500.01 and R$ 7,000.00 (5), between R$ 7,000.01 and R$ 14,000.00 (6), and more than R$ 14,000.00 (7)).
3.3 Econometric Model
To analyze the relationship between inancial literacy and socioeconomic and demographic variables, this non-linear model was estimated:
where y is the dependent variable (inancial literacy
le-vel), x are the explanatory variables (socioeconomic and
demographic), α and β1,..., β11 are the estimated
parame-ters, and G (·) is a cumulative distribution function (CDF), whose speciic form depends on the estimator used.
For the purposes of estimation, the logistic model - logit was chosen (assuming that the residue has CDF logistics) and, for the purposes of comparison and robustness, the probit model was used (assuming that the residue has nor-mal CDF). According to Gujarati (2006, p. 480), “both for historical and practical issues, the CDF usually chosen (...) are (1) the logistic and (2) the normal.” Also according to Gujarati (2006, p. 495), “in most applications, the models are very similar, and the main diference is that the logis-tic distribution has slightly fatter tails (...). herefore, there are no compelling reasons to prefer one model to another.” Although the models are similar, the estimated coeicients
are not directly comparable (Gujarati, 2006) and, for this reason (and for the purposes of analyzing the economic efect of each variable), the estimated marginal efects will also be shown for each variable, and they are directly com-parable.
As we may see, all variables get into the model with a linear term, except age, which besides the linear term has a quadratic term. he inclusion of the quadratic term is due to the expectation that the relationship between inancial literacy and age is nonlinear and shaped like a parable, i.e. middle aged individuals have higher propensity to join the group with higher inancial literacy levels, when compa-red to young and elderly individuals. herefore, a positive coeicient is expected for the linear term of the variable age and a negative coeicient for its quadratic term. For all other variables, except having dependent family members, positive marginal efects are expected.
1 Only the appropriate descriptive statistics are shown for each variable scale.
4 ANALYSIS OF RESULTS
This section is divided into three parts: first, the re-sults of univariate and bivariate analyses are shown and discussed; then, the results of estimating the nonlinear model proposed are shown and discussed; and, finally, with less depth, the robustness tests used to check whe-ther the results are sensitive to alternative model specifi-cations are shown and discussed.
4.1 Univariate and Bivariate Analyses
Table 3 displays the descriptive statistics1 of the
va-riables used in this study for a sample of 1,400 indivi-duals from the state of Rio Grande do Sul, aged over 18
Table 3 Continuation
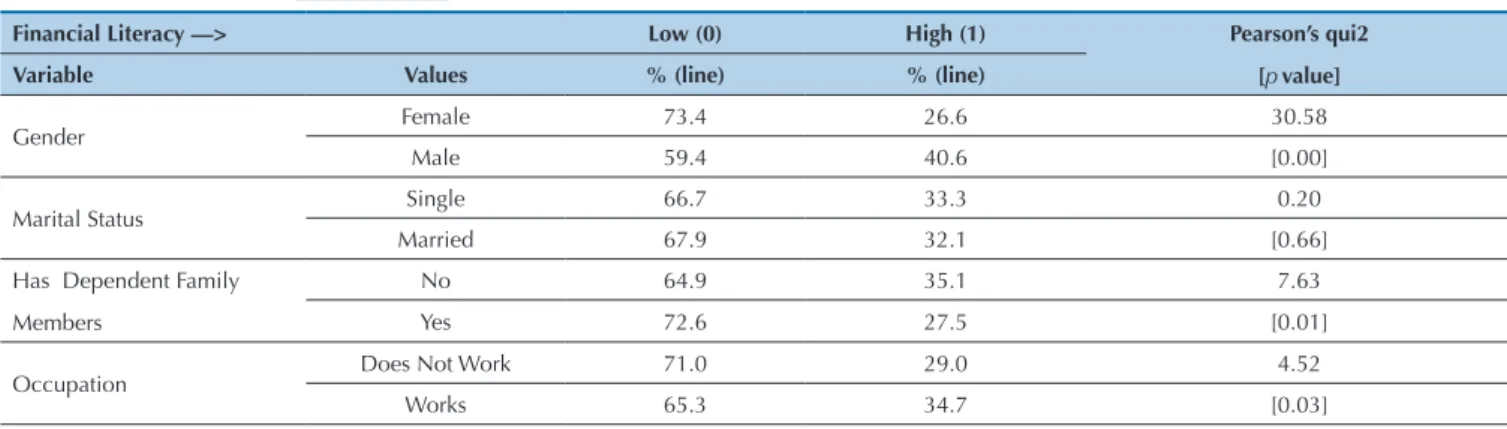
Table 5 Contingency tables – financial literacy x explanatory variables
Financial Literacy —> Low (0) High (1) Pearson’s qui2
[pvalue]
Variable Values % (line) % (line)
Gender Female 73.4 26.6 30.58
Male 59.4 40.6 [0.00]
Marital Status Single 66.7 33.3 0.20
Married 67.9 32.1 [0.66]
Has Dependent Family
Members
No 64.9 35.1 7.63
Yes 72.6 27.5 [0.01]
Occupation Does Not Work 71.0 29.0 4.52
Works 65.3 34.7 [0.03]
Spearman’s correlation matrix for ranking variables with an ordinal or ratio scale is displayed in Table 4. All correlations are statistically different from zero at a 10% significance level (except between age and educational level) and they are usually low, indicating that multi-collinearity problems are of lesser order. The highest correlations occur between father and mother’s educa-tional levels (r(1388) = 0.63; p < 0.01), indicating that
respondents’ parents tend to have similar educational levels, and between age and individual income (r(1388) = 0.51; p < 0.01), suggesting that older individuals tend to have higher income. It is also worth highlighting the positive correlations between educational level and indi-vidual income and between father/mother’s educational level and family income, indicating that higher educa-tional levels are associated with higher income levels.
Table 4 Correlation matrix of study variables
Age Educational Level Father’s Educatio-nal Level
Mother’s Educational Level
Individual Income
Educational Level 0.03
Father’s Educational Level -0.32 0.08
Mother’s Educational Level -0.36 0.13 0.63
Individual Income 0.51 0.28 -0.10 -0.12
Family Income -0.08 0.28 0.35 0.35 0.32
Variable Freq. /
Median
Stand. dev. Min. 1st Pctile 25th Pctile 50th Pctile 75th
Pctile
99th Pctile Max. Interval
Interq.
Financial Literacy 0.33
Gender (Male) 0.45
Marital Status (Married) 0.35
Has Dependent Family
Members (Yes) 0.29
Occupation (Works) 0.68
Age 29.78 11.83 18 18 21 25 35 66 80 14
Educational Level 1 1 2 4 4 6 6 2
Father’s Educational Level 1 1 1 2 2 6 6 1
Mother’s Educational Level 1 1 1 2 3 6 6 2
Individual Income 1 1 2 3 4 7 8 2
Family Income 1 1 3 4 5 7 7 2
For a preliminary analysis of the association between socioeconomic and demographic variables and inancial literacy, Table 5 displays the frequency distribution (con-tingency tables) of the variable inancial literacy for each value of the explanatory variables with a nominal or ordi-nal scale. Moreover, in the last column of this table, there
is the Pearson’s chi-square association measure – χ2(1, N
From the association measure presented, it can be seen that there is a statistically signiicant dependence at the 10% level between inancial literacy and these variables: gender, having dependent family members, occupation, educational level, mother’s educational level, individual income, and family income. Among men, there is a gre-ater proportion of individuals with high inancial literacy level (40.6%) than among women (26.6%), corroborating a priori expectations and previous studies. Among
indivi-duals having dependent family members is lower propor-tion with high inancial literacy level (27.5%) than among individuals without dependent family members (35.1%), a result in line with previous studies. Among the individuals who work, there is higher proportion with high inancial literacy level (34.7%) than among individuals who do not work (29%), a result consistent with a priori expectations and previous studies. As expected, the proportion of indi-viduals with high inancial literacy levels increases along Educational Level
Elementary School 88.4 11.6
High School 70.6 29.4
Technical Education 69.7 30.3 43.28
Higher Education 65.1 34.9 [0.00]
Specialization Course
or MBA 54.6 45.5
Masters’/Ph.D./Post--Ph.D. Education 40.9 59.1
Father’s Educational Level
Elementary School 69.0 31.0
High School 69.4 30.6
Technical Education 61.3 38.7 8.28
Higher Education 62.1 37.9 [0.14]
Father’s Educational Level
Specialization Course
or MBA 58.1 41.9
Masters’/Ph.D./Post--Ph.D. Education 55.6 44.4
Mother’s Educational Level
Elementary School 70.2 29.8
High School 69.4 30.6
Technical Education 64.5 35.5 16.05
Higher Education 61.9 38.1 [0.01]
Specialization Course
or MBA 50.0 50.0
Masters’/Ph.D./Post--Ph.D. Education 61.1 38.9
Individual Income
I do not have individual
income 77.6 22.4
Up to R$ 700.00 76.2 23.8
Between R$ 700.01 and
R$ 1,400.00 72.4 27.6
Between R$ 1,400.01
and R$ 2,100.00 62.3 37.7 69.04
Between R$ 2,000.01
and R$ 3,000.00 57.1 42.9 [0.00]
Between R$ 3,000.01
and R$ 7,000.00 48.4 51.6
Between R$ 7,000.01
and R$ 14,000.00 36.4 63.6
More than R$
14,000.00 40.0 60.0
Family Income
Up to R$ 700.00 88.4 11.6
Between R$ 700.01 and
R$ 1,400.00 82.0 18.0
Between R$ 1,400.01
and R$ 2,100.00 76.4 23.6 67.66
Between R$ 2,000.01
and R$ 3,000.00 70.1 29.9 [0.00]
Between R$ 3,000.01
and R$ 7,000.00 61.3 38.7
Between R$ 7,000.01
and R$ 14,000.00 50.8 49.2
More than R$
14,000.00 53.0 47.0
Total 67.1 32.9
Table 6 Results of estimating the nonlinear model
Explanatory Variables
Expected Sign
Logit Probit
Coeficients Marginal Effects Coeficients Marginal Effects
Constant -2.637*** -1.628***
[-4.37] [-4.50]
Gender + 0.441*** 0.0956*** 0.266*** 0.0953***
[3.56] [3.50] [3.57] [3.53]
Marital Status + -0.0166 -0.00354 -0.00929 -0.00328
[-0.10] [-0.10] [-0.09] [-0.09]
Having Dependent Family
Members
- -0.360** -0.0751** -0.214** -0.0744**
[-1.99] [-2.08] [-1.99] [-2.06]
Occupation + -0.0495 -0.0106 -0.0401 -0.0142
[-0.30] [-0.30] [-0.41] [-0.41]
Age + -0.00527 -0.00287 -0.000656 -0.00249
[-0.15] [-0.88] [-0.03] [-0.77]
Age^2 - -0.000163 -0.000128
[-0.38] [-0.50]
Educational Level + 0.119** 0.0254** 0.0713** 0.0252**
[2.28] [2.20] [2.27] [2.21]
Father’s Educational Level + -0.0589 -0.0126 -0.0351 -0.0124
[-1.00] [-1.00] [-0.99] [-0.99]
Mother’s Educational Level + 0.0554 0.0118 0.0315 0.0111
[1.01] [1.01] [0.95] [0.95]
Individual Income + 0.296*** 0.0632*** 0.177*** 0.0625***
[5.15] [5.28] [5.17] [5.27]
Family Income + 0.174*** 0.0373*** 0.105*** 0.0373***
[3.16] [3.19] [3.23] [3.25]
with educational levels (monotonously), mother’s educa-tional level (except at the utmost level), individual income (except at the utmost level), and family income (except at the utmost level). Finally, it is worth noticing the relatively marked increase in the proportion of individuals with high inancial literacy levels, when switching from Elementa-ry School to High School (17.8% increase), from Higher Education to specialization or MBA (10.6% variation), and from this level to the Masters’/Ph.D./Post-Ph.D. Education (13.6% variation), indicating a strong relationship between education and inancial literacy.
4.2 Main Results
Table 6 shows the results of the nonlinear model esti-mation, deined in the previous section, by means of logit and probit estimators. In addition to the coeicients for each model variable, there are, in the immediately right column, the marginal efects calculated on the median of ordinal scale variables and ratio and observed frequency of the variables in nominal scale. As the results of the two es-timators are qualitatively equal and very similar marginal efects, only the results of the logit model will be discussed.
Conirming the results of the bivariate analysis and the hypothesis H1, the variable gender has a positive co-eicient (0.441), which is statistically signiicant at 1% on
The variable has a negative coefficient, statistically significant at 5% in the estimated regressions, thus it does not reject the hypothesis H4 of this research. Indi-viduals with dependent family members have a 7.51% lower probability of belonging to the group with high i-nancial literacy levels than individuals without dependents, a marginal efect close to that obtained in the bivariate analysis. A result consistent with the indings of Scheres-berg (2013), who observed that individuals who have de-pendent family members, either one or two, are less likely to answer the questions correctly, ranging from 4 to 7 per-centage points lower propensity when compared to those without dependent family members. Moreover, although in line with the results reported by Servon and Kaestner (2008) and Mottola (2013), this result is not consistent with the hypothesis that individuals with dependent fami-ly members, who aim at the famifami-ly well-being, might have greater concern about the budget and thus higher inancial literacy level.
As expected and corroborating the results of Lusardi and Mitchell (2011), the variable education had a positive coeicient (0.119) and statistically signiicant at 5%, thus it does not reject the hypothesis H6 of this research. Such result, in qualitative terms, is similar to that found by Sche-resberg (2013), who, using a multiple linear regression, identiied positive and low coeicients for lower educatio-nal levels (High School: 0.067) and positive and high coe-icients for higher educational levels (graduate education: 0.388), suggesting that inancial literacy rises sharply along with the educational level. In quantitative terms, an
addi-tional increase2 in the educational level elevates the
proba-bility of belonging to the group with the highest inancial literacy level in 2.54%, a shy marginal efect when compa-red to other variables, such as individual income (see dis-cussion below). his result is also consistent with Amadeu (2009), who found that greater contact, during undergra-duate or specialized education, with inancial or economic subjects positively inluences the daily inancial practices, as students attending the courses of Economics, Adminis-tration, and Accounting had higher inancial literacy levels. By contrast, father’s and mother’s education, contrary to expectations, did not show statistically signiicant coe-icients at the usual levels, indicating that parental educa-tion has no signiicant impact on the individuals’ inancial
literacy. Such result leads to the rejection of the hypothesis H7 and it does not corroborate the literature, which sug-gests that parental education plays a signiicant role by in-luencing their children’s consumer behavior, as well as it impacts on their inancial literacy level (Pinto et al., 2005; Clarke et al., 2005; Jorgensen, 2007; Mandell, 2008).
he variables individual and family income showed positive and statistically signiicant coeicients at 1% in the estimated regressions, thus they do not reject the hy-pothesis H8. An additional level of individual income (fa-mily) s by 6.32% (3.73%) the probability of belonging to the group with the highest inancial literacy level. hese marginal efects suggest that income is one of the most im-portant factors to explain the individuals’ inancial literacy level. his result contrasts with the indings of Chen and Volpe (1998), who found, by using logistic regression, that the variable income was not signiicant for determining inancial literacy. However, our results are consistent with those reported by Johnson and Sherraden (2007), Montico-ne (2010), Hastings and Mitchell (2011), Lusardi and Mi-tchell (2011), Atkinson and Messy (2012), and Scheresberg (2013). Speciically, Lusardi and Mitchell (2011) found that an increase in the income level signiicantly and gradually elevates the inancial literacy level, the irst income level is not signiicant and the second, third, and fourth levels have multiple linear regression coeicients with 0.094, 0.289, and 0.365, respectively. In addition, experimental evidence found by Hastings and Mitchell (2011) show that inancial literacy is positively related with wealth. Finally, Johnson and Sherraden (2007) ascertained that students from high--income families had signiicantly higher knowledge levels than students from low-income families.
he other variables: marital status, occupation, age, and squared age showed no statistically signiicant coeicients, indicating that they do not play a signiicant role in the i-nancial literacy of the sampled individuals and leading to the rejection of research hypotheses H2, H3, and H5. hese results, therefore, do not support the hypotheses that: (i) married individuals, when aiming at the well-being of their relationships, show higher inancial literacy levels (Cala-mato, 2010); (ii) individuals with longer labor experience undergo a larger number of inancial situations (Chen & Volpe, 1998; Research, 2003), thus they have higher inan-cial literacy level and individuals with steady income have
2 Strictly, this is the marginal effect of an additional educational level for an individual with an average educational level. In the sample of this study, it is the marginal effect for an individual with Higher Education.
However, the marginal effects for other educational levels are very similar in terms of magnitude (results not reported, but available upon request) and, therefore, we do not distinguish them when analyzing the results. The same applies to the variables individual income and family income.
Notes: This table shows the estimation results of the nonlinear model shown in section 4 by means of logit estimators (columns 3 and 4) and probit estimators
(columns 5 and 6). Columns 3 and 5 show the estimated coeficients and the columns 4 and 6 show the marginal effects calculated on the median of the ordi
-nal scale variables, as well as the ratio and observed frequency of the nomi-nal scale variables. Robust standard errors. T-statistics in brackets. *** = p < 0.01, **
= p < 0.05 e * = p < 0.10.
Pseudo-R2 8.18% 8.18%
Log Verisimilitude - 813.90 - 813.90
Chi2 122.30 130.40
Chi2 (p value) 0.0000 0.0000
Observations 1.400 1.400
4.3 Robustness Tests
By analyzing the correlations for ranking (Spearman’s rho) between the explanatory variables (see Table 4), it was observed there is a strong correlation between the va-riables father and mother’s educational level (r(1388) = 0.63, p < 0.01). his fact may suggest that multicollineari-ty issues can have afected the results. To check this possi-bility, the nonlinear model was estimated again including only one out of the two variables. he results including the variable father’s educational level and excluding mother’s educational level and including mother’s educational level and excluding father’s educational level are similar to tho-se reported in Table 6 and, for the sake of brevity, are not reproduced herein, but they are available upon request.
Another concern is the inclusion of ordinal scale va-riables in the estimations. By using vava-riables with an
or-dinal scale on a linear model, e.g. it is assumed that each level (value) of the scale has the same efect on the depen-dent variable. To verify whether the results are afected by this choice, the model was estimated again by replacing the ordinal variables by a set of dummy variables (nomi-nal), one for each value in the ordinal scale (excluding a value of each variable captured by the intercept). he results, not reported for purposes of brevity, but available upon request, corroborate, in general terms, those pre-viously discussed. he most signiicant diference when compared to previous results, which is worth highlighting concerns the efect of family income on inancial literacy: only individuals with family income between R$ 5,000.01 and R$ 7,000.00 are more likely to belong to the group with the highest inancial literacy level, and the same does not occur for the other family income levels.
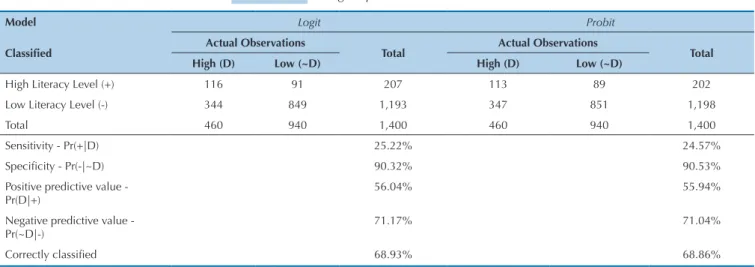
Table 7 Logit e probit classification tables
Model Logit Probit
Classiied Actual Observations Total Actual Observations Total
High (D) Low (~D) High (D) Low (~D)
High Literacy Level (+) 116 91 207 113 89 202
Low Literacy Level (-) 344 849 1,193 347 851 1,198
Total 460 940 1,400 460 940 1,400
Sensitivity - Pr(+|D) 25.22% 24.57%
Speciicity - Pr(-|~D) 90.32% 90.53%
Positive predictive value - Pr(D|+)
56.04% 55.94%
Negative predictive value - Pr(~D|-)
71.17% 71.04%
Correctly classiied 68.93% 68.86%
5 FINAL REMARKS
Learning on finance plays a major role in shaping responsible attitudes and behaviors with regard to the administration of personal finances, and financial
lite-racy is an essential component for a successful adult life. Thus, this article seeks to go further in this field, aiming to analyze, in the Brazilian context, the influence of so-better conditions to organize and plan their inancial life
(Calamato, 2010); and (iii) inancial literacy tends to be hi-gher among adults in the middle of their life cycle, and it is usually lower among young and elderly individuals (Rese-arch, 2003; Agarwal et al., 2009).
Among the signiicant variables, that having the hi-ghest marginal positive efect on inancial literacy is gen-der (9.56%). hen, there is the impact of income level, both individual (6.32%), and family income (3.73%), as well as education (2.54%). In turn, the fact of having dependent family members was the only one to have a negative margi-nal efect (-7.51%). In short, the socioeconomic and demo-graphic variables with greater impact on the individuals’ inancial literacy, respectively, gender, having dependent family members, individual income, family income, and
education.
cioeconomic and demographic variables on the indivi-duals’ financial literacy level, which innovates by estima-ting a model that seeks to explain financial literacy level from the these variables.
In a preliminary analysis, the fact that most respon-dents were classified as having low financial literacy le-vel was highlighted. Through bivariate association me-asures, it becomes possible to see there is a dependency relationship between financial literacy and the variables gender, having dependent family members, occupation, educational level, mother’s educational level, individu-al income, and family income. The estimation results of nonlinear models corroborated these findings, except for the variables mother’s educational level, which were not significant, indicating that parental educational le-vel and occupation have no significant impact on the individuals’ financial literacy. These results may be sum-marized as follows: women, who have dependent family members, and having lower educational level, as well as individual and family income levels are those who are more likely to belong to the group with low financial li-teracy levels.
The results found confirm a priori expectations and previous studies, by pointing out: women as having lo-wer financial literacy levels (Chen & Volpe, 1998; Lu-sardi & Mitchell, 2011; Brown & Graf, 2013; Mottola, 2013) and families with dependent members (Servon & Kaestner, 2008; Mottola, 2013), in addition to individu-als with lower educational levels (Amadeu, 2009; Lusar-di & Mitchell, 2011) and inLusar-dividual and family income (Hastings & Mitchell, 2011; Atkinson & Messy, 2012) as those individuals most likely to show low financial lite-racy levels.
Such conclusions confirm the urgent need for devi-sing effective actions to minimize the financial illiteracy issue. One of the potential measures to be taken refers to the inclusion of subjects regarding financial manage-ment and market finance notions in all undergraduate courses, regardless of the knowledge field. Another po-tential measure concerns the creation and adoption of educational programs, which should promote personal financial literacy in all sectors of society, but with ac-tions and specific contents that are distinguished accor-ding to each group’s profile.
Some actions in this direction have been mainly promoted by the Central Bank of Brazil (BACEN) and the Brazilian Federal Government, through the Brazi-lian National Strategy for Financial Education (ENEF). Nevertheless, we suggest rather specific methodologies in order to promote, for instance, university outreach projects aimed at conducting financial literacy courses, not focused just on teaching financial concepts, but pro-viding tips and feasible practices to improve financial attitudes and behaviors. The construction of a strategy aimed at the adoption of subjects and contents aimed at financial literacy also at the early educational levels might, in the long run, make children better prepared
for financial management and reduce inequalities before the individuals become adults and responsible for mana-ging resources of their own.
The results of this paper suggest that the group with the lowest financial literacy level is characterized as that consisting of women, with dependent family members, and lower educational and income levels. For financial players, finding this low financial literacy level profile can directly assist in the creation of products and servi-ces customized for this audience. Especially by having information about the customer profile, we may predict her/his financial literacy level and, as a consequence, de-vise various action strategies for groups with low and high financial literacy levels. In addition, being aware of the financial literacy profile of their customer portfolio, financial institutions can establish strategies to increase the literacy level among specific groups, since rather li-terate customers probably will require rather sophistica-ted financial products.
The World Bank Report published in 2014 corrobo-rates that the lack of financial knowledge may be a big barrier for financial access among the poor, pointing out financial education as the best policy choice to improve low-income individuals’ access to finance (World Bank, 2014). Initiatives to improve financial literacy among the low-income population might even contribute to the microfinance market, as informal entrepreneurs could have better ideas on financial issues within their busi-ness ventures and better understanding of the benefits and consequences of the credit obtained. Similarly, mi-crofinance institutions, through the application of the proposed model could identify the micro-entrepreneurs with higher financial literacy levels and, therefore, more prone to grasp the entire credit granting process.
From the academy’s viewpoint, the main focus so far has been separately identifying the role played by socioeconomic and demographic variables on financial literacy. This paper is a trailblazer by including several variables in a single model, allowing the identification of the marginal contribution of variables and establishing significance orders.
The contributions of this study are subject to some restrictions, such as the choice of variables and the me-thod. Other scales might be devised and tested as finan-cial literacy indicators. As it was based on a survey re-search design and cross-section data, the methodology sets limits for addressing the endogeneity issue.
Agarwal, S., Driscoll, J., Gabaix, X., & Laibson, D. (2009). The age of Agarwal, S., Driscoll, J., Gabaix, X., & Laibson, D. (2009). The age of reason: financial decisions over the lifecycle with implications for regulation. Brookings Papers on Economic Activity 2, 51-117. Ajzen, I. (1991). The theory of planned behavior. Organizational
Behavior and Human Decision Processes, 50(2), 179-211. Amadeu, J. R. (2009). A educação financeira e sua influência nas
decisões de consumo e investimento: proposta de inserção da disciplina na matriz curricular. Dissertação de mestrado, Universidade do Oeste Paulista, São Paulo, SP, Brasil. Atkinson, A., & Messy, F. (2012). Measuring financial literacy:
results of the OECD / International Network on Financial Education (INFE) Pilot Study [Working Paper n. 15]. OECD Publishing. Retrieved on April 5, 2013, from http://dx.doi. org/10.1787/5k9csfs90fr4-en.
Brown, M., & Graf, R. (2013). Financial literacy and retirement planning in Switzerland. Numeracy, 6(2), art. 6. Retrieved on April 10, 2013, from http://scholarcommons.usf.edu/numeracy/vol6/ iss2/art6.
Calamato, M. P. (2010). Learning financial literacy in the family.
Unpublished master’s thesis. The Faculty of the Department of Sociology, San José State University.
Chen, H., & Volpe, R. P. (1998). An analysis of personal financial literacy among college students. Financial Services Review, 7(2), 107-128. Retrieved on April 13, 2013, from http://www2.stetson. edu/fsr/abstracts/vol_7_num2_107.pdf.
Clarke, M. D., Heaton, M. B., Israelsen, C. L., & Eggett, D. L. (2005). The acquisition of family financial roles and responsibilities.
Family and Consumer Sciences Research Journal, 33(4), 321-340. Criddle, E. (2006). Financial literacy: goals and values, not just
numbers. Alliance, 34, 4.
Delavande, A., Rohwedder, S., & Willis, R. J. (2008). Preparation for retirement, financial literacy and cognitive resources. [Working Paper n. 2008-190]. Michigan Retirement Research Center. Retrieved on April 25, 2013, from http://www.mrrc.isr.umich.edu/ publications/papers/pdf/wp190.pdf.
Dew, J. (2008). Debt change and marital satisfaction change in recently married couples. Family Relations, 57(1), 60-71.
Edwards, R., Allen, M. W., & Hayhoe, C. R. (2007). Financial attitudes and family communication about students' finances: The role of sex differences. Communication Reports, 20(2), 90-100. Fernandes, D., Lynch, J. G., & Netemeyer, R. G. (2014). Financial
literacy, financial education, and downstream financial behaviors.
Management Science, 60(8), 1861-1883.
Flores, S. A. M., Vieira, K. M., & Coronel, D. A. (2013). Influência de fatores comportamentais na propensão ao endividamento. Faces:
Revista de Administração, 12(1), 13-35.
Gujarati, D. (2006). Econometria Básica (4 ed.). Rio de Janeiro: Elsevier. Hastings, J., & Mitchell, O. S. (2011). Financial literacy: implications
for retirement security and the financial marketplace. Oxford, UK: Oxford University Press.
Hung, A. A., Parker, A. M., & Yoong, J. (2009). Defining and measuring financial literacy [Working Paper n. 708]. Social Science Research Network, Santa Monica.
Huston, S. J. (2010). Measuring financial literacy. The Journal of Consumer Affairs, 44(2), 296-316.
Instituto Brasileiro de Geografia e Estatística (2010). Estados, censo demográfico 2010. Retrieved on 16 setembro, 2013, from http:// www.ibge.gov.br/estadosat/perfil.php?sigla=RS.
Johnson, E., & Sherraden, M.S. (2007). From financial literacy to financial capability among youth. Journal of Sociology and Social Welfare, 34(3), 119-146.
Jorgensen, B. L. (2007). Financial literacy of college students: parental and peer influences. Unpublished master’s thesis. Virginia Polytechnic Institute and State University, Blacksburg, Virginia. Kim, J., & Garman, E. T. (2004). Financial stress, pay satisfaction and
workplace performance. Compensation Benefits Review, 36(1), 69-76.
Klapper, L., Lusardi, A., & Panos, G. A. (2013). Financial literacy and its consequences: Evidence from Russia during the financial crisis.
Journal of Banking & Finance, 37(10), 3904-3923.
Liao, T. F., & Cai, Y. (1995). Socialization life situations and gender-role attitudes regarding the family among white American women.
Sociological Perspectives, 38(2), 241-260.
Lusardi, A., & Mitchell, O. S. (2011). Financial literacy and retirement
planning in the United States. Journal of Pension Economics and Finance, 10(4), 509-525.
Lusardi, A., & Mitchell, O. S. (2014). The economic importance of financial literacy: theory and evidence. Journal of Economic Literature, 52(1), 5-44.
Lusardi, A., & Wallace, D. (2013). Financial literacy and quantitative reasoning in the high school and college classroom. Numeracy, 6(2).
Mandell, L. (2008). Financial literacy of high schools students.
Handbook of Consumer Finance Research, New York: Springer. Mccormeck, M. H. (2009). The effectiveness of youth financial
education: a review of the literature. Journal of Financial Counseling and Planning, 20(1), 70-83.
Monticone, C. (2010). How much does wealth matter in the acquisition of financial literacy? The Journal of Consumer Affairs, 44(2), 403-422.
Mottola, G. R. (2013). In our best interest: women, financial literacy, and credit card behavior. Numeracy, 6(2).
National Financial Capability Study (NFCS). (2013). Report of findings from the 2012. Financial Industry Regulatory Authority (FINRA).
Retrieved on April 30, 2014, from http://www.usfinancialcapability. org/downloads/NFCS_2012.
Norvilitis, J. M., & MacLean, M. G. (2010). The role of parents in college students’ financial behaviors and attitudes. Journal of Economic Psychology, 31 (1), 55-63. Retrieved December 07, 2014, from http://dx.doi.org/10.1016/j.joep.2009.10.003.
O’Neill, B., & Xiao, J. (2012). Financial behaviors before and after the financial crisis: evidence from an online survey. Journal of Financial Counseling and Planning, 23(1), 33-46.
Organisation for Economic Co-Operation and Development .OECD. (2013). Financial literacy and inclusion: Results of OECD/INFE survey across countries and by gender. OECD Centre, Paris, France. Pinto, M. B., Parente, D. H., & Mansfield, P. M. (2005). Information
learned from socialization agents: its relationship to credit card use. Family and Consumer Sciences Research Journal, 33(4), 357-367.
Potrich, A. C. G., Vieira, K. M., & Ceretta, P. S. (2013). Nível de alfabetização financeira dos estudantes universitários: afinal, o que é relevante? Revista Eletrônica de Ciência Administrativa – RECADM, 12(3), 315-334.
Potrich, A. C. G., Vieira, K. M., & Kirch, G. (2014). Você é alfabetizado financeiramente? Descubra no termômetro de alfabetização financeira. Anais do Encontro Brasileiro de Economia e Finanças Comportamentais, São Paulo, SP, Brasil, 01.
Remund, D. L. (2010). Financial literacy explicated: the case for a clearer definition in an increasingly complex economy. The Journal of Consumer Affairs, 44(2), 276-295.
Research, R. M. (2003). Survey of adult financial literacy in Australia.
ANZ Banking Group. Retrieved on April 16, 2013, from http:// www.anz.com/Documents/AU/Aboutanz/AN_5654. Robb, C. A., Babiarz, P., & Woodyard, A. (2012). The demand for
financial professionals’ advice: the role of financial knowledge, satisfaction, and confidence. Financial Services Review, 21(4), 291-305.
Robb, C. A., & Sharpe, D. L. (2009). Effect of personal financial knowledge on college students’ credit card behavior. Journal of Financial Counseling and Planning, 20(1), 25-43.
Scheresberg, C. B. (2013). Financial literacy and financial behavior among young adults: evidence and implications. Numeracy, 6(2). Sekita, S. (2011). Financial literacy and retirement planning in Japan.
Journal of Pension Economics and Finance, 10(4), 637-656. Servon, L. J., & Kaestner, R. (2008). Consumer financial literacy
and the impact of online banking on the financial behavior of lower-income bank customers. Journal of Consumer Affairs, 42(2), 271-305.
Shim, S., Barber, B. L., Card, N. A., Xiao, J. J., & Serido, J. (2010). Financial socialization of first-year college students: the roles of parents, work, and education. Journal of Youth and Adolescence, 39(12), 1457-1470
Shockey, S. S. (2002). Low-wealth adults financial literacy. Money management behavior and associates factors, including critical thinking. Unpublished master’s thesis. University of Utah, United States.
StataCorp (2013). Stata Base Reference Manual: Release 13. College Station, Texas: Stata Press.
Appendix Questions concerning the constructs financial attitude, behavior, and knowledge
Financial attitude
1. It is important to set goals for the future.
2. I do not worry about the future, I live only in the present. ** 3. Saving is impossible for our family.
4. After making a decision about money, I tend to worry too much about my decision.
5. I like to buy things, because it makes me feel good.
6. It is hard to build a family spending plan.
7. I am willing to spend money on things that are important to me.
8. I believe the way I manage my money will affect my future.
9. I think it is more satisfying to spend money than save it for the future. **
10. Money is made to be spent. **
Financial beha
vior
11. I make notes and control my personal spending (e.g. monthly spreadsheet of income and expenses).
12. I compare prices when making a purchase.
13. I save some money I receive each month for a future need. ** 14. I have a spending/budget plan.
15. I am able to identify the costs I pay to buy a product on credit.
16. I set goals to guide my inancial decisions.
17. I usually reach the goals I set when managing my money. 18. I discuss with my family about how I spend our money.
19. I pay my bills on time.
20. I save a part of my income every month. **
21. I spend money before getting it.
22. I often ask family or friends to borrow me money to pay my bills.
23. I analyze my bills before making a large purchase.
24. Every month I have enough money to pay all expenses of my own and ixed household expenses.
25. I keep organized inancial records and I can ind documents easily.
26. I avoid buying on impulse and use shopping as a form of entertainment. 27. I pay the credit card invoices in full to avoid interest charges.
28. I save money regularly to achieve long-term inancial goals such as, e.g. my children’s education, purchasing a home, retirement. ** 29. I know the percentage I pay as income tax.
30. I have my money invested in more than one kind of investment (real estate, stocks, bonds, savings). 31. I start saving more when I get a pay rise. **
32. I have a inancial reserve equal to or greater than 3 times my monthly expenses, and it can be quickly accessed.
33. Calculate my estate annually.
34. Before buying anything, I carefully check whether I am able to pay for it.
35. People think my income is not enough to cover my expenses.
36. In the last 12 months I have been able to save money. **
37. When deciding on which inancial products and loans I will use, I consider the options from various companies/banks.
Thaler, R. H. (2013 October 5). Financial literacy, beyond the classroom. The New York Times. Retrieved on April 3, 2015, from http://www.nytimes.com/2013/10/06/business/finan cial-literacy-beyond-theclassroom.html?r=3&.
Van Rooij, M. C. J., Lusardi, A., & Alessie, R. J. M. (2011). Financial literacy and retirement planning in the Netherlands. Journal of
Economic Psychology, 32(4), 593-608.
World Bank (2014). Global financial development report: financial inclusion. Report. Retrieved on April 5, 2015, from http:// siteresources.worldbank.org/EXTGLOBALFINREPORT /Resou rces/8816096-1361888425203/9062080-1364927957721/GFDR-2014_Complete_Report.pdf.
Correspondence Address:
Ani Caroline Grigion Potrich
Centro de Educação Superior Norte, Universidade Federal de Santa Maria Avenida Independência, 3751 – CEP: 98300-000
Financial kno
wledge
38. Assume you have R$ 100.00 in a savings account at an interest rate of 10% per year. After ive years, which is the value you have in savings? Consider no money has been deposited or withdrawn.
* More than R$ 150.00. Less than R$ 150.00.
Exactly R$ 150.00. I do not know.
39. Assume Joseph inherits R$ 10,000.00 today and Pedro inherits R$ 10,000.00 in about 3 years. Because of inheritance, who will get richer?
* José. They are equally rich.
Pedro. I do not know.
40. Imagine that the interest rate on your savings account is 6% per year and the inlation rate is 10% per year. After one year, how much you will be able to buy with money from that account? Consider no money has been deposited or withdrawn.
More than today. * Less than today.
Exactly the same. I do not know.
41. Assume that in 2014 your income will double and the prices of all goods also will double. In 2014, how much will you be able to buy with your income?
More than today. Less than today.
Financial kno
wledge
* Exactly the same. I do not know.
42. Considering a long period of time (e.g. 10 years), which asset does usually offer higher return?
Savings account. Government securities. * Stocks. I do not know.
43. Usually, which asset has the highest luctuations over time?
Savings account. Government securities.
* Stocks. I do not know.
44. When an investor distributes his investments among different assets, the risk of losing money:
Increases. Remains unchanged. * Decreases. I do not know.
45. A loan with maturity of 15 years usually requires higher monthly payments than a 30-year loan, but the total amount of interest paid at
the end of the loan will be lower. This statement is:
* True. I do not know. False.
46. Assume you took a loan of R$ 10,000.00 to be paid after one year and the total cost with interest is R$ 600.00. The interest rate
you will pay on this loan is:
0.3%. * 6%.
0.6%. I do not know.
3%.
47. Assume you saw the same television at two different stores for the initial price of $ 1,000.00. The Shop A offers a discount of R$ 150.00, while shop B offers a discount of 10%. What is the best alternative?
* Buying in shop A (discount of R$ 150.00). I do not know. Buying in shop B (discount of 10%).
48. Imagine ive friends receive a donation of R$ 1,000.00 and must equally divide the money between them. How much will any of them get?
100. 5,000. * 200. I do not know.
1,000.
49. An investment with high return rate will have high risk rate. This statement is:
* True. I do not know.
False.
50. When the inlation rate increases, the cost of living rises. This statement is:
* True. I do not know.
False.