Avoiding Reporting Losses: An Empirical Study of Earnings
Management via Operating Decisions
Elizio Marcos dos Reis
Universidade Federal de Minas Gerais, Faculdade de Ciências Econômicas, Departamento de Ciências Contábeis, Belo Horizonte, MG, Brazil
Wagner Moura Lamounier
Universidade Federal de Minas Gerais, Faculdade de Ciências Econômicas, Departamento de Ciências Contábeis, Belo Horizonte, MG, Brazil
Valéria Gama Fully Bressan
Universidade Federal de Minas Gerais, Faculdade de Ciências Econômicas, Departamento de Ciências Contábeis, Belo Horizonte, MG, Brazil
Received on 09.11.2014 – Desk Acceptance on 10.03.2014 – 4th version accepted on 07.04.2015.
ABSTRACT
The aim of this paper is to verify whether Brazilian companies listed on the BM&FBOVESPA used earnings management via operating decisions, when faced with reporting unfavourable results, in order to avoid disclosing losses. Using panel data covering years from 2008 to 2013 in estimated regression models, the paper focuses on three ways of manipulating financial results through operational decisions: by manipulating sales; by reducing selling, general and administrative expenses (SG&A); and by increasing production to report lower costs of goods sold. The results show that the companies did use SG&A to avoid reporting losses, but did not manipulate sales or levels of production for such purposes. The evidence presented suggests that in Brazil managers are only able to manipulate operational activities by reducing operating expenses (SG&A), probably due a lack of flexibility in the production process and the cash flow constraints faced by Brazilian companies. From a users’ perspective, this paper finds that companies do use earnings management via operating decisions to avoid disclosing losses to capital markets, which is consistent with the Prospect Theory.
1 INTRODUCTION
for managers to report manipulated results to the ma-rket is in order to announce some profit, no matter how low. In other words, the level of profit reported would be just above zero.
When interviewing 401 executives, Graham et al. (2005) found consistent evidence of the importance of achieving or exceeding a target result. 86.3% of those interviewed believed that achieving a particular benchmark resulted in credibility within the capital market and more than 80% agreed that this helped to maintain or increase a company’s market value. In other words, managers believe that achieving a target level of profit conveys the prospect of future growth to investors (Graham et al., 2005).
Therefore, given the incentives companies have to achieve positive results as a way of satisfying capital market expectations and the possibility of managers using operating decisions in order to achieve this, the question this paper intends to address is: faced with reporting negative results, do publicly traded Brazi-lian companies tend to engage in earnings manage-ment via operating decisions, in order to avoid dis-closing losses?
More specifically, this study, covering the years from 2008 to 2013, aims to verify whether, when faced with reporting negative results, Brazilian companies listed on the BM&FBOVESPA used earnings manage-ment via operating decisions in order to avoid disclo-sing losses.
As Matinez (2009) notes, although this issue is wi-dley discussed in international literature, there are still only a limited number of studies (Martinez & Cardoso, 2009; Verhagem, Santos, & Bezerra, 2011; Rey, 2012; Cupertino, 2013; Reis, Cunha, & Ribeiro, 2014) that have been conducted in order to unders-tand the specific circumstances that could motivate Brazilian companies to manipulate financial results by way of operating decisions. “The majority of scien-tific studies still concentrate on the management of results via accruals, whereas research into the use of operating decisions as a way of managing results is weak” (Martinez, 2013, p. 5).
Thus, this study contributes academically in at-tempting to understand how Brazilian companies engage in earnings management by way of operating decisions, especially when there is the specific aim to not disclose financial losses. It is important to men-tion, however, that one form of earnings management via operating decisions involves price discounts in or-der to sell more and thus increase profit. However, the tax rules to which Brazilian companies are subject di-ffer to those, for example, for North American compa-nies. Because of this, the results found when looking at Brazil may differ from those found in international studies.
The accounting information disclosed by compa-nies by way of financial statements is the main way for management to communicate with the various stakeholders who are interested in their economic and financial conditions. This information is taken as in-dicators of company performance and is of great im-portance to those who use it, some of whom include: shareholders measuring management performance; creditors resolving restrictive clauses in debt cove-nants; clients evaluating a company’s ability to sup-ply goods and services; suppliers analyzing whether a company can fulfill its commitments; and employe-es predicting future outlook and job stability, among others (Goncharov, 2005).
Therefore, managers, experts in their business, can use their knowledge to disclose information whi-ch reflects the economic reality of the company, thus potentially increasing the credibility of financial ac-counts as a means of communication with those using them. However, managers engaging in the use of their own judgement creates opportunities for Earnings Management, in which they make discretionary ac-counting choices that do not adequately reflect the economic and financial reality of the company (Healy & Wahlen, 1999).
The use of discretion by managers and their enga-ging in earnings management derives from the exis-tence of different, but equally accepted, accounting methods used to treat recognition, measurement and disclosure of company economic events. These are not objective but instead depend on managers’ jud-gements and estimations, such as when making bad debt provisions and contingencies (Goulart, 2007), known in academic management literature as accru-als. Research has increasingly come to focus, however, on other forms of earnings management, known as operational, in which decisions taken by management have been considered more damaging to companies and market participants because they affect cash flow and not only profit (Roychowdhury, 2006). Moreover, earnings management via accruals is easier for the market, auditors and regulators to detect, compared with earnings management via operating decisions, which could thus encourage companies to use this strategy (Graham, Harvey, & Rajgopal, 2005; Cohen & Zarowin, 2010).
This paper therefore focuses on the decisions ma-nagers take in order to manage particular financial results, or, in other words, management activity that alters the accounting figures disclosed.
nipulated financial results in order to avoid repor-ting losses.
In light of the evidence presented by Hayn (1995), Burgstahler and Dichev (1997) analyse earnings management in order to avoid reporting losses between 1976 and 1994. They document evidence that two components of profit, cash flow from operations and changes in working capital, were used to manage results. Their findings show an increase in the level of cash flow from opera-tions close to the zero-profit reference and a corre-lation between working capital accumucorre-lation and profits. One of the explanations that the resear-chers offer is that managers avoid reporting losses because there is an absolute and relative aversion to losses among capital market agents, just as the prospect theory suggests (Burgstahler & Dichev, 1997).
Dechow, Richardson, and Tuna (2003), follo-wing on from the results of Burgstahler and Dichev (1997), aim to reexamine whether earnings mana-gement provides a partial or complete explanation for the discontinuity of earnings per share close to the zero-profit reference point. The evidence presented by the writers indicates that those firms with small profits had high levels of discretionary accruals compared with the rest. This is consistent with the idea that companies engage in earnings management, however it is not enough to explain the discontinuity around zero profit.
Comparing firms with small profits with firms with small losses, the researchers found high dis-cretionary accruals for both groups and a similar share of companies with positive discretionary ac-cruals. Therefore, if companies with small losses had on average positive discretionary accruals, this would suggest that they too were faced with an in-centive to raise profits, even when they reported losses (Dechow et al., 2003).
In conclusion, they suggest that, for North American companies between 1988 and 2000, one of the causes of the discontinuity close to zero, detected using the frequency distribution method and net profit divided by market value, could lie in the real actions taken by managers in order to avoid reporting losses, and not only in discretio-nary accruals.
Martinez (2001) had already argued that earnin-gs management does not derive exclusively from the formal manipulation of financial accounts. In some cases, earnings management may derive from concrete decisions and actions, with implications for company cash flow. Paulo (2007) divided the manipulation of results into: (i) earnings ment via accounting choices; (ii) earnings
2 THEORETICAL FRAMEWORK
A number of theories can be used to explain managers deciding to engage in earnings manage-ment. The agency theory, for example, in descri-bing the conflicts of interests that exist between shareholders and managers, offers good reasons to believe that managers do not always act in ac-cordance with the interests of shareholders, by in-fringing contractual rules or excerting a degree of effort that is more in their own (the agent’s) inte-rests than in that of the principal.
Thus, assuming that managers are maximizers of their efforts, they would have sufficient motives to make accounting choices that would ultimately benefit themselves. They would be expected to ma-nage financial results in order to improve the level of renumeration offered to them by the principal as a way of aligning all of their interests. Therefo-re, given that companies are a nexus of contracts, where agent relationships are established in whi-ch the pursuit to maximize individual objectives can prevail, and given the role of accounting in-formation in bonus contracts drawn up in order to bypass agency status, there do exist incentives to manage earnings (Baptista, 2008), using the free-dom allowed within the law to pursue private inte-rests (Nardi & Nakao, 2009).
With a view towards the capital market, Bur-gstahler and Dichev (1997) argue that a possible explanation for companies reporting profit, even if it is small, could lie in the prospect theory, whi-ch assumes market agents having an absolute and relative aversion to losses. This theory assumes that individuals determine the value of a choice by comparing it with a point of reference, such as zero profit. Therefore, supposing that the cost of managing earnings in order to achieve a particular target figure is roughly constant and that managers manipulate measurements of profit in order to alter the value assigned by shareholders and other inte-rested parties, management behaviour that aims to raise earnings above a particular point of reference can be expected. Here this would be zero-level pro-fits (Burgstahler & Dichev, 1997).
ma-ment via operating decisions; and (iii) manipula-ting classifications within accounmanipula-ting statements. In the opinion of Gunny (2010), earnings manage-ment can be divided into two categories: Accruals Earnings Management (AEM), or manipulation of accruals; and Real Earnings Management (REM), involving real operational activities.
Accruals are all amounts in financial results that affect profit calculations, but that do not ne-cessarily involve movements in cash flow (Marti-nez 2001). Roychowdhury (2006) documents that the manipulation of accounting accruals does not directly affect a company’s cash flow, and is simply a result of the accrual basis of accounting, in which accounting transactions are posted within the pe-riod in which they are carried out. Thus, revenue is recognized in accordance with achievement and set against those expenses associated with such achievement (Martinez, 2001).
Real earnings management (REM), unlike ac-cruals, occurs when managers alter a company’s operating activities in an effort to increase or re-duce the current period’s results (Gunny, 2010). Roychowdhury (2006) defines the manipulation of real activities as management activites that deviate from what are considered normal business practi-ces, with the aim of meeting certain earnings cons-traints. In other words, the manipulation of real activities is considered a departure from operating practices, and is motivated by managers’ desire to deceive certain stakeholders, who believe that par-ticular targets in financial reports have been achie-ved during a company’s normal operating activi-ties (Roychowdhury, 2006).
Decisions that affect cash flow are documented in national and international literature and inclu-de: (i) increases in sales revenue due to an acce-laration in the sales process and/or unsustainable sales generation via an increase in (temporary) discounts in prices or an easing of restrictions to credit for clients; (ii) the timing of delivery of goo-ds to clients; (iii) a reduction in the cost of googoo-ds sold via an increase in production levels (econo-mies of scale), thus improving the financial results for the period; (iv) a reduction in research and development, staff training, factory maintenance, and sales, marketing and administrative expenses; and (v) the timing of making investments (Fields, Lyz, & Vincent, 2001; Martinez, 2001; Goncharov, 2005; Roychowdhury, 2006; Paulo, 2007; Martinez & Cardoso, 2009; Gunny, 2010; Zang, 2012).
Roychowdhury (2006) developed tests in or-der to investigate whether there is evidence of ab-normal real activities among companies that post small annual profits. Using information covering the years 1987 to 2001 for all of the companies in the COMPUSTAT database, where there was su-fficient data to calculate the necessary variables,
but excluding financial companies and regulated industries with accounting characteristics that di-ffered from the rest, and employing the statistical models developed by Dechow, Kothari, and Wat-ts (1998), it was shown that those companies that disclosed a positive profit margin close to zero, re-ported, on average, abnormally low operating cash flow, 2% lower, in terms of total assets, than that of the other companies in the sample. This suggests that the managers manipulated sales and/or enga-ged in overproduction in order to improve the fi-nancial results for the period, but at the same time decreased operating cash flow. From this result the first hypothesis of this study can be extracted:
Hypothesis 1: Those companies that disclosed
positive profit margins, close to zero, had abnor-mally lower operating cash flow compared with the other Brazilian companies.
Gunny (2010) used a sample from between 1988 and 2002 of non-financial North American com-panies to examine the consequencies of earnings management via operating decisions, in order to achieve zero profit or the same profit as the pre-vious year. He found that earnings management via operating decisions was positively related with fir-ms that achieved these benchmarks (Gunny, 2010). Specifically, they had 0.99% lower selling, gene-ral and administrative expenses (SG&A) than the other companies in the study. This result is con-sistent with the findings of Roychowdhury (2006), who documents that those companies committed to not reporting losses had 5.91% lower SG&A than the other companies examined. In other wds, the companies decreased their expenses in or-der to avoid disclosing losses.
Hypothesis 2: Those companies that disclosed
positive profit margins close to zero had abnor-mally lower SG&A compared with the other Bra-zilian companies.
Evidence that those companies that reported positive profit margins close to zero had abnor-mally high volumes of production, can be found in the works of Roychowdhury (2006), Gunny (2010) and Zang (2012). They show, respectively, that those companies that avoided disclosing los-ses had abnormally higher production levels of, on average, 4.97%, 4.80% and 2.49%, compared with the other companies in the sample. In other words, they raised production levels, thus lowering fixed costs per unit, in order to lower the costs of goods sold, and in doing so increased profits for the pe-riod in question. These findings lead to the follo-wing hypothesis:
Hypothesis 3: Those companies that disclosed
Gunny (2010) stresses that managers can enga-ge in more than one type of REM simultaneously, due to the number of motivations they face. Fur-thermore, one strategy can be more or less aggres-sive and the effect of one form of management can cancel the effect of the other. He found that those companies with positive profit margins close to zero generally engaged in more significant earnin-gs management via operating decisions than the other companies. They reported abnormal levels of REM of, on average, 4.40% lower that those of the other companies in the sample. Hence, a new hypothesis can be outlined:
Hypothesis 4: Those companies that disclosed
positive profit margins close to zero engaged in an abnormal amount of Real Earnings Management compared with the other Brazilian companies.
In Brazil, some studies that focus on earnings management via operating decisions have started to appear. Martinez & Cardoso (2009) in a study covering the years 1998 to 2004, analyse non-fi-nancial companies listed on the BM&FBOVESPA and find significant evidence of general SG&A ma-nagement, as well as level of production manage-ment.
Verhagem et al. (2011), in a study covering the years 2005 to 2009, look for evidence of finan-cial statement management via operating deci-sions in Steel and Metallurgy firms listed on the BM&FBOVESPA, as well as analysing whether the corporate governance at these companies provided an incentive or not for such management practi-ces. Adopting the econometric models proposed by Anderson, Banker, and Janakiraman (2003) and Rowchowdhury (2006), they verify that the com-panies examined a priori managed their financial statements via operating decisions. Moreover, they find that corporate governance provided a coun-terincentive to earnings management via opera-ting decisions, in terms of SG&A. However, when looking at production levels in the companies analysed, it is found that corporate governance did provide an incentive for earnings management. The conflicting results in this study may be due to the proxy chosen to represent corporate gover-nance, since the mechanisms involved should stifle any type of accounts manipulation.
Rey (2012) assesses the impact of Sarbanes--Oxley (SOX) on earnings management, via both operating decisions and accounting choices, using information covering 1997 to 2002, for Brazilian
companies that issued Level 2 and Level 3 Ameri-can Depositary Receipts (ADRs). His findings do not lead to the conclusion that the implementation of SOX has had an impact on earnings manage-ment practices among these particular Brazilian companies. It is even found that the companies used earnings management via accounting choices and via operating decisions in a way in which they complimented each other.
Cupertino (2013) also analyses earnings mana-gement via operating decisions in the Brazilian ca-pital market. He uses data covering the years 1989 to 2012 for companies listed on the BM&FBOVESPA, but excludes financial companies, funds and spe-cifically regulated sectors. He also finds evidence of financial statement manipulation via operating decisions in the Brazilian capital market. However, although he understands the consequences of ma-nipulation via a reduction in discretionary expen-ses, he fails to evaluate the effects of cost of pro-duction management, as well as the effects on cash flow of manipulating sales.
Reis, Cunha, and Ribeiro (2014) analyse finan-cial statements covering the years 2007 to 2011 for 100 companies listed on the Índice Brasil –IBrX, using models implementated by Rowchowdhury (2006) and panel data estimates, with the aim of verifying to what extent companies manipulated their financial statements by means of operating decisions. The statistical evidence suggests that the companies on the IBrX did not use sales volumes or production levels in order to improve or lower financial results. The researchers state that accru-als manipulation may have been preferred to such operating decisions, since they are not normally reflecting in cash flow and do not influence the operational structure of companies.
Studies on this subject carried out in Brazil, with the exception of Cupertino (2013), have focused on earnings management via operating decisions in a general way and on some of the incentives and disincentives for such practices. However, papers that analyse the operating decisions taken by ma-nagers in order to avoid disclosing losses are not found in the main Brazilian journals. Therefore, in addressing this subject, this paper contributes in developing research into the subject in Brazil, with the aim of bringing new elements to the aca-demic debate about earnings management, which has been more widely discussed on an internatio-nal level.
3 METHODOLOGY
3.1 Defining the Type of Study and the Sample
his paper aims to be descriptive and takes a
from the financial statements of companies available in Economatica®. The quantitative approach involves using statistical procedures such as descriptive data analysis, as well as regression models using unbalan-ced panel datasets.
In order to carry out such a study into earnings
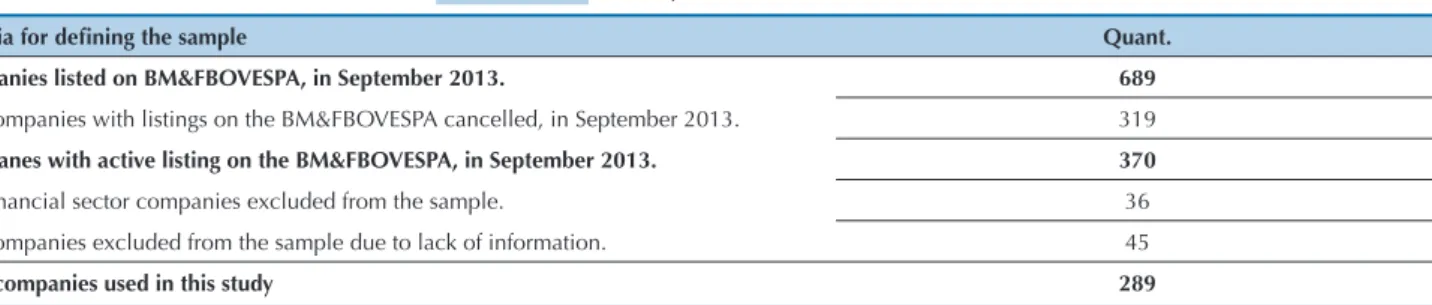
management, a number of publicly-traded companies listed on the BM&FBOVESPA were chosen, as shown in Table 1, since they are key to discussions about the possible manipulation of the accounting information presented to market participants, particularly inves-tors.
1
2
3
Source: Economatica® 2013
Criteria for deining the sample Quant.
Companies listed on BM&FBOVESPA, in September 2013.
( - ) Companies with listings on the BM&FBOVESPA cancelled, in September 2013.
Companes with active listing on the BM&FBOVESPA, in September 2013.
689
319
370
( - ) Financial sector companies excluded from the sample. 36
( - ) Companies excluded from the sample due to lack of information. 45
Total companies used in this study 289
Table 1 Sample Definition
The data comes from the financial statements of 289 companies listed on the BM&FBOVESPA, collected quarterly between the 1st quarter of 2008 and the 2nd quarter of 2013. This period was chosen since informa-tion from Cash Flow Statements was required and this report only became compulsory from then on. Also, in order to obtain the number of companies used in this study, those from the financial and funds sector were excluded, since information on sales revenue and cost of goods sold was not available for companies from this sector. Also excluded was information that was consi-dered to contain discrepancies compared to the variable average, taken as three deviations below and above the average, a common methodology in empirically investi-gative studies in this area, such as Cupertino (2013).
It should be noted that, since working with unbalan-ced panel datsets, only the figures considered outliers and not the companies themselves were excluded. Ho-wever, in cases where exclusion of data resulted in to-tal loss of information for the period, companies were excluded. This methodology led to the exclusion of six companies among the 45 excluded from the sample due
to lack of information.
3.2 Econometric Models for Testing the Paper’s
Hypotheses
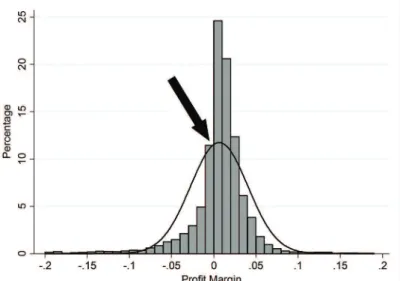
Figure 1 Frequency distribution of quarterly proit margin between 2008 and 2013. Source: Developed by the authors.
As can be seen in Figure 1, there is a greater concentration of information on the positive side, suggesting that, between 2008 and 2013, Brazilian companies listed on the BM&FBOVESPA more of-ten reported positive profit margins. It should be noted, however, that the route from the negative to the positive part of the graphic cannot be con-sidered normal, given that there is a leap in profit
margin at zero, thus suggesting that the companies just above zero used some trick in order to move from a negative to a small, positive result close to zero.
In order to test the hypotheses of this paper, the following models, also adopted by Roychowdhury (2006), Gunny (2010), Zang (2012) and Cupertino (2013), were used:
4
In which:
CFOit = Cash Flow from Operations of company i in period t;
SG&Ait = Sales, General and Administrative Expen-ses of company i in period t;
PRODit = Cost of Good Sold + Variation in Stock of company i in period t;
Ait-1 = Total Assets of company i in period t – 1; NRit = Net Revenue of company i in period t;
ΔNRit = Variation in Net Revenue of company i in period t in relation to t -1;
ΔNRit-1 = Variation in Net Revenue of company i in period t – 1 in relation to t – 2;
β0, β1, β2, β3 e β4 = Coeficient Estimates in the Model; ci+εit are the error terms in the model;
ci is the component that indicates the non-observable specific individual effect, that differs between units, and is unchanging over time;
εit is the component that varies with the units and with time, known as the “usual” regression error, with an average of zero, not inter-correlated, not correlated with x, and homoscedastic;
t = quarter.
These models take into consideration some of the
ac-counting variables that, in a sense, represent a company’s operating activity levels. The proxies for REM are obtai-ned taking the difference between the values observed for the variables CFO, SG&A and PROD and the values calculated for them using Equations 1, 2 and 3, thus providing the abnormal levels known here as ACFO, ASG&A and APROD. These variables are used as de-pendants in Equations 4, 5, 6 and 7, in order to test the hypotheses in this paper.
In order to identify the companies suspected of ear-nings management and achieve the aim of this study, the frequency distribution (histogram) methodology, alre-ady adopted by a number of researchers such as Hayn (1995), Burgstahler and Dichev (1997), Martinez (2001), Dechow, Richardson, and Tuna (2003), Roychowdhury (2006), Paulo, Martins, and Corrar (2007), Gunny (2010), and Zang (2012), is used.
8
6
7
In which:
ACFOit = Abnormal level of CFO in company i in period t;
ASG&Ait = Abnormal level of SG&A in company i in period t:
APRODit = Abnormal level of PROD in company i in period t;
REMit = Aggregate measure (Equation 8) for com-pany i in period t;
D1it = Dummy variable, assumed as 1 for suspected companies (positive profit margin close to zero) and 0 otherwise, for company i in period t;
SIZEit = Natural logarithm of the total assets of company i in period t;
MTBit = The market value of capital divided by the net equity of company i in period t;
ROAit = Net profit divided by the total assets of company i in period t;
γ0, γ1, γ2, γ3 e γ4 = estimated coefficients in the mo-del;
t = quarter.
Similarly to the studies by Roychowdhury (2006) and Gunny (2010) we use SIZE, MTB and ROA as control variables that represent, respectively, the size of the companies, the opportunities for growth and the performance. For these researchers, these varia-bles can influence in the extent of earnings manage-ment in a general way. Managemanage-ment at larger compa-nies can, at any given time, more easily take decisions such as to produce more, in order to increase stock,
for example. The variable linked to the capital market, MTB, is related to the outlook shareholders have for a company, and can influence in the form of earnings management. Return on Assets is linked to profit, in that positive profit leads to a positive ROA.
Interpreting the coefficients, the γ1 in Equations 4, 5, 6 and 7, tests, respectively, hypotheses 1, 2, 3 and 4, related with earnings management via operating de-cisions, in order to avoid reporting losses. This coeffi-cient should be negative in Equations 4 and 5 and po-sitive in Equation 6, since companies that manipulate financial results in order to improve them and thus avoid reporting losses will probably have abnormally low ACFO and/or ASG&A (Roychowdhury, 2006; Cohen, Dey, & Lys, 2008; Martinez & Cardoso, 2009; Cohen & Zarowin, 2010; Gunny, 2010; Zang, 2012; Cupertino, 2013). For Equation 7, consistent with Gunny (2010), an aggregate measure for the three REM proxies is constructed, and is shown in Equation 8. Here, the coefficient γ1 should be negative.
Worth noting is that the dummy, present in Equa-tions 4, 5, 6, and 7, varies between the companies and over time, since a company may or may not be suspected of earnings managemet via operating deci-sions, and even be suspected in one quarter, but not in another and so on.
To summarize, what this paper attempts to verify is whether the coefficient related to the dummy variable is significant and whether it contributes to improving financial results in order to avoid reporting losses.
4 PRESENTATION AND ANALYSIS OF RESULTS
4.1 Descriptive Statistics
To begin, Table 2 presents the correlations
betwe-en the variables that are used in the models to esti-mate normal levels of CFO, PROD and SG&A.
Variables 1/Ai,t-1 NRit/Ai,t-1 NRit-1/Ai,t-1 ∆NRit/Ai,t-1 ∆NRit-1/Ai,t-1 SG&Ait/Ai,t-1 PRODit/Ai,t-1 CFOit/Ai,t-1
1/Ai,t-1 1.000
NRit/Ai,t-1 0.038 1.000
NRit-1/Ai,t-1 0.031 0.928 1.000
∆NRit/Ai,t-1 -0.022 0.251 -0.075 1.000
∆NRit-1/Ai,t-1 -0.031 0.079 0.227 -0.257 1.000
SG&Ait/Ai,t-1 0.150 0.625 0.591 0.114 0.042 1.000
PRODit/Ai,t-1 -0.002 0.911 0.848 0.214 0.059 0.433 1.000
CFOit/Ai,t-1 -0.038 0.110 0.092 0.032 0.005 0.060 0.006 1.000
Note: NR = Net Revenue; ∆NR = Variation in Net Revenue; SG&A = Sales, General and Admin Expenses; PROD = CGS+∆Stocks; CFO = Cash Flow from Operations; A = Assets.
Source: Developed by the authors.
he variable SG&A is highly correlated with Net Reve-nues in the current period (0.625) and with Net ReveReve-nues from the former period (0.591). his relationship can be considered normal, since an increase in a company’s re-venues can lead to higher selling expenses, such as com-missions paid to salespeople and administrative expenses.
It can also be observed that the variable PROD has a strong correlation with Net Revenues in the current pe-riod (0.911) and with Net Revenues in the former pepe-riod (0.848). his means that an increase in a company’s sales is accompanied by an increase in production levels, since companies, in increasing sales, must produce more in or-der to meet demand, thus incurring higher costs of pro-duction. On the other hand, a very weak or almost
inexis-tent correlation can be observed between Cash Flow from Operations, Net Revenue and Variations in Net Revenue. his phenomenon may be due to the timing diference between the recognition of sales via the accrual basis of accounting and the moment of receipt from sales. Despite these variables having a strong correlation, they will not be used as independent in one same equation. herefore, there is no potential for multicolinearity between these variable.
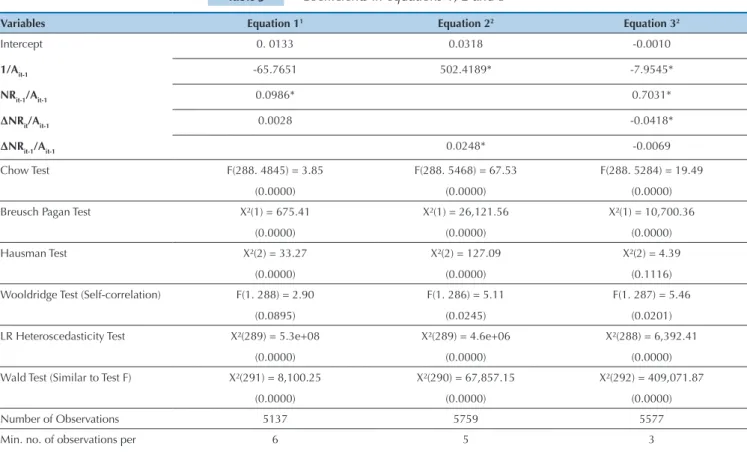
Using the estimations of Equations 1, 2 and 3, the nor-mal levels for the dependent variables can be calculated and the dependent variables can be compared with the va-lues found, providing the abnormal levels ACFO, ASG&A and APROD, as shown in Table 3.
Table 3 Coefficients in equations 1, 2 and 3
Variables Equation 11 Equation 22 Equation 32
Intercept 0. 0133 0.0318 -0.0010
1/Ait-1 -65.7651 502.4189* -7.9545*
NRit-1/Ait-1 0.0986* 0.7031*
∆NRit/Ait-1 0.0028 -0.0418*
∆NRit-1/Ait-1 0.0248* -0.0069
Chow Test F(288. 4845) = 3.85
(0.0000)
F(288. 5468) = 67.53
(0.0000)
F(288. 5284) = 19.49
(0.0000)
Breusch Pagan Test X²(1) = 675.41
(0.0000)
X²(1) = 26,121.56
(0.0000)
X²(1) = 10,700.36
(0.0000)
Hausman Test X²(2) = 33.27
(0.0000)
X²(2) = 127.09
(0.0000)
X²(2) = 4.39
(0.1116) Wooldridge Test (Self-correlation) F(1. 288) = 2.90
(0.0895)
F(1. 286) = 5.11
(0.0245)
F(1. 287) = 5.46
(0.0201)
LR Heteroscedasticity Test X²(289) = 5.3e+08
(0.0000)
X²(289) = 4.6e+06
(0.0000)
X²(288) = 6,392.41
(0.0000) Wald Test (Similar to Test F) X²(291) = 8,100.25
(0.0000)
X²(290) = 67,857.15
(0.0000)
X²(292) = 409,071.87
(0.0000)
Number of Observations 5137 5759 5577
Min. no. of observations per
group
6 5 3
Table 3 Continuation
The model validation tests presented in Table 3, especially the Wald Test (similar to the F Test), show coefficients that are significantly different to zero, and thus the abnormal levels used to analyse and in-terpret earnings management via operating decisions can be reliably obtained.
The coefficient associated with the net revenue variable, in Equation 1, is positive at 0.0986 and sig-nificant to a degree of 1%. On the other hand, the variation in net revenue does not have a significant coefficient. This means that a positive variation in sa-les does not imply a positive variation in Cash Flow from Operations in the current period, which is an unexpected result, in the presence of earnings ma-nagement. These results are consistent with Roycho-wdhury (2006) and Cupertino (2013), whose respec-tive research has similar findings.
In Equation 2, the coefficient associated with the net revenue variable is positive at 0.0248 and signifi-cant to a degree of 1%, from which it can be concluded that an increase in net revenue in a unit positively re-flects by 0.0248 in the SG&A of the companies in the sample. The results are consistent with those found by Roychowdhury (2006), Zang (2012), Rey (2012) and Cupertino (2013).
This means, from an accounting point of view, that SG&A accompanies the companies’ volume of sales, suggesting that the costs of obtaining revenues are re-cognized in the same period as they are incurred, as is laid out by the principle of ownership.
This reinforces the reliability of the accounting fi-gures for their users, since, in showing that companies follow accounting principles in recognizing expenses and revenues, accounting information from different companies can be reliably compared.
In relation to Equation 3, the coefficient of the net revenue variable is positive at 0.7031 and significant to a degree of 1%. In other words, an increase in net revenue in a unit is positively reflected by 0.7031 in the levels of production of the companies in the sam-ple. These results are consistent with those found by Roychowdhury (2006), Martinez and Cardoso (2009),
Gunny (2010), Verhagem, Santos, and Bezerra (2011), Zang (2012), Rey (2012) and Cupertino (2013).
The coefficient associated with the variation in net revenue in the current period is negative by -0.0418 and significant to a degree of 1%. This means that a positive variation in this variable reflects negatively in the production levels of the companies listed on the BM&FBOVESPA, from 2008 to 2013. In other words, when the sales of these companies increase, production levels fall. The opposite should happen, since, as sales rise, there is a tendency to increase production in order to meet demand. There appears to thus be evidence that companies use operating decisions related to produc-tion volumes in order to improve financial results, since, from an accounting point of view, in the same period a company produces more than necessary, thus reducing fixed costs per unit, the values stored in stock arising from overproduction will reflect negatively in the costs of goods sold in the following period, potentially impro-ving the financial results.
The analyses presented up to here apply to companies in a general sense. In the next section, analyses related to the hypotheses outlined in this paper are presented, or, in other words, the relationship between earnings mana-gement via operating decisions and avoiding reporting losses in financial statements. In order to do so, a degree of signifance of 5% is used to accept or reject the hy-potheses made regarding the coefficients and the model validation tests.
4.2 Hypotheses Analysis
Table 4 shows the coefficients for Equations 4, 5, 6 and 7 that aim to test the hypotheses outlined in this paper. As well as the coefficients, validation tests for the estimatated models using panel datasets are presented. Random effects are fit into the four models and should be corrected by taking heteroscendasticity and/or auto-correlation into account. The coefficients for Equations 4, 5, 6 and 7 were estimated using the Stata® software and Generalized Least Squares (GLS), robust when faced with the problem of heteroscedasticity and/or autocor-relation.
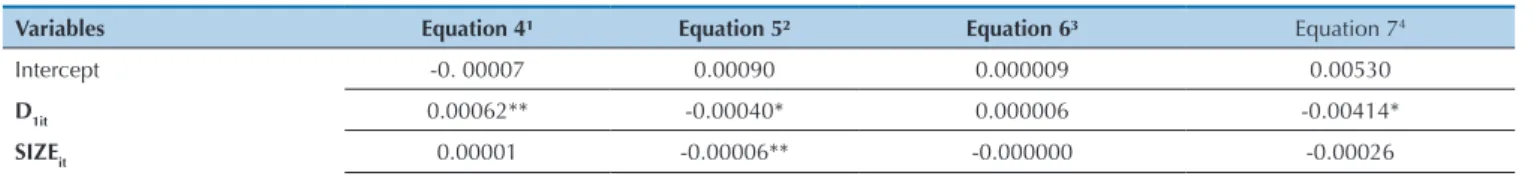
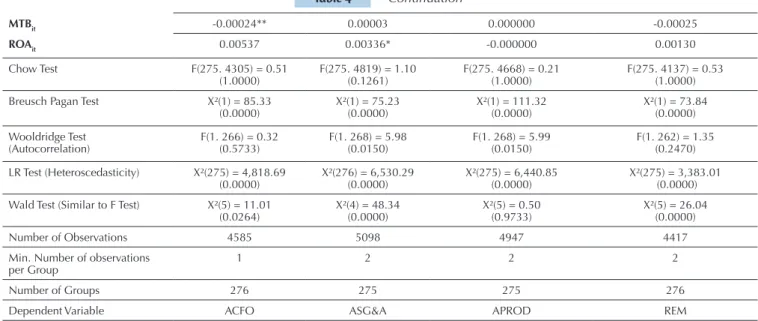
Table 4 Coefficients for Equations 4, 5, 6 and 7 – Tests for hypotheses 1 to 4
Variables Equation 4¹ Equation 5² Equation 6³ Equation 74
Intercept -0. 00007 0.00090 0.000009 0.00530
D1it 0.00062** -0.00040* 0.000006 -0.00414*
SIZEit 0.00001 -0.00006** -0.000000 -0.00026
Notes: * Signiicant to 1%, ** Signiicant to 5%. – Value of Probability given in brackets
CFO = Cash Flow from Operations; SG&A = Sales, General and Admin Expenses; PROD = Cost of Good Sold + Variation in Stocks, NR = Net Revenue; A = Assets; ∆NR = Variation in Net Revenue
¹Model Estimated by General Least Squares robust in Heteroscedasticity
²Model Estimated by General Least Squares robust in Heteroscedasticity and Autocorrelation
Source: Developed by the authors
Number of groups 289 289 289
Analysing the coefficients for Equation 4, it can be verified that abnormal levels of Cash Flow from Operations are not related with the companies’ Size or Return on Assets, for a 5% degree of significance. Unlike these two variables, the Market to Book in-dex contributes in increasing earnings management through cash flow from operations in order to im-prove financial results. This result may be related to managers having motives for manipulating financial statements, in order to increase capital market valu-ation for their company, and thus possibly raise their own renumerations and/or uphold their reputations among shareholders. This variable presents a negati-ve coefficient of 0.00024 and a 5% degree of signifi-cance, thus contributing to a negative ACFO.
The coefficient that contributes to addressing the first hypothesis, dummy 1, is shown to be statistically significant to a degree of 5%, but with a positive sign, in contrast to what is expected following on from research by Rodchowdhury (2006) and Cupertino (2013). From this it can be concluded that those com-panies that reported profit margins between 0% and 1% had an abnormally higher level of cash flow from operations than the other companies in the sample.
Despite the results of Roychowdhury (2006) going against those found in this study, it should be noted that in Brazil there may be particular circumstances, such as the tax environment, that differ to those of the North American market, and which might
discoura-Table 4 Continuation
Notes: * Signiicant to 1%, ** Signiicant to 5%. – Level of Probability given in brackets. ¹Estimated Model for Generalized Least Squares robust in Heteroscedsticity.
² Estimated Model for Generalized Least Squares robust in Heteroscedsticity and Autocorrelation. ³ Estimated Model for Generalized Least Squares robust in Heteroscedsticity and Autocorrelation.
4 Estimated Model for Generalized Least Squares robust in Heteroscedsticity.
Source: Developed by the authors.
ge such a strategy. Companies may be discouraged from offering sales price discounts in order to raise cash flow, since such a strategy could increase vo-lumes sold and, consequently, sales revenues and taxes would follow in line.
Thus, the first hypothesis, which states that tho-se companies which reported positive profit mar-gins close to zero had abnormally lower operating cash flow in relation to other Brazilian companies, should be rejected, as the evidence found contra-dicts this.
In the coefficients from Equation 5 aiming to test the second hypothesis, it can be seen that ab-normal levels of SG&A are not related with the Ma-rket to Book index. This is in contrast to the results documented by Roychowdhury (2006), Gunny (2010) and Zang (2012), in which all of the va-riables are significant, however is consistent with Cupertino (2013), in which the Market to Book in-dex is not significant.
The ROA variable appears to be statistically sig-nificant to a degree of 1%, thus contributing to a positive ASG&A and, consequently, reducing the extent of results management. This may be rela-ted to the fact that, the higher company returns are, the lower managers’ intentions to manipulate financial statements using this strategy. This result is similar to those found by Roychowdhury (2006), Zang (2012) and Cupertino (2013).
MTBit -0.00024** 0.00003 0.000000 -0.00025
ROAit 0.00537 0.00336* -0.000000 0.00130
Chow Test F(275. 4305) = 0.51
(1.0000) F(275. 4819) = 1.10 (0.1261) F(275. 4668) = 0.21 (1.0000) F(275. 4137) = 0.53 (1.0000) Breusch Pagan Test X²(1) = 85.33
(0.0000) X²(1) = 75.23 (0.0000) X²(1) = 111.32 (0.0000) X²(1) = 73.84 (0.0000)
Wooldridge Test
(Autocorrelation) F(1. 266) = 0.32 (0.5733) F(1. 268) = 5.98 (0.0150) F(1. 268) = 5.99 (0.0150) F(1. 262) = 1.35 (0.2470)
LR Test (Heteroscedasticity) X²(275) = 4,818.69
(0.0000) X²(276) = 6,530.29 (0.0000) X²(275) = 6,440.85 (0.0000) X²(275) = 3,383.01 (0.0000)
Wald Test (Similar to F Test) X²(5) = 11.01
(0.0264) X²(4) = 48.34 (0.0000) X²(5) = 0.50 (0.9733) X²(5) = 26.04 (0.0000)
Number of Observations 4585 5098 4947 4417
Min. Number of observations
per Group 1 2 2 2
Number of Groups 276 275 275 276
Dependent Variable ACFO ASG&A APROD REM
D1 = Dummy variable, taken as 1 for suspected companies (positive proit margin, between 0 and 1%), or otherwise 0.
SIZE = Size variable represented by the natural logarithm of total assets.
MTB = Market value of capital divided by net equity. ROA = Net proit divided by total assets.
ACFO = Abnormal value of Cash Flow from Operations. ASG&A = Abnormal value of Sales, General and Admin Expenses. APROD = Abnormal value of production level.
Furthermore, the size of the companies contri-butes to an increase in earnings management using SG&A. This variable has a negative coefficient with a 5% degree of significance, contributing to a negativeASGAE. This result is probably related to the ability of larger companies to better mana-ge the workforce, reduce admin expenses and pay sales staff and representatives lower commissions, among using other such strategies to their advan-tage. In other words, in order to achieve profit tar-gets, the results suggest that managers more easily make decisions related to lowering SG&A, thus avoiding reporting losses. This result is similar to that of Gunny (2010) and in contrast to Roycho-wdhury (2006), Zang (2012) and Cupertino (2013) in terms of the sign of the variable.
The coefficient which contributes to addressing the second hypothesis, dummy 1, was shown to be below zero, by -0.00040, and statistically signifi-cant by a degree of 1%. It can thus be concluded that those companies that reported profit margins between 0% and 1% reduced SG&A for their assets by 0.040% more than the other companies in the study. This result reveals the viability of impro-ving financial results using SG&A, given that this involves day to day decision making that is intrin-sic to management, such as managing the work-force and reducing superfluous expenses, among others.
These results are consistent with those found by Roychowdhury (2006), Gunny (2010) and Zang (2012) and contrary to Cupertino (2013). There-fore, given the statistical evidence found, the se-cond hypothesis in this paper, which states that those companies which disclosed positive profit margins close to zero reported abnormally lower SG&A, compared to the other Brazilian compa-nies, should not be disregarded.
The coefficients for Equation 6, which aim to test the third hypothesis, which states that tho-se companies suspected of managing earnings by using levelsof production do so more significan-tly than the other companies, do not turn out to be statistically different from zero. The Wild test, similar to the F test, calculates that the estima-ted coefficients are all statistically equal to zero. In other words, neither the coefficient to the in-terest variable, which addresses the hypotheses of this paper, nor the control variables, turn out to be significant.
Similarly, the coefficient which contributes to addressing the third hypothesis, dummy 1, does notturn out to be significant either, in contrast to the findings of Roychowdhury (2006), Gunny (2010), Zang (2012) and Cupertino (2013). That is, there is no relationship between avoiding dis-closing losses and earnings management through raising productions levels.
The different results for Brazilian companies, compared to American ones, may be due to the particular circumatances under which they opera-te, since, in order to engage in earnings manage-ment by means of production levels, more would need to be produced during one particular period, in order to take advantage of economies of scale, and stock would have to be adjusted in another period. Such a strategy can be used more regularly in a market with a tendency for consumption such as the North American one.
It is also worth noting that, in order to use this strategy and in doing so improve financial results, it would, for example, be necessary to increase in-vestment in order to achieve economies of scale. Such decisions normally require board or owner approval, alleviating the agency problem present in organizations, thus potentionally discouraging the use of this strategy.
Therefore, the third hypothesis in this paper, which states that those companies that reported positive profit margins close to zero, disclosed ab-normally high costs of production in relation to the other Brazilian companies, should be disregar-ded.
With relation to Equation 7, which aims to test the fourth hypothesis, and, consequently, verify whether those companies suspected of manipula-ting financial statements engaged in Real Earnin-gs Management on an abnormal level compared to the other Brazilian companies, the coefficients for the control variables were not significant to a degree of 5%, thus preventing any statistical infe-rence.
The coefficient which contributes to addres-sing the fourth hypothesis, dummy 1, turns out to be below zero, at -0.00414, and statistically signi-ficant to a degree of 1%, from which it can be con-cluded that those companies that disclosed profit margins between 0% and 1%, engaged in REM by 0.414% of assets more than the other companies studied. These results are consistent with those of Gunny (2010), Zang (2012) and Cupertino (2013). Therefore, the fourth hypothesis in this paper, which states that those companies that disclosed positive profit margins close to zero, engaged in Real Earnings Management, on a greater
scale than the other Brazilian companies, should not be disregarded.
5 FINAL CONCLUSIONS
The aim of this paper was to analyse data covering the years from 2008 to 2013 and verify whether, when faced with reporting negative results, Brazilian compa-nies listed on the BM&FBOVESPA used earnings mana-gement via operating decisions, in order to avoid disclo-sing losses. Accounting data for 289 companies was used in order to achieve this aim.
The hypotheses developed centred on three types of financial statement manipulation by means of operating decisions that is consolidated in international literature: manipulation of sales; overproduction; and the manipu-lation of SG&A.
The results show that, in contrast to what is found in international literature, those companies that disclo-sed profit margins between 0% and 1% reported higher cash flow from operations than the other companies in the sample. This may be due to the different conditions Brazilian companies are subject to compared to others internationally, such as the tax environment and the consumer market, and may have contributed to the di-vergence in results.
With relation to levels of production, those compa-nies that reported profit margins between 0% and 1% did not use this strategy to raise or lower accounting results. This form of management may be difficult to execute because of its complexity, since managers would have to be faced with a combination of levels of sales, levels and variation of stocks, and macroeconomic circumstances, among others, in order to carry it out.
However, the results suggest that those companies that reported profit margins between 0% and 1% did use SG&A in order to improve financial results and avoid disclosing losses. As has already been pointed out, there are several factors that could favour companies in their implementation of this strategy.
Just as in papers by Gunny (2010), Zang (2012) and Cupertino (2013), by using an aggregate measure of REM, the general strategy of earnings management via operating decisions is verified. The results show that those companies that reported profit margins between 0% and 1% used REM in order to improve financial re-sults and thus avoid disclosing losses. In other words, the companies appear to be concerned with achieving a target profit in the period in which they disclosed their financial statements.
This result may be linked especially to the way in whi-ch users of accounting information react to the disclo-sure of it. A loss might be seen as significant, especially among capital market participants. Managers would
the-refore be encouraged to engage in earnings management and avoid reporting losses in their financial statements.
Just as has been found for the North American ma-rket, earnings management via operating decisions in order to avoid disclosing losses has also been shown to be present in the Brazilian capital market. However, the results of this paper indicate that Brazilian companies only use SG&A in order to obtain this objective. Sin-ce this involves management taking less complex day to day decisions, it is believed to be easier for Brazilian companies to decrease or increase SG&A, in line with their interests, than to use strategies such as price dis-counts and/or increasing levels of production.
As the findings in this paper suggest, managers in Brazil are only able to alter operating activities through decreases in operating expenses (SG&A), due to a lack of flexibility in the production process and the cash flow restrictions faced by Brazilian companies. From a users’ standpoint, the evidence suggest that the companies do avoid disclosing losses to the capital market through real earnings management, as outlined by the Prospects Theory. Studies should still be carried out in order to verify the reactions of users to the disclosure of negative information, in order to reinforce future research based on this theory.
Despite these contributions, the statistical models used in this study, as well as in other, particularly inter-national literature, still need to be refined in order to im-prove the earnings management via operating decisions proxies (Siriviriyakul, 2013).
Future research could be developed taking into ac-count possible variables that are not included in the sta-tistical models used here. The model used to estimate the normal levels of CFO, for example, uses sales reve-nues as independent variables. Variables that represent cash outflows could be included in this model, since cash flow from operations is, in essence, the net result of cash inflows and outflows from operating activities. A corrected model would thus capture operational ma-nagement in both cash inflows and outflows. Similarly, in the model that measures company production levels, variables that may influence such levels, such as degree of economic activity and level of investment in produc-tion, among others, could be included.
Anderson, M. C., Banker, R. D., & Janakiraman, S. N. (2003). Are selling, general, and administrative costs “sticky”? Journal of Accounting Research, 41(1), 47-63.
Baptista, E. M. B. (2008). Análise do peril das empresas brasileiras segundo o nível de gerenciamento de resultados. Tese de doutorado, Universidade Federal do Rio Grande do Sul, Porto Alegre, RS. Burgstahler, D., & Dichev, I. (1997). Earnings management to avoid
earnings decreases and losses. Journal of Accounting and Economics, 24(1), 99-126.
Cohen, D. A., Dey, A., & Lys, T. Z. (2008). Real and accrual-based earnings management in the pre-and post-Sarbanes-Oxley periods. he Accounting Review, 83(3), 757-787.
Cohen, D. A., & Zarowin, P. (2010). Accrual-based and real earnings management activities around seasoned equity oferings. Journal of Accounting and Economics, 50(1), 2-19.
Cupertino, C. M. (2013). Gerenciamento de resultados por decisões operacionais no mercado de capitais brasileiro. Tese de doutorado, Universidade Federal de Santa Catarina, Florianópolis, SC.
Dechow, P. M., Kothari, S. P., & Watts, R. L. (1998). he relations between earnings and cash lows. Journal of Accounting & Economics, 25(2), 133-168.
Dechow, P. M., Richardson, S. A., & Tuna, I. (2003). Why are earnings kinky? Review of Accounting Studies, 8(2), 355-384.
Degeorge, F., Patel, J., & Zeckhauser, R. (1999). Earnings management to exceed thresholds. Journal of Business, 72(1), 1-33.
Fields, T. D., Lyz, T. Z., & Vincent L. (2001). Empirical research on accounting choice. Journal of Accounting and Economics, 31(1-3), 255-307.
Goncharov, I. (2005). Earnings management and its determinants: closing gaps in empirical accounting research. Europeans University Studies. Alemanha.
Goulart, A. M. C. (2007). Gerenciamento de resultados contábeis em instituições inanceiras no Brasil. Tese de doutorado, Universidade de São Paulo, São Paulo, SP.
Graham, J. R., Harvey, C. R., & Rajgopal, S. (2005). he economic implications of corporate inancial reporting. Journal of Accounting and Economics, 40 (1), 3-73.
Gunny, A. K. (2010). he relation between earnings management using real activities manipulation and future performance: Evidence from meeting earnings benchmarks. Contemporary Accounting Research, 27(3), 855-888.
Hayn, C. (1995). he information content of losses. Journal of Accounting and Economics, 20(2), 120-153.
Healy, P. M., & Wahlen. J. M. (1999). A review of the earnings management literature and its implications for standard setting. Accounting Horizons, 13(4), 365-383.
Martinez, A. L. (2001). Gerenciamento dos resultados contábeis: estudo
empírico das companhias abertas brasileiras. Tese de doutorado, Universidade de São Paulo, São Paulo, SP.
Martinez, A. L. (2009). Novo mercado, auditoria e o gerenciamento de resultados por escolhas contábeis e por decisões operacionais no Brasil. Anais do Congresso USP de Controladoria e Contabilidade, São Paulo, SP, Brasil, 9.
Martinez, A. L. (2013). Gerenciamento de resultados no Brasil: um survey da literatura. Brazilian Business Review, 10(4), 1-31.
Martinez, A. L., & Cardoso, R. L. (2009). Gerenciamento da informação contábil no Brasil mediante decisões operacionais. Revista Eletrônica de Administração, 15(3), 600-626.
Martins, G. A. (2007). Manual para elaboração de monograias e dissertações. (3. ed.). São Paulo: Atlas.
Nardi, P. C. C., & Nakao, S. H. (2009). Gerenciamento de resultados e a relação com o custo da dívida das empresas brasileiras abertas. Revista Contabilidade & Finanças, 20(51), 77-100.
Paulo, E. (2007). Manipulação das informações contábeis: uma análise teórica e empírica sobre os modelos operacionais de detecção de gerenciamento de resultados. Tese de doutorado, Universidade de São Paulo, São Paulo, SP.
Paulo, E., Martins, E., & Corrar, L. J. (2007). Detecção do gerenciamento de resultados pela análise do diferimento tributário. Revista de Administração Eletrônica, 47(1), 46-59.
Reis, E. M., Cunha, J. V. A., & Ribeiro, D. M. (2014). Análise do Gerenciamento de resultados por meio de decisões operacionais: estudo empírico nas empresas componentes do IBRX – Índice Brasil da BM&FBOVESPA. Advances in Scientiic and Applied Accounting, 7(2), 201-223.
Rey, J. M. (2012). Gerenciamento de resultados baseado em escolhas contábeis e por decisões operacionais: Estudo do impacto da lei Sarbanes-Oxley em empresas brasileiras emissoras de ADRS. Anais do Encontro da Associação Nacional de Pesquisa em Administração. Rio de Janeiro, RJ, Brasil, 36.
Richardson, R. J. (2012). Pesquisa social: métodos e técnicas. (3. ed.). São Paulo: Atlas.
Roychowdhury, S. (2006). Earnings management through real activities manipulation. Journal of Accounting and Economics, 42(3), 335-370. Siriviriyakul, S. (2013). Re-examining real earnings management to avoid
losses. [Working Paper]. University of California at Berkeley.
Vergara, S. C. (2003). Projetos e relatórios de pesquisa em administração. (4. ed.). São Paulo: Atlas.
Verhagem, J. A., Santos, P. S. A., & Bezerra, F. A. (2011). Gerenciamento de resultados contábeis por meio de decisões operacionais e a governança corporativa: análise nas indústrias siderúrgicas e metalúrgicas. Revista de Contabilidade e Organizações, 5(13), 55-74. Zang, A. Y. (2012). Evidence on the tradeof between real manipulation and accrual manipulation. he Accounting Review, 87(2), 675-703.
References
Correspondence Adress:
Elizio Marcos dos Reis
Faculdade de Ciências Econômicas, Universidade Federal de Minas Gerais
Avenida Antônio Carlos, 6627 – Reitoria, Sala 5022 – CEP: 31270-901 Pampulha – Belo Horizonte – MG