THIS DOCUMENT IS NOT AN INVESTMENT RECOMMENDATION AND SHALL BE USED
EXCLUSIVELY FOR ACADEMIC PURPOSES (
SEE DISCLOSURES AND DISCLAIMERS AT END OF DOCUMENT)See more information at WWW.NOVASBE.PT Page 1/39
M
ASTERS IN
F
INANCE
E
QUITY
R
ESEARCH
We recommend buying Galp Energia given our FY12 target price of €15.17 per share, corresponding to an overall return of 23% given current price levels.
The company’s focus in the upstream segment (E&P) is more than justified as a result of current discoveries in Brazil and Mozambique. With the expected increase in demand of oil and natural gas, the strategy shift towards E&P strengthens Galp Energia’s growing opportunities. Although debatable, the partnership with Sinopec is perceived as positive, reducing many financing needs.
Developments in the R&M segment suggest a slowdown in the segment. Overall lower refining margins and projected negative conditions for the following years imply a lower value. Fortunately, the completion of the conversion project by 2012 greatly improves competitiveness given Europe’s preference for middle distillates.
Despite suffering slightly due to the lower growth expectations in the Iberian market, the G&P segment remains fairly stable. Possibility of selling part of the regulatory asset base was postponed as the company managed to establish a partnership with Sinopec, increasing capital by $4.8 billion.
Company description
Galp Energia operates under the energy sector, with activities in three different segments: Exploration & Production (E&P); Refining and Marketing (R&M); Gas and Power (G&P). With a current focus on the upstream segment, Galp is pursuing major developments in Brazil. Investment in the conversion project reinforced R&M competitiveness and potential. With a large portion of regulated activities in G&P, Galp Energia comprises and highly valued portfolio of operations.
GALP ENERGIA
COMPANY REPORT
OIL & GAS
6
J
ANUARY2012
S
TUDENT
:
F
ERNANDO
M
ARTINS
[email protected]
After the Dawn
Growth opportunities in the upstream segment
Recommendation: BUY
Vs Previous Recommendation BUY
Price Target FY12: 15.17 €
Vs Previous Price Target 15.17 €
Price (as of 6-Jan-12) 12.37 €
Reuters: GALP.LS, Bloomberg: GALP PL
52-week range (€) 11.26-16.97
Market Cap (€m) 10,253.68
Outstanding Shares 829,250,635
Source: Bloomberg
Source: Euronext
(Values in € millions) 2010 2011E 2012E
Revenues 14,226 16,425 15,169
EBITDA 1,053 1,060 987
EBIT 639 627 547
Net Income 441 361 268
EPS 0.52 0.58 0.51
P/E 29.80 26.69 30.18
EV/Sales 1.48 1.28 1.39
EV/EBITDA 19.99 19.85 21.33
Net Debt/Equity 1.12 0.59 0.56
EBITDA/Interest Expenses 10.72 8.99 6.34
ROIC 8.39% 6.43% 5.54%
Source: Galp Energia, Analyst estimates 65%
75% 85% 95% 105%
Jul-11 Aug-11 Sep-11 Oct-11 Nov-11 Dec-11
C
um
ul
at
iv
e
R
e
tur
n
Galp Energia vs PSI20
GALP ENERGIA COMPANY REPORT
THIS DOCUMENT IS NOT AN INVESTMENT RECOMMENDATION AND SHALL BE USED
EXCLUSIVELY FOR ACADEMIC PURPOSES (
SEE DISCLOSURES AND DISCLAIMERS AT END OF DOCUMENT)PAGE 2/39
Table of Contents
VALUATION ... 3
SENSITIVITY ANALYSIS ... 6
COMPANY OVERVIEW ... 7
COMPANY DESCRIPTION ... 7
SHAREHOLDER STRUCTURE ... 8
EXPLORATION & PRODUCTION ... 9
MARKET OVERVIEW ... 9
BRAZIL ... 11
ANGOLA ... 14
MOZAMBIQUE & OTHERS ... 15
VALUATION ... 16
REFINING & MARKETING ...17
MARKET OVERVIEW ... 17
REFINING ... 19
MARKETING ... 20
VALUATION ... 22
GAS & POWER ...22
MARKET OVERVIEW ... 22
LIBERALISED NG ... 23
REGULATED NG ... 25
VALUATION ... 26
POWER ... 27
VALUATION ... 28
FINANCIALS ...28
ALTERNATIVE SCENARIO ...29
SCENARIO OVERVIEW... 29
EFFECT ON GALP ENERGIA ... 31
APPENDIX ...33
APPENDIX 1:COMPARABLES ... 33
APPENDIX 2:TRANSACTIONS ... 34
APPENDIX 3:EUROPEAN FUEL PRICES... 35
APPENDIX 4:OECDSOVEREIGN DEBT AND DEFICIT... 36
FINANCIAL STATEMENTS ...37
GALP ENERGIA COMPANY REPORT
THIS DOCUMENT IS NOT AN INVESTMENT RECOMMENDATION AND SHALL BE USED
EXCLUSIVELY FOR ACADEMIC PURPOSES (
SEE DISCLOSURES AND DISCLAIMERS AT END OF DOCUMENT)PAGE 3/39
Valuation
We value Galp Energia through a Sum-of-the-parts (SOTP) approach in which we analyse each segment in detail. To further complement this analysis, we formulate two possible scenarios: the base scenario where each segment is valued in accordance to the most probable evolution of its value drivers; the worse scenario in which we attempt to address the impact caused by Portugal’s exit from the Euro, followed by recession. The later scenario is attributed a 5% probability given our personal beliefs about the sovereign debt crisis and it should be regarded as a perception of the major risks associated with Galp Energia’s operations. Valuation of the E&P segment was achieved through an appraisal of the core extraction fields (or blocks) in which Galp Energia operates. We relied on an adjusted present value (APV) model to take into account both unlevered financial cash flows that were discounted at the unlevered cost of equity and the tax shield/bankruptcy costs which were discounted at the cost of debt. This method is more appropriate than existing alternatives since the capital structure associated with such projects is not constant over time. Moreover, the level of debt existing in comparable projects allows us to fairly project interest payments over the project’s life. Despite several uncertainties one can reach a plausible assessment of such fields by having access to the amount of recoverable reserves. Based on the level of reserves, one begins by estimating the necessary extraction rate to meet the average life time of 25 years per field. Given the extraction rate of the equipment required in such operations (i.e.: FPSOs1, wells, pipes, drills, maintenance) and released information on the projected plan for certain fields, we formulate an opinion on the number of FPSOs and wells that have to be acquired, providing a solid idea of future capital expenditures and production. Through an application of an average rate of decay in extraction after reaching peak production2, we tune the overall estimation. Based on lifting cost forecasts and F&D3 costs we determine both operational costs and D&A4. After considering the existing taxation and determining average levels of working capital (which aren’t very significant in the E&P activity), we achieve overall cash flow. Bankruptcy costs in this activity were not estimated due to the complexity of
1 Floating Production Storage and Offloading.
2 Hubbert peak theory - Oil/Natural Gas production is bell shaped, consistently declining after reaching peak production. Empirical assessment defends this theory: Herrmann, Lucas. Dunphy, Elaine. Copus, Jonathan. 2010. “The Life Cycle of a Basin” in Oil & Gas for Beginners, Deutsche Bank, pages 45-50.
3 Finding and Development costs – All costs incurred until the beginning of the extraction process.
4 Depreciation and amortization – includes both depreciation of equipment and reserves. Reserves are accounted according to F&D costs and are depreciated in accordance to the percentage of extracted reserves.
Valuation of E&P was achieved through an appraisal of the core extraction fields.
The APV model is better suited for field valuation due to flexible capital structures.
With access to the amount of recoverable reserves one can reach a plausible assessment
of the field’s value.
GALP ENERGIA COMPANY REPORT
THIS DOCUMENT IS NOT AN INVESTMENT RECOMMENDATION AND SHALL BE USED
EXCLUSIVELY FOR ACADEMIC PURPOSES (
SEE DISCLOSURES AND DISCLAIMERS AT END OF DOCUMENT)PAGE 4/39 its estimation and the low probability of default. Due to the globalism of oil markets, upstream activities have shown great resilience and the current capital increase by Sinopec further reduced the chances of such event. Alternative segments were valued through a WACC model based on a 10 year implicit period and a final terminal value achieved through assumptions on the ability to attain real growth. R&M was analysed separately by taking into consideration particular key drivers: refining margins, utilization rates and future policies were essential at determining the value of refining activity, while marketing based itself on expectations of economic growth and disposable income. Finally, the G&P segment was split into regulated activities under the Natural Gas (NG) sector, liberalized commercialization and power. The liberalized activity depends highly on future operating margins and total sales; the regulated activity is mostly based on future regulatory actions and the power segment was assessed through an analysis of megawatt production capacity. The computation of the cost of capital5 was achieved through a compilation of comparables for each segment (appendix 1). This information allowed us to compute the average unlevered beta for each of the segments, followed by the leveraging under Galp Energia’s market debt -to-equity ratio. The levered cost of -to-equity was determined through the application of the CAPM6 model under a 6% market premium, in accordance with relevant financial literature7. Cost of debt consists on the effective interest rate, and it was achieved based on the market yield of comparables with similar rating and historical default rates/recovery rates8. Since Galp Energia does not possess rating we relied on the current market perception of companies such as Portugal Telecom and EDP, granting Galp Energia a similar BBB/BB rating. Due to the assumptions of the CAPM model, only systematic risk should be present in the cost of capital. As such, when evaluating country risk we determined the beta for each country based on the country’s market index or a proper comparable9. Finally, since all of our cash flows are denominated in EUR, we used the German 10y Treasury bond as a proxy for the risk-free rate. These cash flows were
5
6 Capital Asset Pricing Model – Only the systemic risk is relevant since everything else can be diversified. The required rate of return follows the expression: where systemic risk is represented by beta.
7 Mehra, Rajnish. Prescott, Edward C. 1985.”The Equity Premium: A Puzzle.” Harris, Robert S. Marston, Felicia C. 1999. “The Market Risk Premium: Expectational Estimates Using Analysts’ Forecasts.”
Fama, Eugene F. French, Kenneth R. 2002. “The Equity Premium.”
8
, y denotes the market yield, Pd denotes de probability of default and RR the recovery rate. Pd for Galp Energia is 4.52% given the probabilities associated with BBB and BB rated bonds. The recovery rate is 70.73% which constitutes an average weigthed by the recovery rate of bank loans and bonds.
Moody’s Investors Service. February 2009. “Corporate Default and Recovery Rates, 1920-2008.”
9
The beta was determined in accordance with:
. The S&P1200 Global was used a proxy for the global market and
the correlation is assumed to be one since under periods of recession correlations tend to increase.
Probability of bankruptcy in
the E&P segment is
practically inexistence given the current capital increase by
Sinopec and the company’s
ability to sell its holdings.
R&M and G&P were valued through a WACC model with a 10 year implicit period (from 2011-2020).
Each activity was judged in accordance to specific value drivers.
Cost of capital was
determined by unlevering the beta of comparables. Cost of debt was computed as a function of market yields on
similar rated companies,
along with historical
GALP ENERGIA COMPANY REPORT
THIS DOCUMENT IS NOT AN INVESTMENT RECOMMENDATION AND SHALL BE USED
EXCLUSIVELY FOR ACADEMIC PURPOSES (
SEE DISCLOSURES AND DISCLAIMERS AT END OF DOCUMENT)PAGE 5/39 converted based on forward exchange rates up until 2035. All rates are presented in nominal terms (including the terminal growth rate) with an implicit long-term inflation rate of 2%.
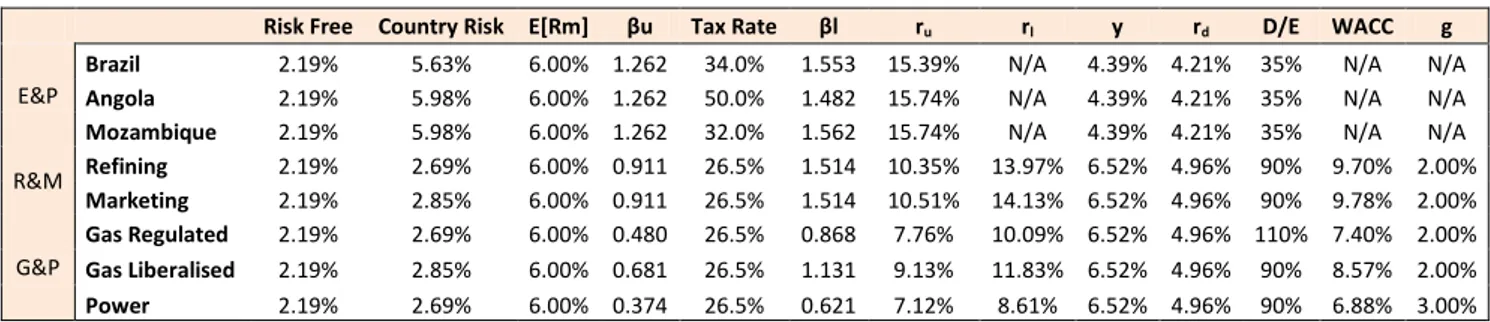
Figure 1: Discount rates and terminal growth
Risk Free Country Risk E[Rm] βu Tax Rate βl ru rl y rd D/E WACC g
E&P
Brazil 2.19% 5.63% 6.00% 1.262 34.0% 1.553 15.39% N/A 4.39% 4.21% 35% N/A N/A
Angola 2.19% 5.98% 6.00% 1.262 50.0% 1.482 15.74% N/A 4.39% 4.21% 35% N/A N/A
Mozambique 2.19% 5.98% 6.00% 1.262 32.0% 1.562 15.74% N/A 4.39% 4.21% 35% N/A N/A
R&M Refining 2.19% 2.69% 6.00% 0.911 26.5% 1.514 10.35% 13.97% 6.52% 4.96% 90% 9.70% 2.00%
Marketing 2.19% 2.85% 6.00% 0.911 26.5% 1.514 10.51% 14.13% 6.52% 4.96% 90% 9.78% 2.00%
G&P
Gas Regulated 2.19% 2.69% 6.00% 0.480 26.5% 0.868 7.76% 10.09% 6.52% 4.96% 110% 7.40% 2.00%
Gas Liberalised 2.19% 2.85% 6.00% 0.681 26.5% 1.131 9.13% 11.83% 6.52% 4.96% 90% 8.57% 2.00%
Power 2.19% 2.69% 6.00% 0.374 26.5% 0.621 7.12% 8.61% 6.52% 4.96% 90% 6.88% 3.00%
Source: Analyst estimates
After achieving the enterprise value for each area, we subtracted all non-equity claims in order to obtain the market capitalization of Galp Energia. Such claims include interest bearing debt (at market value), pension shortfalls and minorities. Book value of interest bearing debt was determined based on expectations over total assets and equity. With the book value of debt, the interest expenses and the average maturity of debt, we determined the debt’s market value10. Pension shortfalls were estimated in accordance with Galp Energia’s forecast and historical data. Minorities consist in portions of our assets held by others which were valued as a percentage of attained enterprise value.
Figure 2: Fair value of Galp Energia
Base Scenario (P=95%) Worst Scenario (P=5%) Expected Value
Fair Value € per Share Fair Value € per Share Fair Value € per Share
+ E&P 14,361.82 € 17.32 € 11,670.14 € 14.07 € 14,227.24 € 17.16 €
+ R&M 3,477.07 € 4.19 € 2,114.80 € 2.55 € 3,408.95 € 4.11 €
+ G&P 3,208.78 € 3.87 € 2,569.08 € 3.10 € 3,176.80 € 3.83 €
- Net Debt FY11e 3,821.89 € 4.61 € 3,811.13 € 4.60 € 3,821.35 € 4.61 €
- Pension Fund and Health Care FY12e 301.57 € 0.36 € 299.23 € 0.36 € 301.45 € 0.36 €
- Minorities FY12e 4,149.27 € 5.00 € 3,384.35 € 4.08 € 4,111.02 € 4.96 €
Sinopec 3,832.11 € 4.62 € 3,095.52 € 3.73 € 3,795.28 € 4.58 €
Beiragás 26.00 € 0.03 € 24.64 € 0.03 € 25.94 € 0.03 €
Lusitaniagás 48.93 € 0.06 € 46.37 € 0.06 € 48.81 € 0.06 €
Setgás 94.50 € 0.11 € 89.56 € 0.11 € 94.25 € 0.11 €
Tagugás 52.06 € 0.06 € 49.33 € 0.06 € 51.92 € 0.06 €
Wind Power 95.66 € 0.12 € 78.92 € 0.10 € 94.83 € 0.11 €
= Galp Energia 12,774.94 € 15.41 € 8,859.31 € 10.68 € 12,579.16 € 15.17 €
Source: Analyst estimates
10
The market value of debt was determined as:
, y denotes the market
GALP ENERGIA COMPANY REPORT
THIS DOCUMENT IS NOT AN INVESTMENT RECOMMENDATION AND SHALL BE USED
EXCLUSIVELY FOR ACADEMIC PURPOSES (
SEE DISCLOSURES AND DISCLAIMERS AT END OF DOCUMENT)PAGE 6/39
Sensitivity Analysis
Given the inherent uncertainties in any possible valuation, sensitivity analysis is extremely useful in understanding the effect of wrongful estimation. Galp Energia’s activity is strongly reliant on future exchange rates (€/USD) along with Brent price movements. Since we considered a series of Brent prices over the next years, we performed an analysis through an overall % increase of the base scenario. The sensitivity range was selected in accordance with either the past average growth rates, the standard deviation of growth rates or a particular individual expectation. Both the exchange rate and Brent prices have a significant impact on the share price. Since many products are priced and traded in dollars, a decrease in the rate implies a depreciation of the euro, and dollar results now yield greater value in Euros. Brent prices seem to display a positive relationship given the weight of the E&P segment and the ability to transfer refining costs onto customers.
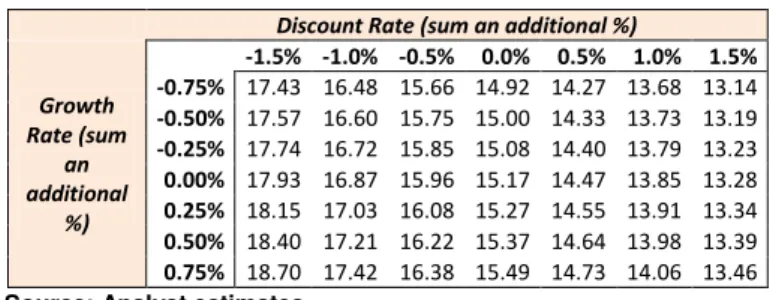
Furthermore, due to the importance of the discount rate that is used to discount all future cash flows, measuring the impact of possible miss estimations is crucial. For this purpose we increased the relevant discount/growth rates by a certain percentage (i.e.: 1% corresponds to a movement from 9% to 10% in the rate). We conclude that share prices could vary between €15.80 and €14.69, displaying a certain resistance at mistakes ranging around 1%.
Related to the operational activity, we analysed the impact of the utilization rate and the refining margin on the R&M segment. The refining margin has proved to be much more volatile, with variations of 30% in certain years. Large changes in the margin impact the price significantly since the company requires a decent margin to cover fixed costs, salaries and other costs.
Finally, to perceive the implication of regulation risk we varied the possible remuneration rates for both the storage and distribution of natural gal. The results were fairly predictable given the small size of the segment. Little change occurs to the value of Galp Energia removing us from any in-depth analysis of regulatory behaviour when estimating future remuneration rates.
Brent Prices (increase prices by %)
Exchange Rate (increase exchange rate by %)
15.17 -15.0% -10% -5.0% 0% 5.0% 10% 15.0%
-7.5% 14.33 14.88 15.44 16.00 16.56 17.13 17.69
-5.0% 14.08 14.62 15.16 15.71 16.26 16.81 17.36
-2.5% 13.85 14.37 14.90 15.43 15.97 16.50 17.04
0% 13.62 14.14 14.65 15.17 15.69 16.21 16.74
2.5% 13.41 13.91 14.41 14.92 15.43 15.94 16.45
5.0% 13.21 13.70 14.19 14.68 15.18 15.67 16.17
7.5% 13.02 13.49 13.97 14.45 14.94 15.42 15.91
Discount Rate (sum an additional %)
Growth Rate (sum
an additional
%)
15.17 -1.5% -1.0% -0.5% 0.0% 0.5% 1.0% 1.5%
-0.75% 17.43 16.48 15.66 14.92 14.27 13.68 13.14
-0.50% 17.57 16.60 15.75 15.00 14.33 13.73 13.19
-0.25% 17.74 16.72 15.85 15.08 14.40 13.79 13.23
0.00% 17.93 16.87 15.96 15.17 14.47 13.85 13.28
0.25% 18.15 17.03 16.08 15.27 14.55 13.91 13.34
0.50% 18.40 17.21 16.22 15.37 14.64 13.98 13.39
0.75% 18.70 17.42 16.38 15.49 14.73 14.06 13.46
Refining Margin (increase the refining margin by %)
Utilization Rate (increase utilization rate by %)
15.17 -6% -4% -2% 0% 2% 4% 6%
-30% 14.06 14.04 14.02 14.00 13.98 13.96 13.94
-20% 14.44 14.42 14.40 14.39 14.37 14.36 14.34
-10% 14.81 14.80 14.79 14.78 14.77 14.76 14.74
0% 15.19 15.18 15.18 15.17 15.16 15.15 15.15
10% 15.57 15.57 15.56 15.56 15.56 15.55 15.55
20% 15.95 15.95 15.95 15.95 15.95 15.95 15.95
30% 16.32 16.33 16.33 16.34 16.35 16.35 16.36
Distribution Rate of Return
Storage Rate of Return
15,17 8% 9% 10% 8% 15.03 15.17 15.30
9% 15.03 15.17 15.31
10% 15.04 15.17 15.31
Source: Analyst estimates
Source: Analyst estimates Figure 3: Price/Exchange rate sensitivity
Figure 5: Utilization rate/Refining margin sensitivity
Figure 6: Regulation sensitivity
Figure 4: Discount rate/Growth rate sensitivity
GALP ENERGIA COMPANY REPORT
THIS DOCUMENT IS NOT AN INVESTMENT RECOMMENDATION AND SHALL BE USED
EXCLUSIVELY FOR ACADEMIC PURPOSES (
SEE DISCLOSURES AND DISCLAIMERS AT END OF DOCUMENT)PAGE 7/39
Company overview
Company description
Galp Energia was founded in April 1999 with the purpose of operating in the oil and natural gas business. The company originated from the merger between Petróleos de Portugal (Petrogal) and Gás de Portugal (GDP), caused by the restructuring of the Portuguese energy sector. It currently operates under three different segments: Exploration & Production (E&P), Refining & Marketing (R&M) and Gas & Power (G&P).
Despite its foundation in the downstream sector it expanded to the upstream sector, with E&P of petroleum and natural gas across 43 worldwide projects. It is present in 8 countries but operations are mostly focused in Africa and Brazil. Production began in Angola and expanded to Brazil as a result of the major findings in the Lula (Tupi) field. Most investments and findings occurred in these locations, with the exception of Mozambique where a giant gas discovery took place. With up to 7.5 Tcf of natural gas, Mozambique quickly became a priority and front end activities are already being taken by the field’s operator (Eni). E&P is regarded as the segment with the highest growth opportunities, allowing the company to profit from the continuous increase in oil prices. Moreover, it hedges Galp Energia’s refining operations against price movements and diversifies many of the regional risks adjacent to the Iberian market (mainly the current European sovereign debt crisis). The decision to focus its strategy in this segment was influenced by highly renowned integrated companies (i.e.: Total, Chevron, BP, Shell) which demonstrated high profitability. Moreover, the company’s downstream operations facilitated its entry into E&P.
Refining takes place in Portugal in the Sines and the Matosinhos refineries. The Sines refinery is capable of processing 220kbbl/d and Matosinhos 90kbbl/d. The average worldwide capacity in the refining industry is 140kbbl/d, implying that the Sines refinery is significantly bigger than the average, while Matosinhos is smaller. Both refineries have been subject to a conversion project that converts heavier crude oil into medium and light distillates and further boosts capacity by 20kbbl/d. The conversion project has been completed in Matosinhos (July 2011) and Sines is expected to complete on the 2nd quarter of 2012. Marketing is comprised by retail and wholesale of refined products throughout the Iberian Peninsula, taking advantage of Galp Energia’s major logistics network. Expansion to African markets has proven to be wise, with apparent growth.
Region # of
Refineries
Average Capacity (kbbl/d)
Afria 42 79.73
Asia 151 175.82
Europe 148 152.49
North America 185 128.01
South America 58 113.50
Oceania 10 99.00
World 594 140.94
Galp Energia
E&P
Angola
Brazil
Others
R&M
Refining
Marketing G&P
Liberalised Gas
Regulated Gas
Power
Sourcing
Liberalised
•Natural Gas Import
Infrastructure
Regulated
•Transport
•Regaseification
•Storage
•distribution
Marketing
Liberalised Regulated
•Electricity Producers
•Industrial clients
•Commercial and Residential clients
Figure 9: Natural gas activity Figure 7: Galp Energia segmentation
Source: Galp Energia Source: Galp Energia
Figure 8: Refineries across the world (2011)
GALP ENERGIA COMPANY REPORT
THIS DOCUMENT IS NOT AN INVESTMENT RECOMMENDATION AND SHALL BE USED
EXCLUSIVELY FOR ACADEMIC PURPOSES (
SEE DISCLOSURES AND DISCLAIMERS AT END OF DOCUMENT)PAGE 8/39 The Gas segment contains liberalised and regulated activities. Regulation focuses mainly in the distribution and storage of natural gas while supply is fully liberalised. Commercialization is both regulated and liberalized with market deregulation taking place up until 2013. The Power segment is by far the smallest portion of Galp, with a cogeneration capacity of 160MW. This shall be increased by 80MW with the completion of Matosinhos cogeneration facility. Galp is also participating in the wind power generation through an increase in a project which is expected to boost capacity by 200MW along with participation in Vale Grande.
Shareholder structure
Amorim Energia and Eni each hold 33.34% of total shares, representing the main shareholders of Galp Energia. The Portuguese State holds a total of 8%, 7% directly through Parpública and 1% indirectly through Caixa Geral de Depósitos (CGD). The remaining 25.32% constitute Free-Float which has been listed for trading on Euronext Lisbon since 23 October 2006.
Until 31 December 2014 Amorim Energia, Eni and CGD are included in a shareholder agreement, which establishes a set of aspects related to the terms for disposal of the shares they hold. The agreement covered the parties' obligation to keep their holdings for a lock-in period and each party may only sell its holdings in a single tranche. During 2011 Eni expressed its intention of selling its position. This did not come to occur due to the aggravation of the Portuguese political crises and the failure at negotiation with Petrobras (that only wished to acquire 25% and not the entire 33.34%). As a result, Eni declared it had no rush on selling its position but maintains its negotiations with interested parties. On a different note, Sonangol displayed interest in increasing its participation in Galp Energia. This did not take place due to difficult negotiations and political issues, in which the Portuguese government opposed a predominant position held by Angolan entities. Currently, the Angolan indirect participation is achieved through a 45% holding in Amorim Energia named Esperanza. The stakeholders of this holding are Sonangol and Isabel dos Santos.
Until the end of 2011 CGD will be selling its holdings according to the Portuguese budgeting strategy but no further information on potential buyers has been released. Discussions between Amorin, Eni and CGD regarding the selection of administration yielded no results and the position of chairman still hasn’t been filled.
33,34%
33,34% 25,32%
7,00% 1,00%
Amorim Energia Eni
Free-float Parpública
Caixa Geral de Depósitos
Graph 1: Shareholder structure (5th November 2011)
GALP ENERGIA COMPANY REPORT
THIS DOCUMENT IS NOT AN INVESTMENT RECOMMENDATION AND SHALL BE USED
EXCLUSIVELY FOR ACADEMIC PURPOSES (
SEE DISCLOSURES AND DISCLAIMERS AT END OF DOCUMENT)PAGE 9/39
Exploration & Production
Market Overview
Ever since mankind developed society as we know it energy became one of the most indispensible goods in sustaining and offering proper living conditions. Over time demand for energy has consistently grown, displaying a tight connection with economic growth11 (US economy displays a 93.4% correlation between GDP and energy consumption). It is without surprise that developed economies display much higher energy consumption than the opposed developing economies. Since 2000 developing economies began exhibiting higher real GDP growth than advanced economieswhich boosted energy requirements in these countries. Future expectations of economic growth are positive, mostly fueled by developing economies such as China, India, Middle East and Latin America. According to OPEC12 this growth results in an annual energy demand increase of 1.6%, leading world energy demand from 235.4 Mboe/d13 in 2010 to 355.9 Mboe/d in 2035. Out of this amount, approximately 82% of energy demand in 2035 will correspond to fossil fuels.
Oil demand grows at a slower rate of 0.95%, going from 86.8Mb/d14 in 2010 to 109.7Mb/d in 2035. Other sources of energy include coal (1.6% p.a.15), gas (2% p.a.), nuclear (1.7% p.a.), hydro (2.3% p.a.), biomass (3.3% p.a.) and other renewables (7.5% p.a.). Despite the overall positive growth in demand, developed economies are expected to reduce their oil demand from 46.1Mb/d to 41.9Mb/d (offset by an increase of 27.1Mb/d in developing and transitioning economies). Although debatable, the reduction in oil consumption can easily be understood when we analyze the major sectors in which oil is used.
Sectors include road transportation, aviation, petrochemicals, industry, electricity generation and others. As expected, road transportation is the sector which contributes the most towards oil needs. Due to assumed technological improvements in transportation and a saturation effect that has become apparent in developed countries, the need for oil products mostly in Europe and North
11Fatai, K. Oxley, Les. Scrimgeour, F. “Modelling the Causal Relationship between Energy Consumption and GDP in New Zealand, Australia, India, Indonesia, the Philippines and Thailand.”
Frontier Economics. May 2007. “The association between unexpected changes in electricity volume and GDP growth for residential customers.”
12
OPEC. November 2011. “World Oil Outlook 2011”.
13
Million barrels of oil equivalent per day (standardized measure of energy).
14
Million barrels of oil. 15 Annual growth rate.
Demand (Mb/d)
Region 2010 2035
North America 23.9 22.3
Western Europe 14.5 12.9
OECD Pacific 7.8 6.7
Developed Economies 46.1 41.9
Latin America 5.2 6.8
China 8.9 18.4
OPEC 8.1 12.5
Russia 3.1 3.4
Other 15.2 26.7
Developing Economies 40.5 67.8
World 86.6 109.7
Demand (Mb/d)
Sector 2010 2035
Road transportation 34.2 43.3
Aviation 5.2 7.0
Waterways/rail 1.9 2.9
Marine bunkers 3.5 6.5
Petrochemicals 8.1 10.5
Other industry 14.5 16.1
Residl/commer/agric 9.3 11.3
Electricity Generation 5.4 5.0
Other 4.5 7.1
World 86.6 109.7
-4% 0% 4% 8% 12%
2000 2003 2006 2009 2012E 2015E
World
Emerging and developing economies
Advanced economies
Graph 2 - Real GDP growth
Source: International Monetary Fund
Figure 10: Oil demand by region
Figure 11: Oil demand per sector Source: OPEC World Oil Outlook 2011
GALP ENERGIA COMPANY REPORT
THIS DOCUMENT IS NOT AN INVESTMENT RECOMMENDATION AND SHALL BE USED
EXCLUSIVELY FOR ACADEMIC PURPOSES (
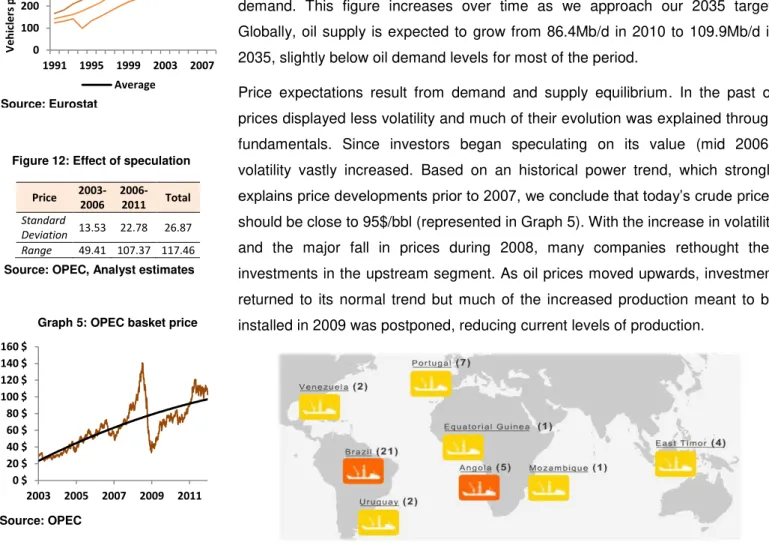
SEE DISCLOSURES AND DISCLAIMERS AT END OF DOCUMENT)PAGE 10/39 America is diminishing. Vehicles are evermore capable of covering larger distances with lower amounts of fuel16. Moreover, research into hybrid and plug-in vehicles, electric vehicles and hydrogen fuel cells further support this result. Other sectors in developed economies either display a similar tendency of less oil dependency or stable oil requirements. Developing countries benefit from the same efficiency improvements but do not suffer from the saturation effect. Per capita measures indicate that most developing regions display less than 40 cars per 1000 people, contrasting with over 400 cars per 1000 people in developed regions. As a result, a major increase in cars is expected, following a huge requirement for oil products. Similarly, other sectors are also growing and energy is demanded. To face this increase in demand, several projects are expected to take place and oil supply is projected to increase through both conventional and unconventional sources. According to OPEC a total of €110B of investment in upstream will be required from 2011 to 2015 in order to sustain the increase in demand. This figure increases over time as we approach our 2035 target. Globally, oil supply is expected to grow from 86.4Mb/d in 2010 to 109.9Mb/d in 2035, slightly below oil demand levels for most of the period.
Price expectations result from demand and supply equilibrium. In the past oil prices displayed less volatility and much of their evolution was explained through fundamentals. Since investors began speculating on its value (mid 2006), volatility vastly increased. Based on an historical power trend, which strongly explains price developments prior to 2007, we conclude that today’s crude prices should be close to 95$/bbl (represented in Graph 5). With the increase in volatility and the major fall in prices during 2008, many companies rethought their investments in the upstream segment. As oil prices moved upwards, investment returned to its normal trend but much of the increased production meant to be installed in 2009 was postponed, reducing current levels of production.
16 An, Feng. Sauer, Amanda. 2004. “Comparison of Passenger Vehicle Fuel Economy and Green House Gas Standards Around the World.”
Price
2003-2006
2006-2011 Total
Standard
Deviation 13.53 22.78 26.87 Range 49.41 107.37 117.46
-10,0% -5,0% 0,0% 5,0% 10,0% 15,0%
1950 1965 1980 1995 2010
Energy Consumption
Real GDP
0 100 200 300 400 500 600 700
1991 1995 1999 2003 2007
V
e
hi
cl
e
rs
pe
r
1000 (pe
r
capi
ta)
Average
t t
l
0 $ 20 $ 40 $ 60 $ 80 $ 100 $ 120 $ 140 $ 160 $
2003 2005 2007 2009 2011
Graph 3: Energy Consumption and real GDP growth causality (USA)
Source: EIA, Bureu of Economic Analysis
Graph 4: Vehicles per capita (Europe)
Source: Eurostat
Figure 12: Effect of speculation
Source: OPEC, Analyst estimates
Graph 5: OPEC basket price
GALP ENERGIA COMPANY REPORT
THIS DOCUMENT IS NOT AN INVESTMENT RECOMMENDATION AND SHALL BE USED
EXCLUSIVELY FOR ACADEMIC PURPOSES (
SEE DISCLOSURES AND DISCLAIMERS AT END OF DOCUMENT)PAGE 11/39 The overall increase in oil demand combined with the postponement of upstream investment strongly justifies Galp Energia’s presence in the Exploration and Production segment, across 8 countries and with a total of 48 projects. Production only takes place in Angola and Brazil characterizing them as core areas of Galp Energia’s strategy. The company’s main goal is to reach a production of 70kboepd17 by 2015 and 300kboepd by 2020 (contrasting with its previous goal of 200kboepd). This goal represents nothing more than the company’s wish to increase its upstream operations and it has continuously been revised upwards with new discoveries.
Brazil
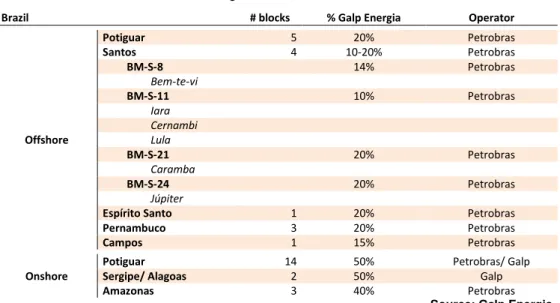
Galp Energia’s presence in Brazil is separated between onshore and offshore exploration. It participates in a total of 21 projects spread across 8 basins. Offshore basins include Potiguar, Santos, Espírito Santo, Pernambuco, Campos while onshore basins are Potiguar, Sergipe/Alagoes and Amazonas. Petrobras is the operator in most of the fields with Sergipe being the only exception. Out of all basins, the Santos basin is the only producing region while most others are still in the pre-exploration and exploration phases with no information regarding potential reserves. Due to this, our valuation will only focus on the Santos Basin on a block by block approach.
Figure 13: E&P Brazil
Brazil # blocks % Galp Energia Operator
Offshore
Potiguar 5 20% Petrobras
Santos 4 10-20% Petrobras
BM-S-8 14% Petrobras
Bem-te-vi
BM-S-11 10% Petrobras
Iara
Cernambi
Lula
BM-S-21 20% Petrobras
Caramba
BM-S-24 20% Petrobras
Júpiter
Espírito Santo 1 20% Petrobras
Pernambuco 3 20% Petrobras
Campos 1 15% Petrobras
Onshore
Potiguar 14 50% Petrobras/ Galp
Sergipe/ Alagoas 2 50% Galp
Amazonas 3 40% Petrobras
Source: Galp Energia
Santos basin is comprised by four blocks: 8 with the Bem-te-vi field, BM-S-11 with the Iara, Cernambi and Lula (previously named Tupi) fields, BM-S-21 with the Caramba field and finally BM-S-24 with the Júpiter field.
17
GALP ENERGIA COMPANY REPORT
THIS DOCUMENT IS NOT AN INVESTMENT RECOMMENDATION AND SHALL BE USED
EXCLUSIVELY FOR ACADEMIC PURPOSES (
SEE DISCLOSURES AND DISCLAIMERS AT END OF DOCUMENT)PAGE 12/39 Bem-te-vi had its first discovery in 2007 and its oil is characterized by an API of 28-30º which classifies it as medium crude. Production is expected to begin in 2013 with the declaration of commerciality delivery in December 2012 and EWT18 in 2012. Reserves are assumed to be 1120Mbbl, slightly below other fields. Iara has been in evaluation since the end of 2008 with its EWT scheduled for 2013 and its declaration of commerciality by December 2013. Recoverable oil and natural gas is between 3 to 4bln (4000 Mbbl) with production in 2014.
Lula and Cernambi are the most developed fields in the basin with production already happening in Lula. So far 14 wells have been drilled (100% success), with 6.44bln attributed to Lula and another 1.82 bln attributed to Cernambi. Declaration of commerciality was submitted in December 2010. A detailed plan of operations has already been developed with installed capacity of 1270Kboepd by 2017. This will comprise an investment of 9 FPSO units and 160 wells.
Caramba was established in 2001 with the first light oil discovery in 2007. Seismic evaluation was performed during 2009 and 2010 and due to the positive results the second exploration well will be drilled in 2013. Declaration of commerciality is expected by April 2015 and production in 2016. Reserves are assumed to be 1600Mbbl and may vary with future information. Júpiter had its first oil discovery in 2007 and the first appraisal well was scheduled for 2011. Its EWT will only be carried in 2016 and its declaration of commerciality is expected to be delivered until February 2016. As a result, production is expected to take place on the second half of 2016, with 1400Mbb of potential reserves.
Operations in Brazil are subjected to specific characteristics. Operating costs are mostly comprised by labor and energy costs and despite Petrobras efficiency these are expected to increase over time. Since Petrobras is the operator in most of the fields where Galp Energia is present, the evolution of its lifting costs is extremely relevant. Finding and developing costs have been close to 20$/bbl19 and will increase over time due to higher iron/steel prices, increase in 2D and 3D seismic testing, among others. Since these operations are in deep water conditions, Petrobras historical costs are not representative of operations in the Santos Basin. This translates into higher capital expenditures (i.e.: wells can cost up to $200M for deep water exploration where common values are located below $80M), higher F&D costs and higher operational/lifting costs. Shallow water operational costs are often between 10$/bbl-15$/bbl but deep water production
18 Extended Well Tests – Used to evaluate the productivity and characteristics of reservoirs. 19 Petrobras Business Plan.
Block Field Reserves
(Mboe)
BM-S-8 Bem-te-vi 1120
BM-S-11 Iara 3500
Cernambi 1820
Lula 6440
BM-S-21 Caramba 1600
BM-S-24 Júpiter 1400
Block Field
Expected Year of Production
BM-S-8 Bem-te-vi 2013
BM-S-11 Iara 2013
Cernambi 2011
Lula 2010
BM-S-21 Caramba 2016
BM-S-24 Júpiter 2016
3Q 2010
4Q 2010
1Q 2011
2Q 2011
Lifting Costs without royalties
10.60 10.29 11.38 13.12
Lifting Costs with royalties
24.67 25.58 30.48 35.00
Figure 14: Reserves in Santos basin
Figure 15: Year of production
Figure 16: Petrobras lifting costs (USD/bbl)
Source: Galp Energia, Analyst estimates
Source: Galp Energia, Analyst estimates
GALP ENERGIA COMPANY REPORT
THIS DOCUMENT IS NOT AN INVESTMENT RECOMMENDATION AND SHALL BE USED
EXCLUSIVELY FOR ACADEMIC PURPOSES (
SEE DISCLOSURES AND DISCLAIMERS AT END OF DOCUMENT)PAGE 13/39 can cost much more, reaching values close to 70$/bbl20. Brazilian Energy Minister Edison Lobao declared in October 200821 that operational costs, including royalties, would remain between 40$/bbl-50$/bbl which compares to an average 32$/bbl on easier to drill projects. This implies an increase of 10-15$/bbl to Petrobas historical lifting costs. Oil spill in the Gulf of Mexico, despite demonstrating the inherent risks of this activity, had no significant impact since deep water projects are still being pursued and technological improvements will reduce the probability of such occurrences.
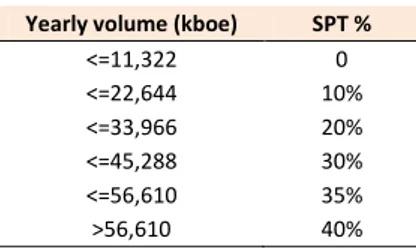
Taxation is carried out in three different forms: Royalties of 10% of sales, SPT tax of 0% to 40% of operating profit and a corporate tax rate of 35% over EBT. The SPT tax is determined according to the annual production.
Capital expenditures were determined by considering the expenditures associated with the construction of wells (both injection and extraction wells), FPSOs, and maintenance. Each field was given an average life of 25 years and production was determined as a function of the number of wells, FPSOs and their average production. Due to the difficulties involved in deep water exploration, wells can cost up to $200M. Due to the different type of wells and conditions on each field, an average cost of $140M was used (while 1/3 of wells corresponds to injection wells). FPSOs cost on average $1,700M, obviously varying with the size and characteristics of each unit. Capex during 2012-2015 is estimated to be €2,500M for Galp Energia.
Graph 6: Total capital expenditures in Brazil (Including Sinopec’s share)
Source: Analyst estimates
Galp Energia recently established a partnership with Sinopec, in which Sinopec obtained 30% of the company’s holdings in Brazil through a capital increase of $4.8B (€3.6B). This transaction has an implicit value of $12.5B (€9.4B) for Galp Energia’s assets. According to our valuation of the Brazilian assets (figure 25), the fair value of the assets corresponds to $12.2B (€9.1B), implying that this sale
20Petredis, Charles W. December 2008. “Deepwater Drillers: Not in a Very Deep Hole.” 21 Reuters. October 2008. “Tupi profitable even with lower prices.”
0 400 800 1.200 1.600
2012 2016 2020 2024 2028 2032 2036
Cap
ital
E
xp
e
n
d
itu
re
s
(
€
M)
BM-S-8 BM-S-11 BM-S-21 BM-S-24
Yearly volume (kboe) SPT %
<=11,322 0
<=22,644 10%
<=33,966 20%
<=45,288 30%
<=56,610 35%
>56,610 40%
Block Field Capex
2012-2015)
BM-S-8 Bem-te-vi 414.51 €
BM-S-11 Iara 541.82 €
Cernambi
& Lula 1,105.16 €
BM-S-21 Caramba 258.57 € BM-S-24 Júpiter 188.56 €
Figure 17: Brazilian SPT tax
Figure 18: Total Capex (Including
Sinopec’s share)
Source: Galp Energia, ANP
GALP ENERGIA COMPANY REPORT
THIS DOCUMENT IS NOT AN INVESTMENT RECOMMENDATION AND SHALL BE USED
EXCLUSIVELY FOR ACADEMIC PURPOSES (
SEE DISCLOSURES AND DISCLAIMERS AT END OF DOCUMENT)PAGE 14/39 had a positive contribution for the company. Moreover, this transaction did not grant Sinopec a controlling position and Galp Energia remains the major stakeholder. As a consequence, accounting consolidation is performed under the full consolidation method and the transaction will boost the company’s Equity (through minorities) by €3.6B and Assets (cash) by the same €3.6B. Also associated with this transaction is the credit line which Sinopec extended to Petrogal Brazil.
Our view on the transaction is not shared by many analysts that had valued these assets around 15$B (€11.1B). Following the announcement, Galp Energia’s share price suffered a sharp decline, going from €15 to €11.5 per share. We stand by our valuation and we believe that Sinopec’s entry greatly reduced the financial risks of the E&P segment. Additionally, we strongly believe that the high decrease in prices is not simply a result of the transaction. Markets are fairly pessimistic, especially in regards to companies operating in countries directly involved with the sovereign debt crisis. The eventual “bad news” that analysts described possibly led investors to short positions. One common point, however, is that all analysts believe the partnership greatly reduced financing risks.
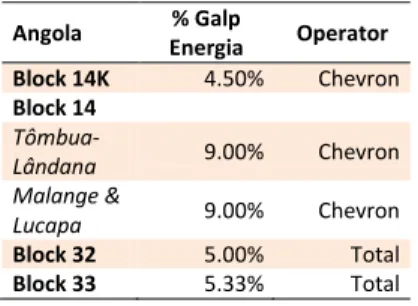
Angola
Galp Energia is present in Angola since 1982, with current holdings in four different locations: Block 14, Block 14K, Block 32 and Block 33. Block 14K is operated by Chevron, containing a total of 300Mbbl with production starting in 2018. Due to the small amount of reserves and because of the CPT22 already installed in block 14, synergies can be used and a low amount of investments is required. Block 14, where Galp detains a share of 9%, is comprised by Tômbua-Lândana, Malange and Lucapa. Tômbua-Lândana has been producing since 2006, depleting part of its reserves. Current tests indicate a total of 350Mbbl left to obtain which are believed to be fully extracted in the next 20 years. Actual production is of 60kbopd and no further capacity improvements are required given the level of reserves. As a result, most capital expenditure comes from maintenance. Malange & Lucapa are believed to contain a total of 1200Mbbl in reserves and production is expected to take place in 2016. Due to the large amount of reserves, a significant amount of investment will be required. Block 32 is operated by Total and there is much uncertainty regarding both production and potential reserves. Consensus dictates that reserves may be close to 1500Mbbl and production might occur in 2017. We considered these numbers when valuing
22 Compliant Piled Tower.
Angola % Galp
Energia Operator
Block 14K 4.50% Chevron
Block 14
Tômbua-Lândana 9.00% Chevron Malange &
Lucapa 9.00% Chevron
Block 32 5.00% Total
Block 33 5.33% Total
Field Reserves Production
Block 14K 300 2018
Block 14
Tômbua-Lândana 350 2006
Malange &
Lucapa 1200 2016
Block 32 1500 2017
Figure 19: Angola E&P
Figure 20: Reserves in Angola
Source: Galp Energia, Analyst estimates
GALP ENERGIA COMPANY REPORT
THIS DOCUMENT IS NOT AN INVESTMENT RECOMMENDATION AND SHALL BE USED
EXCLUSIVELY FOR ACADEMIC PURPOSES (
SEE DISCLOSURES AND DISCLAIMERS AT END OF DOCUMENT)PAGE 15/39 it. Finally, Block 33 is not valued since the level of uncertainty is bigger than in Block 32.
Operational costs in Angola have constantly increased over time, reaching 17$/bbl in the 3rd quarter of 2011. Taxation in Angola is performed under a production share agreement (PSA) where total production (denominated working interest production) is split into two different components: oil cost and oil production. Oil cost refers to the share of production that is used to cover operational costs and capital expenditures. The exceeding amount is denominated oil production, and this portion is shared between the operator and the government at a PSA rate that can go from 0% to 70%, similarly to the SPT tax in Brazil. This implies that, from the overall production, companies retain the share of oil cost and a portion of the oil production. This is denominated net entitlement which has historically corresponded to 65% of working interest production (35% remains with the government). Due to the assumed increase in operational costs, oil cost will increase and the company will retain a higher share to support the higher costs. We estimate an increase from 65% to 70%. The second stage of taxation involves a corporate petroleum income tax of 50% that is applied to the EBT. Capital expenditures are believed to be close to €400M over the next five years.
Mozambique & others
During the drilling of a well in Mamba south 1 Eni discovered a massive quantity of Natural Gas. It is believed that a total of .7.5 Tcf is contained in the field. Galp Energia owns a 10% stake over this field and plans to commercialize the discovery are being taken. The valuation is performed based in the oil parity23 due to the lack of a global market for NG. We felt this was the appropriate pricing method since this field will export to Asian markets, where oil parity is commonly used24. Eni’s historical operational costs appear to be lower than the ones included in our valuation of Brazil/Angola. However, ENI’s operations do not comprise the same level of deep water and pre-salt exploration that Petrobras does. Since Mamba south 1 is also considered deep water, we added an additional $15/bbl, similar to the procedure in Petrobras. Taxation follows a production share agreement where NG royalties are 6%. We found no information regarding SPT taxes but even if these did not exist, they would most
23 Gas is priced on an energy equivalent basis (i.e.: 17% of crude prices).
24
Herrmann, Lucas. Dunphy, Elaine. Copus, Jonathan. 2010. “World Gas Markets” in Oil & Gas for Beginners, Deutsche Bank, pages 133-144.
2010 2011
3Q 4Q 1Q 2Q 3Q
15.40 9.00 18.66 13.91 17.42
2008 2009 2010
Operational
Costs 7.65 7.41 8.89
0 5 10 15 20
2010 2015 2020 2025 2030 2035
Working Interest
Net Entitlement
Graph 7: Angola Production (Mboe per year)
Figure 21: Angola’s Operational costs
Source: Galp Energia
Figure 22: ENI’s Operational costs
Source: Eni
GALP ENERGIA COMPANY REPORT
THIS DOCUMENT IS NOT AN INVESTMENT RECOMMENDATION AND SHALL BE USED
EXCLUSIVELY FOR ACADEMIC PURPOSES (
SEE DISCLOSURES AND DISCLAIMERS AT END OF DOCUMENT)PAGE 16/39 likely be created. It is unlikely that the government will allow foreign companies to profit from its territory and not extract a higher portion of taxation. The corporate tax in Mozambique is of 32%. Capital expenditures are estimated to be around €280M for the period of 2012-2015, with production starting in 2014. Galp Energia’s holdings in other countries are not valued since no reserves have been found and they are included in the company’s strategic goals.
Valuation
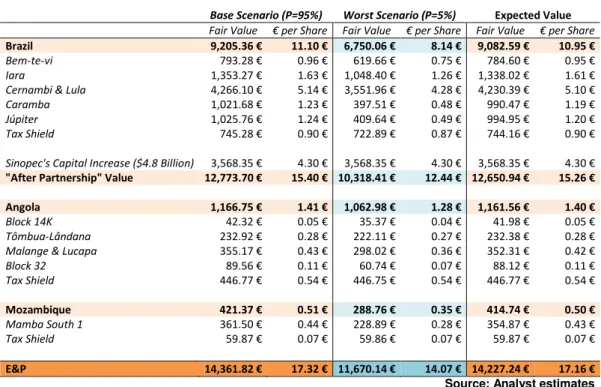
Each field was analysed separately through an Adjusted Present Value model since the Debt-to-equity ratio under each project is not constant. Moreover, debt usage in such projects is highly common and an analysis based on comparables easily yielded a fairly accurate level of debt usage (Interest bearing debt often corresponds to 30% of Equity and 16% of Total Assets). All publicly available information was used when estimating reserves, operational costs (lifting costs), F&D costs (relevant for depreciation), equipment and taxation. We believe brent prices may drop slightly in the near future but long-term expectations consists in 132.90$/bbl25 by 2035. Combined with the expectations of euro depreciation, taxation and a lower value for Galp Energia’s crude given its heavier composition (5% discount over Brent), we obtained:
Figure 23: E&P valuation (Total EV)
Base Scenario (P=95%) Worst Scenario (P=5%) Expected Value Fair Value € per Share Fair Value € per Share Fair Value € per Share
Brazil 9,205.36 € 11.10 € 6,750.06 € 8.14 € 9,082.59 € 10.95 €
Bem-te-vi 793.28 € 0.96 € 619.66 € 0.75 € 784.60 € 0.95 €
Iara 1,353.27 € 1.63 € 1,048.40 € 1.26 € 1,338.02 € 1.61 €
Cernambi & Lula 4,266.10 € 5.14 € 3,551.96 € 4.28 € 4,230.39 € 5.10 €
Caramba 1,021.68 € 1.23 € 397.51 € 0.48 € 990.47 € 1.19 €
Júpiter 1,025.76 € 1.24 € 409.64 € 0.49 € 994.95 € 1.20 €
Tax Shield 745.28 € 0.90 € 722.89 € 0.87 € 744.16 € 0.90 €
Sinopec's Capital Increase ($4.8 Billion) 3,568.35 € 4.30 € 3,568.35 € 4.30 € 3,568.35 € 4.30 €
"After Partnership" Value 12,773.70 € 15.40 € 10,318.41 € 12.44 € 12,650.94 € 15.26 €
Angola 1,166.75 € 1.41 € 1,062.98 € 1.28 € 1,161.56 € 1.40 €
Block 14K 42.32 € 0.05 € 35.37 € 0.04 € 41.98 € 0.05 €
Tômbua-Lândana 232.92 € 0.28 € 222.11 € 0.27 € 232.38 € 0.28 €
Malange & Lucapa 355.17 € 0.43 € 298.02 € 0.36 € 352.31 € 0.42 €
Block 32 89.56 € 0.11 € 60.74 € 0.07 € 88.12 € 0.11 €
Tax Shield 446.77 € 0.54 € 446.75 € 0.54 € 446.77 € 0.54 €
Mozambique 421.37 € 0.51 € 288.76 € 0.35 € 414.74 € 0.50 €
Mamba South 1 361.50 € 0.44 € 228.89 € 0.28 € 354.87 € 0.43 €
Tax Shield 59.87 € 0.07 € 59.86 € 0.07 € 59.87 € 0.07 €
E&P 14,361.82 € 17.32 € 11,670.14 € 14.07 € 14,227.24 € 17.16 €
Source: Analyst estimates
GALP ENERGIA COMPANY REPORT
THIS DOCUMENT IS NOT AN INVESTMENT RECOMMENDATION AND SHALL BE USED
EXCLUSIVELY FOR ACADEMIC PURPOSES (
SEE DISCLOSURES AND DISCLAIMERS AT END OF DOCUMENT)PAGE 17/39 Since oil fields are assets common transacted, it is imperative that we compare the results of our valuation with the commonly negotiated values. Appendix 2 contains a list of the transactions that took place during 2011, along with the average implied reserve value ($/boe) on these transactions. To compare our approach, we also present in the same appendix the implied reserve value ($/boe) for each of our fields. It is important to denote that values vary depending on the reserves that we consider: Proven reserves (1P), Probable reserves (2P) and Possible reserves (3P). This notation depends on the probability of existence of such reserves26. The only field in which we compared through 1P was the Lula & Cernambi field due to the high degree of certainty. Our results indicate that our valuations are situated between 7.51$/boe and 3.81$/boe, averaging 6.26$/boe. The 2P average implied reserve value displayed close to 5$/boe in the first and third quarter of 2011, along with an astonishing 12$/boe in the second quarter of 2011. This leads to an average of 7.37$/boe which could indeed indicate that our analysis underestimated the value of the fields. However, one could also state that the transactions verified in the second quarter of 2012 were fairly abnormal and we should thus compare it only to the most recent information of 4.9$/boe. The conclusion is not evident but we believe our analysis matches the current market uncertainty, fitting both optimistic and pessimistic views.
Refining & Marketing
Market Overview
The downstream market is extremely dependent on the future policies that might be developed. Policies targeted at a reduction of emissions can highly compromise the market viability of most fossil fuels. Subsidies on cleaner energies, costs on CO2 emissions and other polluting substances may highly
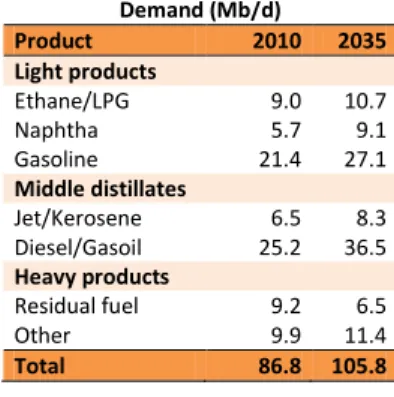
influence the future pattern of product mix that is most desired by agents. Technology improvements also stand as one of the major key drivers of future product demand. Improvement on efficiency lowers oil product consumption and the development of alternative vehicles, such as hybrid or electric cars may lessen long-term demand for gasoline and diesel. On a general consensus, environmental concerns have slowed down with the current recession, but they are bound to rise given its importance. Our view focuses on a gradual decrease of product oil demand in developed countries, and a major increase in developing
26 1P (90% confidence); 2P (50% confidence); 3P (10% confidence). Demand (Mb/d)
Product 2010 2035
Light products
Ethane/LPG 9.0 10.7
Naphtha 5.7 9.1
Gasoline 21.4 27.1
Middle distillates
Jet/Kerosene 6.5 8.3
Diesel/Gasoil 25.2 36.5
Heavy products
Residual fuel 9.2 6.5
Other 9.9 11.4
Total 86.8 105.8
Figure 24: Product mix demand
GALP ENERGIA COMPANY REPORT
THIS DOCUMENT IS NOT AN INVESTMENT RECOMMENDATION AND SHALL BE USED
EXCLUSIVELY FOR ACADEMIC PURPOSES (
SEE DISCLOSURES AND DISCLAIMERS AT END OF DOCUMENT)PAGE 18/39 economies. Since much of the refining capacity is installed in developing economies, this promotes trading. Due to transportation costs, companies often supply their marketing activities from local refineries27. This implies that refineries in Developing economies are bound to surge. OPEC estimates indicate that around 6.8Mb/d of crude distillation capacity will be added in the period from 2011-2015.
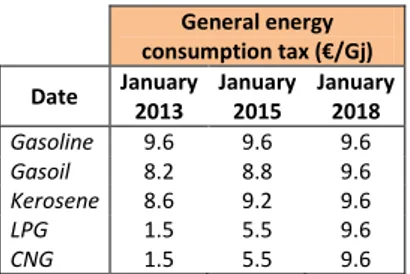
Europe currently shows a shift towards middle distillates, with an increase from 6.2Mb/d to 6.5Mb/d of diesel demand. This pattern emerged due to the lower taxation of middle distillates, resulting in lower prices for gasoil. For instance, average EU gasoline price (after-taxes) is situated around €1.423/l28 while gasoil displays €1.398/l. Before taxes, average EU gasoline prices correspond to €0.646/l and gasoil correspond to €0.751/l. The spread between after-tax prices has decreased over time but gasoil has higher energy content, allowing users to travel greater distances. With the current release of the European Commission (EC) proposal denominated “Proposal for Council Directive amending Directive 2003/96/EC restructuring the Community framework for taxation of energy
products and electricity” the EC seeks to resolve policy inconsistencies which induced a greater taxation burden in products with lower energy content. Since gasoline has lower energy content the applicable tax burden was higher. The introduction of this proposal results in a gradual increase of the minimum tax rate for on-road motor fuels (with the exception of gasoline) as represented in figure 26. Since this policy only interferes with minimum rates, it does not necessarily imply equal taxation since EU state members may establish different final rates but it does alleviate much of the existing dispersion. This leads us to believe that gasoil prices will increase, approximating those of gasoline.
The refining activity in Europe is ever more complicated due to possible mandates on biofuels, transport efficiency and carbon emissions. Furthermore, the European refining industry continues to suffer from overcapacity. Capacity additions are limited to certain regions with most investments taking place in conversion projects, as a direct result of the shift towards middle distillates. Many refineries in Western Europe are either for sale, being converted into storage facilities or face closure29. This overcapacity is expected to lead utilization rates from 76% to 60% by 2035. For instance, Petroplus is closing three refineries,
27
Shipping costs may go up to 2.46$/bbl, with an average of 1.85$/bbl in accordance with Oil&Gas Journal 2009.
28
Europe’s Energy Portal. 08-12-2011.
29
Majority of companies includes Shell, Total, Chevron and ConocoPhillips.
Demand (Mb/d)
Product 2010 2035
Light products
Ethane/LPG 1.2 0.9
Naphtha 1.2 1.0
Gasoline 2.3 2.4
Middle distillates
Jet/Kerosene 1.2 1.2
Diesel/Gasoil 6.2 6.5
Heavy products
Residual fuel 1.5 0.5
Other 1.8 1.3
Total 15.4 13.9
Product Mix
Product Mix 2010 2015E
Gasoline 24% 19%
Diesel 35% 45%
Fuel Oil 17% 9%
Jet Fuel 8% 9%
Others 16% 19%
General energy
consumption tax (€/Gj)
Date January
2013
January 2015
January 2018
Gasoline 9.6 9.6 9.6
Gasoil 8.2 8.8 9.6
Kerosene 8.6 9.2 9.6
LPG 1.5 5.5 9.6
CNG 1.5 5.5 9.6
Figure 25: European demand
Figure 26: On-road taxation proposal
Source: OPEC World Oil Outlook 2011 Source: OPEC World Oil
Outlook 2011
Figure 27: Galp Energia’s product mix