Arq Neuropsiquiatr 2008;66(3-A):560-562
560
Clinical / Scientiic note
THROMBOSED DEvElOpMEnTal vEnOuS anOMaly
aSSOCIaTED WITH CEREBRal vEnOuS InfaRCT
Rômulo L. Gama
1, Mauro Nakayama
1, Daniel G.F. Távora
1,
Rodrigo C. Bomim
1, Trícia C. Carneiro
2, Leonardo H.C. Pimentel
2TROMBOSE DE anOMalIa vEnOSa aSSOCIaDa a InfaRTO vEnOSO CEREBRal
Rede Sarah de Hospitais de Reabilitação, Fortaleza CE, Brazil: Departamentos de 1Radiologia e 2Lesado Cerebral.
Received 20 February 2008, received in inal form 30 May 2008. Accepted 12 June 2008.
Dr. Rômulo L. Gama – Rede Sarah de Hospitais de Reabilitação - Avenida Presidente Juscelino Kubitscheck 4500 - 60861-630 Fortaleza CE - Brasil. E-mail: [email protected]
Developmental venous anomaly (DVA), also known as venous angioma, is becoming the most commonly en-countered intracranial vascular malformation in central nervous system (CNS) imaging1,2. It is thought that DVA
de-velops during development of the venous system which results in the preservation of primitive embryological medullary veins, draining into a single longer vein3.
Throm-bosis of the collector vein of a DVA is a rare complication leading to cerebral venous infarction (CVI)4.
CaSE
A 19 years old woman presented with acute onset of synco-pe, followed by left side of the body weakness and numbness. These symptoms were followed by consecutive episodes of
sei-zures with loss of consciousness. Her admission was done ive days after onset of symptoms. She was alert and oriented. Neu-rological examination demonstrated slight left hemiparesis, hy-peractive deep tendon relexes, impaired supericial sensation and Babinski’s sign response on the left side. The Hoffmann’s sign was present bilaterally.
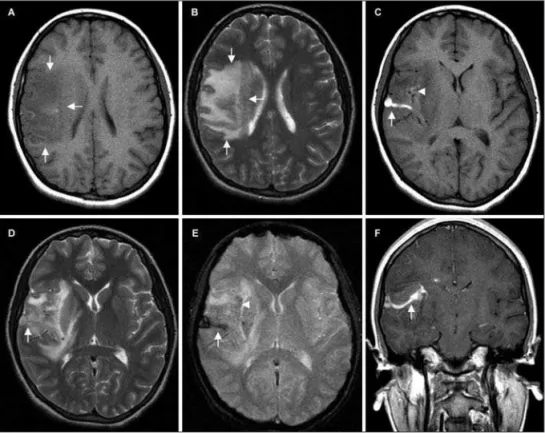
MRI revealed a dilated vascular structure at right fron-tal lobe, illed with hyperintense material on unenhanced T1-weighted sequences. It was thought to represent a thrombosed venous collector of a DVA, draining toward the supericial ve-nous system (Fig 1C). Gradient-echo sequences conirmed the endoluminal clot as a hypointense tubular structure due to mag-netic susceptibility effect of blood products (Fig 1E). The insu-lar cortex had a mild hyperintensity on unenhanced
Arq Neuropsiquiatr 2008;66(3-A)
561 Thrombosed venous anomaly: MRI Gama et al.
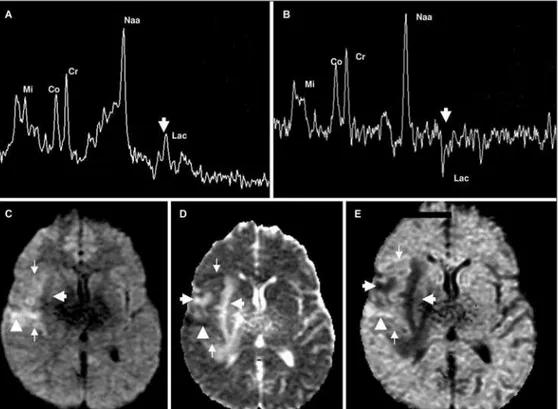
ed sequences and hypointensity on T2-weighted sequences due to parenchymal hemorrhage in early subacute stage (Fig 1C and 1D). Adjacent frontoparietal area and basal ganglia showed ex-tensive edema, with hypointense signal on T1 weighted sequenc-es and hyperintense signal on T2-weighted sequencsequenc-es (Fig 1A and 1B). DWI demonstrated high signal in the intravascular clot. Mild hyperintense signal was also detected in the brain parenchyma surrounding the thrombosed collector and in the insular cor-tex. ADC map in these areas revealed heterogeneously hypoin-tense signal. The remaining edematous areas appeared hyperin-tense on ADC map, indicating vasogenic edema (Fig 2C and 2D). After administration of intravenous paramagnetic contrast me-dia (Gadolinium), T1- weighted images revealed the typical caput medusae appearance of the DVA (Fig 1F). Single voxel 1H-MRS was performed at the right frontoparietal region. Additional voxel was located at the corresponding area on the left hemisphere for comparison. 1H-MRS spectra were obtained with a short echo time (TE) (35 msec) and an intermediate TE (144 msec). Normal N-acetylaspartate (NAA) peak was found. Spectra also showed a positive doublet peak at 1.31 ppm with short echo time and a corresponding inverted doublet peak at intermediate TE, indi-cating lactate peak elevation (Fig 2A and 2B).
Anticoagulant therapy with low-molecular-weight heparin was initiated and the clinical scenario improved promptly.
Fol-low-up MRI and DWI, obtained 3 months later, showed partial recanalization of the venous collector of the DVA and disap-pearance of parenchymal edema.
An institutional review board approval was obtained.
DISCuSSIOn
Vascular malformations of the CNS are classiied by size, location and morphology. The four major pathologic types are capillary telangiectasis, cavernous malforma-tions, DVA and arteriovenous malformations3. DVA are the
most common vascular anomaly in the CNS, and 50-80% of DVAs are located in the cerebral hemispheres5. DVA
have a characteristic appearance on CT and MRI stud-ies. They are rarely detectable without contrast on CT study. After administration of contrast medium the drain-ing veins appear as a linear focuses of enhancement. On brain MRI sequences DVA is depicted as low void tubular images on both T1 and T2 weighted images. After intrave-nous administration of gadolinium, marked enhancement of the draining and medullary veins occurs, forming the typical caput medusae appearance1-3,5.
In our case, MRI revealed abnormal signal intensity in-volving not only subcortical white matter, but the overly-Fig 2. Single voxel 1H-MRS, TE=35ms (A) and TE=144 ms (B) in the right frontoparietal region showed a
Arq Neuropsiquiatr 2008;66(3-A)
562
Thrombosed venous anomaly: MRI Gama et al.
ing cortex adjacent to the DVA. The thrombosed collector vein of the DVA was hyperintense on T1-weighted images and hypointense on gradient-echo T2* weighted images, corresponding to the presence of intravascular clot6.
DWI and ADC map revealed a tiny area of cytotoxic edema at the vicinity of the DVA, surrounded by a larger area of vasogenic edema. In the insular cortex, the pres-ence of hemorrhagic areas might have been responsible for the local decrease in signal intensity in the ADC map, probably as a result of susceptibility effects from blood products. Although venous congestion produced pre-dominantly vasogenic edema, occurrence of cytotoxic edema characterizes the presence of infarcted tissue and underlying CVI. Time interval since the onset of symptoms must be taken into consideration when interpreting ADC map in this case. As a matter of fact, this is an expected phenomenon in the pathophysiology of cerebral venous thrombosis (CVT), caused by congestion of vessels that leads to decreased cerebral blood low7. Thus, decreased
ADC in abnormal brain areas associated with CVT may not have the same prognostic value as those associated with pure arterial stroke. Clinical improvement in our patient reinforces the potential for recovery of CVI8.
In our case, a thrombosed DVA was complicated by CVI. 1H-MRS depicted normal NAA peak indicating
pre-served neuronal viability and it should be considered a good prognostic factor. Another 1H-MRS inding was
el-evation of lactate peak, which can indicates cerebral isch-emia. However, the detection of lactate does not neces-sarily denote the presence of infarcted tissue. Increase in lactate peak may represent ischemic tissue at risk of infarction and a potentially reversible condition9. Indeed,
the patient had a good functional recovery and follow-up examination showed a total disappearance of the
va-sogenic edema and presence of a small remaining area of gliosis.
There is a wide range of etiologies for CVT. Milano et al. described a case associated to prothrombin G20210 mutation10. This case report argues against the assumption
that DVA is completely benign in nature. MRI not only al-lows the diagnosis of DVA, but can also rule out associated abnormalities and depict serious complications, such as spontaneous thrombosis of the collector vein with asso-ciated hemorrhagic cerebral venous infarction. Currently available physiological MR techniques (DWI and 1H-MRS)
can give important prognostic information, especially re-garding reversibility of indings and should be included in the imaging work-up of those patients.
REfEREnCES
1. Truwit, C. Venous angioma of the brain: history, signiicance, and im -aging indings. AJR Am J Roentgenol 1992;159(6):1299-1307. 2. Peltier J, Toussaint P, Desenclos C, Gars DL, Deramond H. Cerebral ve
-nous angioma of the pons complicated by nonhemorrhagic infarction: case report. J Neurosurg 2004;101:690-693.
3. Töpper R, Jürgens E, Reul J, Armin T. Clinical signiicance of intracra -nial developmental venous anomalies. J Neurol Neurosurg Psychiatry 1999;67:234-238.
4. Kim P, Castellani R, Tresser N. Cerebral venous malformation compli -cated by spontaneous thrombosis. Child’s Nerv Syst 1996;12:172-175.
5. Lee C, Pennington A, Kenney CM. MR evalution of developmental ve
-nous anomalies: medullary ve-nous anatomy of ve-nous angiomas. AJNR Am J Neuroradiol 1996;17:61-70.
6. Selim M, Fink J, Linfante I, Kumar S, Schlaug G, Caplan LR. Diagnosis
of cerebral venous thrombosis with echo-planar T2*-weighted magnet
-ic resonance imaging. Arch Neurol 2002;59:1021-1026.
7. Favrole P, Guichard JP, Crasssard I, Bousser MG, Chabriat H. Diffusion-weighted imaging of intravascular clots in cerebral venous thrombosis. Stroke 2004;35:99-103.
8. Masson C, Godefroy O, Leclerc X, Colombani JM, Leys D. Cerebral ve
-nous infarction following thrombosis of the draining vein of a ve-nous angioma (developmental abnormality). Cerebrovasc Dis 2000;10:235-238. 9. Hsu LC, Lirng JF, Fuh JL, Wang SJ, Shyu HY, Liu HC. Proton magnetic
resonance spectroscopy in deep cerebral venous thrombosis. Clin Neu
-rol Neurosurg 1998;100:27-30.