Letters to the Editor
Radiol Bras. 2015 Mai/Jun;48(3):195–200
195
0100-3984 © Colégio Brasileiro de Radiologia e Diagnóstico por Imagem
Letters to the Editor
Dear Editor,
A male, 81-year-old patient admitted because of a progres-sive increase of the abdominal volume for five months, in associa-tion with daily episodes of sudden sweating with syncope. Physical examination revealed the presence of a palpable mass in the right flank and hypogastrium. Computed tomography (CT) (Figures 1A and 1B) demonstrated a voluminous, predominantly solid, expansile retroperitoneal mass in the right hemiabdomen, with lobulated contours and heterogeneous density, measuring 19.0 × 15.0 × 12.0 cm. The upper portion of the mass exhibited heterogeneous enhancement delimiting areas of necrosis or cystic/myxoid degen-eration, while the lower portion was less vascularized. Neither cal-cification nor fat were observed. At magnetic resonance imaging (MRI) (Figures 1C and 1D), the lesion exhibited heterogeneous signal intensity on T2-weighted image, with areas of high signal intensity and a focus of marked low signal intensity located be-tween the superior and inferior portions. At T1-weighted image, the mass was subtly heterogeneous, with no fatty or hematic con-tents. The lower portion of the lesion presented diffusion restric-tion. After intravenous contrast injection (gadolinium), the mass exhibited enhancement similar to the one above described for CT. At admission, hypoglycemic episodes were characterized. The lowest value for fasting glycemia was 29 mg/dL (normal: 70–99 mg/dL). The hypothesis of insulinoma was ruled out by the low insulin serum levels, and hypoinsulinemic hypoglycemia was char-acterized. Plasma IGF-I and IGF-II levels were measured, and the values were respectively 32.00 ng/mL (normal: 55–166 ng/mL) and 594 ng/mL (normal: 288–736 ng/mL). Because of the ratio
IGF-II/IGF-I of 18.56 (normal, up to 3:1; > 10 is suggestive of hypoglycemia caused by non-islet cell tumors), Doege-Potter syn-drome (DPS) was considered as the most probable hypothesis(1–4).
The patient utilized prednisone for glycemic control and under-went percutaneous biopsy and later surgical intervention. Mor-pho-histopathological analysis in association with the immuno-histochemical profile indicated a malignant solitary fibrotic tu-mor (SFT) with extensive areas of necrosis. Since his hospital dis-charge, the patient has not presented any hypoglycemic episode. SFT is a rare neoplasia and, in spite of its originally described pleural origin, it may occur in any site of the body(5–8). Clinically,
many times, such tumor manifests as an asymptomatic slow-grow-ing mass, frequently occurrslow-grow-ing in middle-aged individuals, with no predilection for sex(5–7). It may cause pain and symptoms
re-sulting from adjacent structures compression(5). DPS refers to the
paraneoplastic phenomenon characterized by hypoglycemia sec-ondary to the SFT as it produces high-molecular-weight IGF-II prohormone in excess(1,4,5).
Surgical resection is the treatment of choice for SFT and can cure hypoglycemia(1–5). Most SFTs are benign. Malignant
SFTs are typically large, presenting areas of necrosis and hemor-rhage in addition to cellular atypia and a high number of mitotic figures(5). At CT, SFT generally is seen as a circumscribed,
lobu-lated, hypervascular mass, either displacing or compressing adja-cent structures. The non-enhanced adja-central areas of the mass rep-resent necrosis, cystic/myxoid degeneration or hemorrhage. Calci-fications are rarely found(5–7). At MRI, a SFT typically presents an
intermediate signal intensity on T1-weighted images, and hetero-geneous signal intensity on T2-weighted images, with areas of high signal intensity (necrosis or cystic/myxoid degeneration) and low signal intensity (fibrosis/collagen or flow void), with possible Doege-Potter syndrome
Síndrome de Doege-Potter
Figure 1.A: Iodinated contrast-enhanced CT (portal phase) – coronal reconstruction – identifies a large retroperitoneal, heterogeneous mass with two main portions. The upper portion of the mass is more hetero-geneous and presents intense, peripheral enhancement, delimiting areas of necrosis or cystic/myxoid degen-eration. The lower portion of the mass is less vascularized. B: Iodinated contrast enhanced CT (portal phase) – axial section – shows the region of the upper portion of the mass with heterogeneous density and enhance-ment. C: Coronal MRI T2-weighted HASTE image reveals a voluminous retroperitoneal, lobulated lesion with two distinctive portions, the upper portion more heterogeneous, with foci of high signal intensity on T2-weighted image and the lower portion with intermediate and less heterogeneous signal intensity. The white arrow indicates a nodular area with marked low signal intensity on T2-weighted image, which might correspond to a dense fibrotic stroma. D: Axial MRI T1-weighted image with fat saturation after intravenous contrast (gadolinium) injection in the region of the upper portion of the lesion shows findings similar to the ones observed at CT.
A
B C
Letters to the Editor
Radiol Bras. 2015 Mai/Jun;48(3):195–200
196
intense, predominantly peripheral enhancement in association with non-enhanced areas(5–7). Histopathological and
immunohis-tochemical analyzes are necessary to confirm the diagnosis(6).
REFERENCES
1. Bodnar TW, Acevedo MJ, Pietropaolo M. Management of non-islet-cell tumor hypoglycemia: a clinical review. J Clin Endocrinol Metab. 2014;99: 713–22.
2. Khowaja A, Johnson-Rabebett B, Bantle J, et al. Hypoglycemia mediated by paraneoplastic production of insulin like growth factor-2 from a ma-lignant renal solitary fibrous tumor – clinical case and literature review. BMC Endocr Disord. 2014;14:49.
3. Dutta P, Aggarwal A, Gogate Y, et al. Non-islet cell tumor-induced hy-poglycemia: a report of five cases and brief review of the literature. Endocrinol Diabetes Metab Case Rep. 2013;2013:130046.
4. Schutt RC, Gordon TA, Bhabhra R, et al. Doege-Potter syndrome pre-senting with hypoinsulinemic hypoglycemia in a patient with a malig-nant extrapleural solitary fibrous tumor: a case report. J Med Case Rep. 2013;7:11.
5. Shanbhogue AK, Prasad SR, Takahashi N, et al. Somatic and visceral
solitary fibrous tumors in the abdomen and pelvis: cross-sectional imag-ing spectrum. Radiographics. 2011;31:393–408.
6. Ginat DT, Bokhari A, Bhatt S, et al. Imaging features of solitary fibrous tumors. AJR Am J Roentgenol. 2011;196:487–95.
7. Wignall OJ, Moskovic EC, Thway K, et al. Solitary fibrous tumors of the soft tissues: review of the imaging and clinical features with histopatho-logic correlation. AJR Am J Roentgenol. 2010;195:W55–62. 8. Batista GR, D’Ippolito G, Szejnfeld J, et al. Tumor fibroso solitário do
rim: descrição de caso. Radiol Bras. 2005;38:313–5.
Bruno Lima Moreira1, Marlon Augusto Schiocchet Monarim1, Ricardo Francisco Tavares Romano1, Leandro Accardo Mattos1, Giuseppe D’Ippolito1
1. Escola Paulista de Medicina da Universidade Federal de São Paulo (EPM-Unifesp), São Paulo, SP, Brazil. Mailing Address: Dr. Bruno Lima Moreira. Departamento de Diagnóstico por Imagem – EPM-Unifesp. Rua Napoleão de Barros, 800, Vila Clementino. São Paulo, SP, Brazil, 04024-012. E-mail: [email protected].
http://dx.doi.org/10.1590/0100-3984.2014.0126
Gastric Kaposi’s sarcoma
Sarcoma de Kaposi gástrico
Dear Editor,
A male, 29-year-old, homosexual patient presenting with his-tory of 20 kg-weight loss, asthenia, nausea and stomach pain for three months in association with appearance of skin lesions in upper limbs and scrotal sac.
Human immunodeficiency virus (HIV) serology was positive. Double contrast radiological study of the stomach (Figure 1A)
demonstrated polypoid lesions. At abdominal computed tomog-raphy (Figures 1B and 1C), solid, polypoid nodular masses were observed on the gastric submucosa with endoluminal component and early contrast-enhancement. High digestive endoscopy (Fig-ure 1D) demonstrated erythematous lesions, some of them be-ing violaceous, polypoid and flat, with a normal gastric submu-cosa. On that occasion, biopsy of the skin lesions and of the le-sions in the stomach revealed atypical vascular lesion, and the anatomopathological and immunohistochemical analyses con-firmed the diagnosis of Kaposi’s sarcoma.
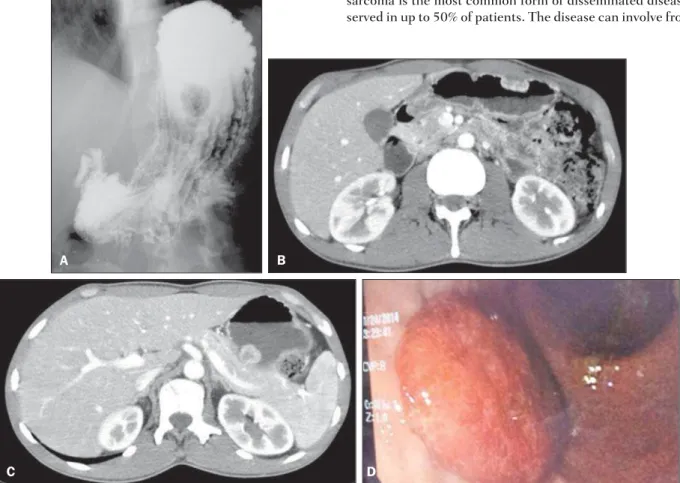
The compromise of the gastrointestinal tract by Kaposi’s sarcoma is the most common form of disseminated disease, ob-served in up to 50% of patients. The disease can involve from the
Figure 1.A: Radiographic image of esophagus, stomach and duodenum shows polypoid filling defect. B,C: Abdominal CT arterial phase shows subepithelial hypervascular polypoid lesions. D: High digestive endoscopy shows the corresponding reddish polypoid lesion.
B
C D