http://dx.doi.org/10.1590/bjpt-rbf.2014.0047 Braz J Phys Ther. 2014 Nov-Dec; 18(6):521-529 521
Muscular performance characterization in athletes: a
new perspective on isokinetic variables
Giovanna M. Amaral1, Hellen V. R. Marinho1,2, Juliana M. Ocarino1,
Paula L. P. Silva1, Thales R. de Souza1, Sérgio T. Fonseca1
ABSTRACT | Background: Isokinetic dynamometry allows the measurement of several variables related to muscular performance, many of which are seldom used, while others are redundantly applied to the characterization of muscle function. Objectives: The present study aimed to establish the particular features of muscle function that are captured by the variables currently included in isokinetic assessment and to determine which variables best represent these features in order to achieve a more objective interpretation of muscular performance. Method: This study included 235 male athletes. They performed isokinetic tests of concentric knee lexion and extension of the dominant leg at a velocity of 60º/s. An exploratory factor analysis was performed. Results: The indings demonstrated that isokinetic variables can characterize more than muscle torque production and pointed to the presence of 5 factors that enabled the characterization of muscular performance according to 5 different domains or constructs. Conclusions: The constructs can be described by torque generation capacity; variation of the torque generation capacity along repetitions; movement deceleration capacity; mechanical/physiological factors of torque generation; and acceleration capacity (torque development). Fewer than eight out of sixteen variables are enough to characterize these ive constructs. Our results suggest that these variables and these 5 domains may lead to a more systematic and optimized interpretation of isokinetic assessments.
Keywords: physical therapy; muscle strength dynamometer; knee joint; isokinetics; factor analysis.
HOW TO CITE THIS ARTICLE
Amaral GM, Marinho HVR, Ocarino JM, Silva PLP, Souza TR, Fonseca ST. Muscular performance characterization in athletes: a new perspective on isokinetic variables. Braz J Phys Ther. 2014 Nov-Dec; 18(6):521-529. http://dx.doi.org/10.1590/ bjpt-rbf.2014.0047
Introduction
Over the last decades, the technology of isokinetic
devices has improved1,2. In order to achieve a more
thorough description of muscular performance, new variables began to be calculated and included in the assessment reports generated by these
devices1. However, only a few of these variables
have been explored from scientific and clinical perspectives. For example, peak torque has been
the most widely reported and discussed approach to the characterization of muscular performance for several years1,3,4.
Isokinetic assessments of muscle function are
widely used to identify speciic deicits, or to assess the results of interventions. Some authors have discussed the relevance and meaning of each
variable included in isokinetic assessments1,4-6.
Some publications reported on variables such as Total Work, Fatigue Index and Power, in addition
to Peak Torque6,7. However, little is known about
the associations among such variables, as well
as the individual contribution of each variable to the characterization of muscular performance. A
better understanding of these aspects might help to
establish which variables measure similar features of muscle function and which variables best
represent particular features of performance. Such understanding would allow the report of variables
in a uniform and rational manner. Therefore, the aims of the present study were to identify
the speciic features of muscle function that are
represented by the variables currently available in isokinetic assessments and to determine which variables best represent these features in order to develop a more objective assessment of muscular performance.
1Programa de Pós-graduação em Ciências da Reabilitação, Universidade Federal de Minas Gerais (UFMG), Belo Horizonte, MG, Brazil 2Universidade Estadual de Montes Claros (UNIMONTES), Montes Claros, MG, Brazil
Amaral GM, Marinho HVR, Ocarino JM, Silva PLP, Souza TR, Fonseca ST
522 Braz J Phys Ther. 2014 Nov-Dec; 18(6):521-529
Method
Subjects
Preseason isokinetic assessment reports of knee joint lexion-extension concentric motions at 60º/s
were selected from the laboratory’s database. The
reports showing a documented history of lower limb injury or symptoms were excluded and only
data from the dominant limb were included. The
sample included 235 male elite athletes (soccer and volleyball players) with mean age 23.07±4.84 years, mean height 1.83±8.09 meters and mean body weight 78.18±9.33 Kg. All athletes were, at the time of the
evaluation, active in their professional team. The present study was approved by the Ethics Committee
of Universidade Federal de Minas Gerais (UFMG), Belo Horizonte, MG, Brazil (approval number 01748412.0.0000.5149), and all athletes signed an
informed consent form.
Procedures
The procedure was explained and the lower limb dominance was determined by asking the athlete which leg he uses to kick a ball. The athletes performed a warm-up consisting of exercises on an ergometric bicycle for 5 minutes. Next, the athletes were placed on the isokinetic dynamometer (Biodex Multi-joint System 3, Biodex Medical Systems Inc, Shirley, NY, USA) in a sitting position with hip lexion of 85° and the equipment axis aligned
with the lateral condyle of the femur. The arms
were placed along the sides of the body, the trunk was stabilized against the backrest using the chair belts, the thigh of the tested limb was ixed against
the seat by means of a belt, and the contralateral
limb was allowed to hang free. The tested leg was weighted to correct for the effects of gravity on the torque measured, according to the speciications of the Biodex Manual. To assess muscular performance, the participants were asked to perform alternating concentric contractions of the knee flexors and extensors within a range of motion of 85° (90° to 5° of lexion). During the test, the participants were instructed to keep the maximum force throughout the entire range of motion. In addition, they were encouraged to go faster and never stop until the end
of the assessment. The participants were allowed to familiarize themselves with the procedures before
actual testing by performing 3 repetitions of the tested
motion. Then they performed a set of 5 repetitions at
60°/s. When the Coeficient of Variation (CV) of the Peak Torque was higher than 10%8, the athlete was
allowed to rest and the set was repeated.
Variables selection
Sixteen variables available in the Comprehensive Evaluation Reports generated by Biodex Software were selected to be included in this study: Peak Torque, Time to Peak Torque, Angle of Peak Torque, Torque at 30°, Torque at 0.18 s, Coeficient of Variation, Maximum Work, Maximum Work Repetition Number, Total Work, Work Last Third, Work First Third, Work Fatigue Percentage, Average Power, Acceleration Time, Deceleration Time, and Average Peak Torque. The windowing option was turned on to guarantee that only the isokinetic portion (above 70% of the preset speed) of the test was used. Peak Torque and Maximum Work normalized by bodyweight were not included in the analysis, since
normalization would make the results dependent on the individual’s mass. Another variable not used in
the present study was the Agonist:antagonist ratio, as it does not pertain to the assessment of a speciic muscle group.
Statistical analysis
The present study used an exploratory factor
analysis to identify the factors that could accurately characterize muscular performance. This approach assumes the presence of associations and redundancy
among the variables included in the isokinetic report. Factor analysis is a set of statistical techniques used to explain the relationship between original observed variables and non-observed variables (factors). Therefore, the number of factors identiied is lower than the number of original variables analyzed. Each factor characterizes one theoretical aspect (construct)
of muscular performance.
Initial exploratory factor analysis with varimax rotation was performed with the SPSS 15.0 statistical software (SPSS Inc., Chicago, IL, USA). The factors that exhibited an eigenvalue >1 were maintained. The Kaiser-Meyer-Olkin (KMO) measure of sampling
adequacy and Bartlett’s test of sphericity were run to
conirm the adequacy of factor analysis. The variables with communality values (proportion of common variance) lower than 0.6, as well as those with cross loadings over 0.4, were excluded from the analysis. These variables were excluded successively, and a new factor analysis was performed following the removal of each variable until the goodness-of-it of
the reduced model was attained.
In order to identify outliers for each factor of the
523 Braz J Phys Ther. 2014 Nov-Dec; 18(6):521-529
analysis was performed. To validate the model
relative to the knee extension torque curve data, the
sample was randomly divided into 2 subsamples
(“split-sample” method), and factor analysis was
performed in each subsample to assess whether
the initial factor structure was maintained. Finally, to investigate the capacity of generalization of the inal factor structure, a second exploratory factor
analysis, which included all the variables used in the
irst analysis, was performed using the knee lexion
torque curve data. The similarity between the factor
structures generated based on the knee extension and lexion data was assessed by means of Tucker’s congruence coeficient.
Results
Upon initial exploratory analysis (n=235), Bartlett’s test of sphericity was signiicant (p<0.0001), and the KMO measure of sampling adequacy was 0.700,
which indicated that factor analysis was appropriate for the data in the present study. These results pointed to the presence of 5 factors that clearly represented different features of muscular performance, and we
chose to maintain this initial (5-factor) structure in
the subsequent analyses (Table 1).
Application of the procedures to reduce the number
of variables in the model resulted in the exclusion of 5 variables. The Coeficient of Variation was the irst variable to be excluded (communality = 0.522). Next, the variables Torque at 30°, Time to Peak Torque, Average Power, and Peak Torque at 0.18 s were successively excluded (cross loading >0.4). Following the identiication and removal of outliers of the resultant scores (n=219), the reduced model of exploratory factor analysis of the knee extension data explained 90.746% of the total variability of the data. The KMO value was 0.723, and Bartlett’s test of sphericity was significant (p<0.0001), indicating that factor analysis was appropriate for the investigated dataset. The variables exhibited adequate
communality values (Table 2).
Factor analysis of the 2 randomized subsamples (n1=110, n2=109) exhibited KMO values of 0.698 and 0.683, respectively. Bartlett’s test of sphericity was significant (p<0.0001) in both samples. The total explained variance of the data in these subsamples was 91.288% and 90.537%, respectively (Table 3). These 2 analyses converged towards the
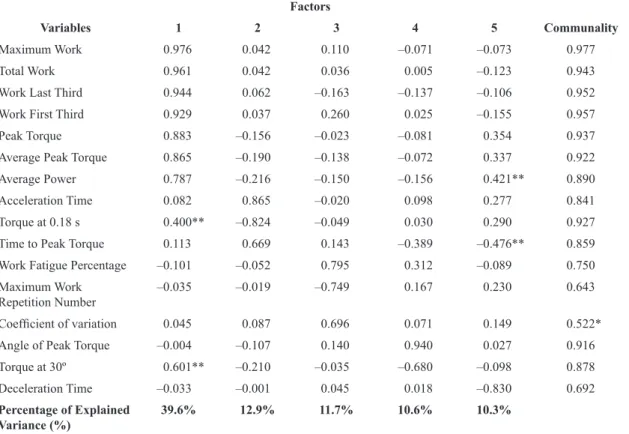
Table 1. Factor structure of knee extensor isokinetic assessment data disclosed by the initial exploratory factor analysis.
Factors
Variables 1 2 3 4 5 Communality
Maximum Work 0.976 0.042 0.110 –0.071 –0.073 0.977
Total Work 0.961 0.042 0.036 0.005 –0.123 0.943
Work Last Third 0.944 0.062 –0.163 –0.137 –0.106 0.952
Work First Third 0.929 0.037 0.260 0.025 –0.155 0.957
Peak Torque 0.883 –0.156 –0.023 –0.081 0.354 0.937
Average Peak Torque 0.865 –0.190 –0.138 –0.072 0.337 0.922
Average Power 0.787 –0.216 –0.150 –0.156 0.421** 0.890
Acceleration Time 0.082 0.865 –0.020 0.098 0.277 0.841
Torque at 0.18 s 0.400** –0.824 –0.049 0.030 0.290 0.927
Time to Peak Torque 0.113 0.669 0.143 –0.389 –0.476** 0.859
Work Fatigue Percentage –0.101 –0.052 0.795 0.312 –0.089 0.750
Maximum Work
Repetition Number –0.035 –0.019 –0.749 0.167 0.230 0.643
Coeficient of variation 0.045 0.087 0.696 0.071 0.149 0.522*
Angle of Peak Torque –0.004 –0.107 0.140 0.940 0.027 0.916
Torque at 30º 0.601** –0.210 –0.035 –0.680 –0.098 0.878
Deceleration Time –0.033 –0.001 0.045 0.018 –0.830 0.692
Percentage of Explained Variance (%)
39.6% 12.9% 11.7% 10.6% 10.3%
Amaral GM, Marinho HVR, Ocarino JM, Silva PLP, Souza TR, Fonseca ST
524 Braz J Phys Ther. 2014 Nov-Dec; 18(6):521-529
same structure in the inal model, which therefore
supported its validation.
In the exploratory factor analysis of the knee lexion data, Bartlett’s test of sphericity was also signiicant (p<0.0001), the KMO value was 0.718, and the explanatory percentage was 91.322% (Table 4). Tucker’s congruence coeficient between the lexion model and the inal extension model was 0.95, thus indicating high similarity between
models. These results demonstrate the capacity of
generalization of the inal model obtained from the knee extensor isokinetic assessment data to the knee lexor isokinetic assessment data at 60º/s.
Discussion
The results indicated that the set of variables included in knee isokinetic assessment reports
could be represented by 5 factors, which together explained more than 90% of the variance in data. On
the one hand, the results indicate much redundancy in the information provided by the variables
currently included in isokinetic assessments; on
the other, they indicate that 5 different domains of muscular performance are represented by this set
of variables. These domains were deined as torque generation capacity, variation in torque generation capacity along repetitions, movement deceleration capacity, mechanical/physiological factors of torque generation, and acceleration capacity (torque development). The identiication of these domains
should enable a more systematic and optimized interpretation of the data in isokinetic assessments.
Five variables were not included in the final
model. The CV had a low communality with the other variables, which is due to the fact that this
variable was controlled in our study. The remaining variables (Time to Peak Torque, Torque at 30°, Torque at 0.18 s, and Average Power) had cross loading >0.4 for more than one factor (i.e. they bring ambiguous information to test interpretation). For example, Time to Peak Torque and Torque at 30° depend on
multiple attributes, such as the individual’s capacity to produce torque and to accelerate the limb, as well
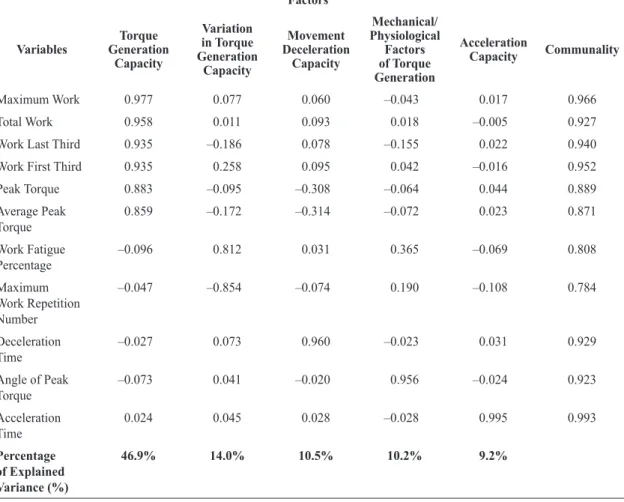
Table 2. Factor structure of knee extensor isokinetic assessment data disclosed by the inal exploratory factor analysis.
Factors
Variables
Torque Generation
Capacity
Variation in Torque Generation
Capacity
Movement Deceleration
Capacity
Mechanical/ Physiological
Factors of Torque Generation
Acceleration
Capacity Communality
Maximum Work 0.977 0.077 0.060 –0.043 0.017 0.966
Total Work 0.958 0.011 0.093 0.018 –0.005 0.927
Work Last Third 0.935 –0.186 0.078 –0.155 0.022 0.940
Work First Third 0.935 0.258 0.095 0.042 –0.016 0.952
Peak Torque 0.883 –0.095 –0.308 –0.064 0.044 0.889
Average Peak Torque
0.859 –0.172 –0.314 –0.072 0.023 0.871
Work Fatigue
Percentage –0.096 0.812 0.031 0.365 –0.069 0.808
Maximum Work Repetition Number
–0.047 –0.854 –0.074 0.190 –0.108 0.784
Deceleration Time
–0.027 0.073 0.960 –0.023 0.031 0.929
Angle of Peak Torque
–0.073 0.041 –0.020 0.956 –0.024 0.923
Acceleration Time
0.024 0.045 0.028 –0.028 0.995 0.993
Percentage of Explained Variance (%)
Muscular
per
formance: isokinetic v
ar
iables
525
Br
az J Ph
y
s Ther
. 2014 No
v
-Dec; 18(6):521-529
Factors in random sample 1 Factors in random sample 2
Variables
Torque Generation
Capacity
Variation in Torque Generation
Capacity
Movement Deceleration
Capacity
Mechanical/ Physiological
Factors of Torque Generation
Acceleration
Capacity Communality
Torque Generation
Capacity
Variation in Torque Generation
Capacity
Movement Deceleration
Capacity
Mechanical/ Physiological
Factors of Torque Generation
Acceleration
Capacity Communality
Maximum
Work
0.983 0.041 –0.293 –0.052 0.030 0.974 0.965 0.139 0.047 –0.055 0.022 0.957
Total Work 0.988 0.008 0.056 0.004 –0.006 0.979 0.917 0.045 0.138 0.03 –0.004 0.863
Work Last
Third
0.942 0.203 0.108 –0.129 0.021 0.957 0.926 –0.154 0.049 –0.188 0.04 0.920
Work First
Third
0.956 –0.199 0.062 0.049 –0.002 0.960 0.899 0.349 0.124 0.017 –0.036 0.947
Peak Torque 0.905 0.041 –0.293 –0.052 0.030 0.911 0.866 –0.167 –0.303 –0.059 0.051 0.875
Average
Peak Torque 0.885 0.115 –0.287 –0.057 –0.006 0.883 0.838 –0.243 –0.32 –0.066 0.046 0.870
Work Fatigue
Percentage –0.064 –0.811 –0.104 0.353 –0.065 0.801 –0.141 0.812 0.126 0.349 –0.102 0.828
Maximum
Work Repetition
Number
–0.012 0.816 –0.127 0.218 –0.137 0.747 –0.101 –0.886 –0.056 0.150 –0.110 0.833
Deceleration
Time
–0.050 –0.025 0.963 –0.020 –0.051 0.934 –0.008 0.115 0.949 –0.013 0.100 0.925
Angle of
Peak Torque –0.064 –0.031 –0.009 0.950 0.027 0.908 –0.085 0.056 –0.014 0.967 –0.063 0.949
Acceleration Time
0.017 –0.065 –0.052 0.022 0.989 0.987 0.031 0.027 0.095 –0.068 0.988 0.991
Percentage of Explained
Variance (%)
Amaral GM, Marinho HVR, Ocarino JM, Silva PLP, Souza TR, Fonseca ST
526 Braz J Phys Ther. 2014 Nov-Dec; 18(6):521-529
as on muscle length. Thus, the non-inclusion of these
variables eliminated redundant information from the
test results, as speciic aspects of muscle performance
were better captured by other variables available in the isokinetic report.
The irst factor included the variables that were
related to the construct of Torque Generation
Capacity. Higher values for these variables were associated with greater torque generation capacity in athletes. This factor captured the largest percentage of the data variability (46.9% of the total variance). The 4 variables that exhibited the greatest factor loading were Maximum Work (0.977), Total Work (0.958), Work First Third (0.935), and Work Last Third (0.935), and these variables also exhibited strong mutual correlation (>0.90). Work, calculated
as the area under the force vs. displacement curve,
represents the energy spent by muscle exertion during motion (product of torque times angular displacement)4,9,10. Maximum Work represents the
capacity to generate muscle torque throughout the full range of the movement repetition that exhibits the greatest muscle work production4,9. Total Work
represents the sum of the work calculated for each repetition9, and Work First Third and Work Last Third represent the amount of work performed in
those stages of movement in all the test repetitions taken together11. This factor was also represented by
the variables Peak Torque and Average Peak Torque, with factor loading values of 0.883 and 0.859, respectively. Peak Torque represents the maximum torque generated at a single point of the entire range of motion among all test repetitions9, whereas
Average Peak Torque represents the mean value of the maximum torque generated in all 5 repetitions11. The
high association between Peak Torque and Average Peak Torque was expected, since only tests with small Coeficient of Variation (<10%) were allowed in this study. When this criterion is not observed and large
variation occurs, lower association between these
variables can be expected.
The variable Maximum Work best represented torque generation capacity because it exhibited the greatest factor loading for the irst factor, in addition to strong correlation with the variables Total Work, Work First Third, and Work Last Third. Although Peak Torque (factor loading of 0.883) has been the
variable most widely used in the interpretation of isokinetic assessments, the results of the present
study reinforce the need to measure Maximum
Work to achieve an accurate characterization of the
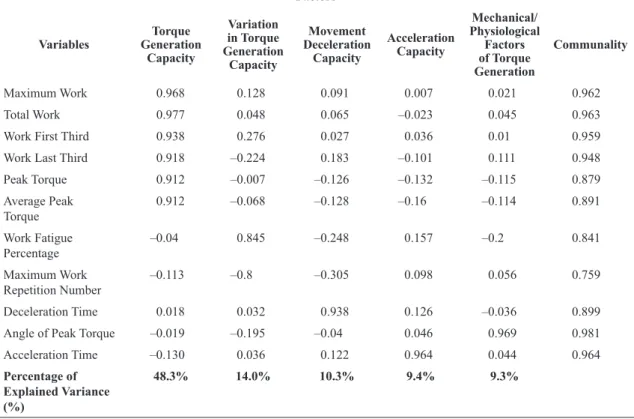
torque generation capacity. Therefore, the variable Table 4. Factor structure of knee lexor isokinetic assessment data disclosed by the exploratory factor analysis.
Factors
Variables
Torque Generation
Capacity
Variation in Torque Generation
Capacity
Movement Deceleration
Capacity
Acceleration Capacity
Mechanical/ Physiological
Factors of Torque Generation
Communality
Maximum Work 0.968 0.128 0.091 0.007 0.021 0.962
Total Work 0.977 0.048 0.065 –0.023 0.045 0.963
Work First Third 0.938 0.276 0.027 0.036 0.01 0.959
Work Last Third 0.918 –0.224 0.183 –0.101 0.111 0.948
Peak Torque 0.912 –0.007 –0.126 –0.132 –0.115 0.879
Average Peak Torque
0.912 –0.068 –0.128 –0.16 –0.114 0.891
Work Fatigue
Percentage –0.04 0.845 –0.248 0.157 –0.2 0.841
Maximum Work
Repetition Number –0.113 –0.8 –0.305 0.098 0.056 0.759
Deceleration Time 0.018 0.032 0.938 0.126 –0.036 0.899
Angle of Peak Torque –0.019 –0.195 –0.04 0.046 0.969 0.981
Acceleration Time –0.130 0.036 0.122 0.964 0.044 0.964
Percentage of Explained Variance (%)
527 Braz J Phys Ther. 2014 Nov-Dec; 18(6):521-529 Peak Torque should not be used alone to represent
that construct, as it could lead to errors in the interpretation of the results. The limited ability of
Peak Torque to characterize the torque generation
capacity of an individual may be related to the fact
that it corresponds to the torque generated at a single point of the entire range of motion. Conversely, the variable Maximum Work provides information on the ability of the muscle to generate torque throughout the entire range of motion4. Within that context,
individuals able to generate high peak torque do not systematically exhibit the greatest values for Maximum Work4. Moreover, high Peak Torque values
not associated with Maximum Work values may
indicate a condition in which the assessed individual
is able to generate high torque at a given point but cannot maintain that level of performance throughout the entire range of motion of the knee joint. The results of the present study therefore suggest that both variables (i.e. Maximum Work and Peak Torque) should be included in reports to achieve a thorough characterization of torque generation capacity related
to muscular performance12.
The second factor identiied was represented by the variables Maximum Work Repetition Number (–0.854) and Work Fatigue Percentage (0.812),
which were associated with the Variation in Torque
Generation Capacity. This factor contributed 14% of the total explained variance and provided information
on the consistency of muscular performance, i.e. the
maintenance of torque generation capacity during repetitions. The discrete variable Maximum Work Repetition Number represents the number of the repetition (i.e. 1, 2, 3, 4 or 5) in which the curve exhibited its greatest magnitude11. The variable Work
Fatigue Percentage represents the percent reduction in the work generated between the irst and last
thirds of the series of repetitions13,14. For lower scores
corresponding to this variable, there is generally greater consistency in muscular performance13,14.
However, this analysis must be performed with caution because this variable was calculated based on only 5 repetitions at a velocity of 60º/s, and it merely represents the effect of the variation of
performance between the beginning and the end of the test. Therefore, in the present study, Work Fatigue Percentage seems to have provided information concerning performance variability. Furthermore, the variable Maximum Work Repetition Number exhibited an inverse correlation with this factor. In other words, the later the Maximum Work repetition
occurs, the lower the variability in the response is.
Due to the weak correlation between these variables
(–0.416), combined use of both may provide information on the ability to maintain the generated torque during repetitions, which is considered to be
indicative of muscle endurance or the neuromuscular
ability to keep torque generation constant13,14.
The third factor captured the movement deceleration capacity, represented by the variable
Deceleration Time, and contributed to 10.5% of the total variance. Deceleration Time represents
the total time to reduce isokinetic velocity to 0º/s at
the end of the motion. During an isokinetic testing, the equipment imposes increasing resistance to any
torque that attempts to produce movement speeds
greater than that selected for the test. Considering
that a proper isokinetic assessment requires that the
individual produce maximum torque at any point during the test (resulting in an adequate test speed), the Deceleration Time may characterize the capacity of the individual to maintain maximum torque, at the required speed, close to the end of the tested range of motion (in a position in which the muscle is close to active insuficiency). Thus, greater Deceleration
Time values may be associated with lower capacity
to maintain torque at the extremes of the range
of motion. As this variable represents a different condition in comparison to the other variables,
it may add relevant information concerning the
isokinetic test15. Although it is seldom reported in
studies, this variable represents a domain of muscular
performance that should not be neglected.
The fourth factor was represented by the Angle of Peak Torque, which corresponded to 10.2% of the total explained variance. This factor was associated with the muscle function domain that we deined as Mechanical/Physiological Factors of Torque Generation. The Angle of Peak Torque corresponds to the position of the joint at the moment when Peak Torque is generated7,16-18. Therefore, this variable
represents the optimal point of the torque vs. angular
displacement curve for torque development and
is related to the interaction between physiological factors such as optimal muscle length (length-tension relationship) and mechanical factors (changes in the angle of insertion/lever arm during rotatory motion) during performance assessment16,18. The
interpretation of this variable must take into account
not only the absolute values of angulation but also the representation of such angulation relative to the activity of interest. For instance, the Angle of Peak Torque values for the knee lexors and extensors of soccer players were shown to be signiicantly
Amaral GM, Marinho HVR, Ocarino JM, Silva PLP, Souza TR, Fonseca ST
528 Braz J Phys Ther. 2014 Nov-Dec; 18(6):521-529
that does not meet the speciic demands of various sports may be associated with a higher incidence of
injuries17,19.
The ifth factor was associated with the muscular
performance domain that we termed acceleration capacity. Acceleration time was the only variable that contributed to this factor, and this variable corresponds to the time needed for the limb to reach
the velocity pre-established for the isokinetic test when starting from the rest position. Furthermore,
this variable may be considered an indicator of an individual’s neuromuscular capacity to develop torque quickly1,20-22. Reduced Acceleration Time
values may denote superior muscle iber recruitment
capacity of tested muscles and may be associated
with shorter latency for torque generation in such
muscles20-22. However, the ability to generate high
torque values may not sufice to ensure adequate
performance, as the speed with which torque is developed must also be taken into account for the characterization of muscular performance. Thus, for a complete assessment, Acceleration Time should be included to address neuromuscular factors related to muscular performance21,22. However, it is important
to notice that this variable can be more relevant in
test conditions involving higher velocities. In these
situations, the acceleration demand is more evident and the acceleration capability is crucial for overall performance in the test.
The aforementioned results were reproduced in the
analysis of the 2 randomized subsamples generated
from the initial sample, the factor structure found in
the analysis of knee extensor isokinetic assessment
data was therefore fully validated. In addition, this
model was also stable during the analysis of the data resulting from isokinetic assessment of another variety of movement (knee lexion). Although there
was an inversion in the distribution for the variables
Angle of Peak Torque and Acceleration Time in factors 4 and 5 in the analysis of knee lexor isokinetic
assessment data (Table 4), the structure of each factor
was maintained (i.e. the way in which these variables were distributed among the different factors remained the same), which may be related to the very similar percentages of variance explained by those factors (i.e. 9.4% and 9.3%, relative to the lexor data).
This inversion in the distribution of the variables does not invalidate the structure of the reduced model because the same 5 constructs were still represented. Therefore, muscular performance could be characterized by means of 5 distinct domains.
Factor analysis enabled the identification of 5 different domains that together provided information
concerning muscular performance in knee lexion-extension isokinetic assessment at a velocity of 60º/s in young athletes. Caution is recommended when generalizing the results for different velocities or
populations. The results of the present study point to the relevance of the analysis and the inclusion of variables that represent distinct constructs but are
often neglected in the interpretation of isokinetic
assessments.
Conclusions
The present study identified five factors that were accurately represented by only a few variables included in isokinetic reports. Each factor represents a different dimension of muscular performance.
Our results suggest that Maximum Work should
be systematically reported to characterize torque
generation capacity. The constructs movement
acceleration and deceleration capacity must be more
thoroughly explored in future studies, as they provide
different information to that supplied by variables
describing torque generation capacity. Finally, variability in torque generation capacity and the contribution of mechanical and physiological factors to torque generation may be accurately represented by variables of Maximum Work Repetition Number, Work Fatigue Percentage, and Angle of Peak Torque. Therefore, the use of just a few variables may sufice
to capture the full scope of information provided by isokinetic assessments.
Acknowledgements
To the Pro-Dean’s Office for Research of
Universidade Federal de Minas Gerais (UFMG),
Coordenação de Aperfeiçoamento de Pessoal de
Nível Superior (CAPES), Fundação de Amparo à
Pesquisa do Estado de Minas Gerais (FAPEMIG),
and Conselho Nacional de Desenvolvimento
Cientíico e Tecnológico (CNPq), Brazil.
References
1. Baltzopoulos V, Brodie DA. Isokinetic dynamometry. Applications and limitations. Sports Med. 1989;8(2):101 -16. http://dx.doi.org/10.2165/00007256-198908020-00003. PMid:2675256
529 Braz J Phys Ther. 2014 Nov-Dec; 18(6):521-529 3. Lehnert M, Urban J, Procházka JIH, Psotta R. Isokinetic
strength of knee flexors and extensors of adolescent soccer players and its changes based on movement speed and age. Acta Univ Palacki Olomuc, Gymn. 2011;41(2):45-53. 4. Perrin DH, Robertson RJ, Ray RL. Bilateral isokinetic
peak torque, torque acceleration energy, power, and work relationships in athletes and nonathletes. J Orthop Sports Phys Ther. 1987;9(5):184-9. http://dx.doi.org/10.2519/ jospt.1987.9.5.184. PMid:18797005
5. Wilk KE. Isokinetic testing: goals, standards and knee test interpretation. In: Biodex Medical System. Biodex Multi-Joint System: clinical resource manual. New York: Biodex Medical System; 1991. p. 5-10.
6. Pincivero DM, Heller BM, Hou SI. The effects of ACL injury on quadriceps and hamstring torque, work and power. J Sports Sci. 2002;20(9):689-96. http://dx.doi. org/10.1080/026404102320219392. PMid:12200920 7. Cramer JT, Housh TJ, Johnson GO, Weir JP, Beck
TW, Coburn JW. An acute bout of static stretching does not affect maximal eccentric isokinetic peak torque, the joint angle at peak torque, mean power, electromyography, or mechanomyography. J Orthop Sports Phys Ther. 2007;37(3):130-9. http://dx.doi.org/10.2519/ jospt.2007.2389. PMid:17416128
8. Brown LE, Whitehurst M. Load range. In: Brown LE, editor. Isokinetics in human performance. Champaign: Human Kinetics; 2000. p. 456.
9. Dvir Z. Hardware, test parameters and issues in testing. In: Dvir Z. Isokinetics: muscle testing, interpretation, and clinical applications. New York: Churchill Livingstone; 2004. p. 25-48.
10. English R, Brannock M, Chik WT, Eastwood LS, Uhl T. The Relationship between lower extremity isokinetic work and single-leg functional hop-work test. J Sport Rehabil. 2006;15:95-104.
11. Biodex Medical System. System 3: structures, formulas and calculations. In: Biodex Medical System. Biodex System 3 advantage software: operations manual. New York: Biodex Medical System; 1991. p. 1-11.
12. Carregaro RL, Cunha RR, Cardoso JR, Pinto RS, Bottaro M. Effects of different methods of antagonist muscles pre-activation on knee extensors neuromuscular responses. Rev Bras Fisioter. 2011;15(6):452-9. http://dx.doi. org/10.1590/S1413-35552011005000028. PMid:22031273 13. De Ste Croix MBA, Deighan MA, Ratel S, Armstrong N.
Age- and sex-associated differences in isokinetic knee muscle endurance between young children and adults. Appl Physiol Nutr Metab. 2009;34(4):725-31. http://dx.doi. org/10.1139/H09-064. PMid:19767809
14. Silva JP, Pereira DS, Coelho FM, Lustosa LP, Dias JM, Pereira LS. Clinical, functional and inflammatory factors associated with muscle fatigue and self-perceived
fatigue in elderly community-dwelling women. Rev Bras Fisioter. 2011;15(3):241-8. http://dx.doi.org/10.1590/S1413-35552011000300011. PMid:21829989
15. Ben Moussa Zouita A, Majdoub O, Ferchichi H, Grandy K, Dziri C, Ben Salah FZ. The effect of 8-weeks proprioceptive exercise program in postural sway and isokinetic strength of ankle sprains of Tunisian athletes. Ann Phys Rehabil Med. 2013;56(9-10):634-43. http://dx.doi.org/10.1016/j. rehab.2013.08.003. PMid:24169071
16. Aquino CF, Fonseca ST, Gonçalves GGP, Silva PLP, Ocarino JM, Mancini MC. Stretching versus strength training in lengthened position in subjects with tight hamstring muscles: a randomized controlled trial. Man Ther. 2010;15(1):26-31. http://dx.doi.org/10.1016/j. math.2009.05.006. PMid:19632878
17. Brockett CL, Morgan DL, Proske U. Predicting hamstring strain injury in elite athletes. Med Sci Sports Exerc. 2004;36(3):379-87. http://dx.doi.org/10.1249/01. MSS.0000117165.75832.05. PMid:15076778
18. Brughelli M, Cronin J, Nosaka K. Muscle architecture and optimum angle of the knee flexors and extensors: a comparison between cyclists and Australian Rules football players. J Strength Cond Res. 2010;24(3 ):717-21. http://dx.doi.org/10.1519/JSC.0b013e318197009a. PMid:19816221
19. O’Connor D. Groin injuries in professional rugby league players: a prospective study. J Sports Sci. 2004;22 (7):629-36. http://dx.doi.org/10.1080/02640410310001655804. PMid:15370493
20. Jaric S. Changes in movement symmetry associated with strengthening and fatigue of agonist and antagonist muscles. J Mot Behav. 2000;32(1):9-15. http://dx.doi. org/10.1080/00222890009601355. PMid:11008267 21. Chen WL, Su FC, Chou YL. Significance of acceleration
period in a dynamic strength testing study. J Orthop Sports Phys Ther. 1994;19(6):324-30. http://dx.doi.org/10.2519/ jospt.1994.19.6.324. PMid:8025571
22. van Cingel RE, Kleinrensink G, Uitterlinden EJ, Rooijens PPGM, Mulder PGH, Aufdemkampe G, et al. Repeated ankle sprains and delayed neuromuscular response: acceleration time parameters. J Orthop Sports Phys Ther. 2006;36(2):72-9. http://dx.doi.org/10.2519/ jospt.2006.36.2.72. PMid:16494074
Correspondence Giovanna Mendes Amaral