1 College of Physical Education (CEFIS), Universidade Federal do Vale do São Francisco (UNIVASF), Petrolina, PE, Brazil 2 Graduate Program in Physical Education, Universidade de Brasília (UnB), Brasília, DF, Brazil
3 Graduate Program in Physical Education, Universidade Estadual de Londrina (UEL), Londrina, PR, Brazil 4 Graduate Program in Physical Education and Health, Universidade Católica de Brasília (UCB), Brasília, DF, Brazil
Received: 01/23/2013 Revised: 06/10/2013 Accepted: 08/11/2013
a r t i c l e
Combined exercise circuit session acutely attenuates
stress-induced blood pressure reactivity in healthy adults
Sérgio R. Moreira1, Ricardo M. Lima2, Karina E. S. Silva3, Herbert G. Simões4
ABSTRACT | Objective: To investigate the blood pressure (BP) responses to cardiovascular stress test after a combined exercise circuit session at moderate intensity. Method: Twenty individuals (10 male/10 fem; 33.4±6.9 years; 70.2±15.8 kg; 170.4±11.5 cm; 22.3±6.8% body fat) were randomized in a different days to control session with no exercise or exercise
session consisting of 3 laps of the following circuit: knee extension, bench press, knee lexion, rowing in the prone
position, squats, shoulder press, and 5 min of aerobic exercise at 75-85% of age-predicted maximum heart rate and/or 13 on the Borg Rating of Perceived Exertion [scale of 6 to 20]. The sets of resistance exercise consisted of 15 repetitions at ~50% of the estimated 1 repetition maximum test. Systolic blood pressure (SBP) and diastolic blood pressure (DBP) were measured at rest and during 1h of recovery in both experimental sessions. After that, blood pressure reactivity (BPR) was evaluated using the Cold Pressor Test. Results: During 1h of exercise recovery, there was a reduction in SBP (3-6 mmHg) and DBP (2-5 mmHg) in relation to pre-session rest (p<0.01), while this reduction was not observed in the control session. A decline in BPR (4-7 mmHg; p<0.01) was observed 1h post-exercise session, but not in the control
session. Post-exercise reductions in SBP and DBP were signiicantly correlated with BPR reductions (r=0.50-0.45; p<0.05). Conclusion: A combined exercise circuit session at moderate intensity promoted subsequent post-exercise hypotension and acutely attenuated BPR in response to a cardiovascular stress test. In addition, the post-exercise BP reduction was correlated with BPR attenuation in healthy adults of both genders.
Keywords: blood pressure reduction; vascular reactivity; movement. Clinical Trials Registration: NCT01935895.
HOW TO CITE THIS ARTICLE
Moreira SR, Lima RM, Silva KES, Simões HG. Combined exercise circuit session acutely attenuates stress-induced blood pressure reactivity in healthy adults. Braz J Phys Ther. 2014 Jan-Feb; 18(1):38-46. http://dx.doi.org/10.1590/S1413-35552012005000135
Introduction
The daily stress levels of the general population have been increasing over the last decades1. Frequent
exposure to stress is considered an important risk factor for the development of cardiovascular diseases2. Another well-documented risk factor for
cardiovascular disease is systemic hypertension which, in turn, has been related to elevated blood pressure reactivity (BPR) to stress3,4. Exacerbated
BPR may suggest poor autonomic modulation due to increased sympathetic drive, a condition that has been associated with medium to long-term cardiovascular complications5. Also, some
reports6,7 have demonstrated that individuals who
are hyperreactive to stress chronically increase their risk for psychological disorders such as anxiety, irritability, and frustration. These feelings are
associated with increased sympathetic drive induced by chronic elevation in BP7,8.
Maintaining BP within the normal range can require changes in lifestyle including good nutrition and regular physical activity9,10. Several studies have
attempted to examine the immediate (acute) beneits of
exercise both for healthy individuals11 and those with
cardiometabolic disorders12,13. These studies observed
the signiicant effects of exercise, particularly on hemodynamic control, due to a phenomenon deined
as “post-exercise hypotension”14. Moreover, 24h
Although the hemodynamic beneits of aerobic
and resistance exercises have been documented in a variety of reports5,7,9,10-15, the acute effects of the
aforementioned exercise modes combined in a circuit method on post-exercise BP, including the responses to a cardiovascular stress test, warrant further investigation. Therefore, the purpose of the present study was to examine the acute BP and stress-induced BPR responses following a circuit training session composed of both resistance and aerobic exercises at moderate intensity. Based on the literature11-15,
we hypothesized that the proposed circuit training session would promote post-exercise hypotension and that this phenomenon would be associated with attenuated stress-induced BPR.
Method
To test the hypothesis of the present study, volunteers were invited to participate in two randomly assigned sessions at the exercise physiology laboratory as follows: 1) combined resistance and aerobic exercises performed in a circuit format; and 2) a control session without exercise. In both sessions, BP was measured at rest and every 15 minutes post-session during 1 hour of recovery following the exercise and non-exercise control sessions. In addition, BPR was evaluated using a cardiovascular stress test before and after the experimental sessions. The relationship between post-exercise BP and BPR response to stress test was also examined.
Subjects
Twenty apparently healthy individuals of both genders (10 men and 10 women), with a mean age of 33.4±6.9 years (24-50 years), weight of 70.2±15.8 kg (45-96 kg), height of 170.4±11.5 cm (149-192 cm), body mass index (BMI) of 23.9±3.5 kg/m2(–1)
(19.2-23.7 kg/m2(–1)), and body fat percentage of
22.3±6.8% (8.5-35.0%), volunteered to participate.
The classiication of the subjects as “apparently
healthy” was based on the American College of Sports
Medicine (ACSM) guidelines for risk stratiication
of 1995 (interview to gather information on signs, symptoms and/or cardiopulmonary risk factors).
None of the subjects were using any medication
or had a history of diagnosed cardiovascular or metabolic disease.
The study was conducted in accordance with the Declaration of Helsinki and was approved by the Ethics Committee of Universidade Federal do Vale do São Francisco, Petrolina, PE, Brazil (protocol 0047.0.441.000-10). All participants were informed
of the experimental methods before giving written consent.
Anthropometric assessment
Standard procedures were used to measure weight, height, and body mass index (BMI). Body density was
determined according to speciications by Jackson
and Pollock16 for men ([1.1093800 – 0.0008267 *
(sum of skinfolds of the chest, abdomen and thigh) + 0.0000016 * (sum of skinfolds of the chest, abdomen, and thigh)2 –0.0002574 * age]) and
Jackson et al.17 for women ([1.0994921 – 0.0009929 *
(sum of skinfolds of the triceps, suprailiac, and thigh) + 0.0000023 * (sum of skinfolds of the triceps, suprailiac, and thigh)2 –0.0001392 * age]). Body fat
percentage was derived from Siri equation ([4.91 / density – 4.5] * 100).
Blood pressure measurement
All BP measurements were taken by the same trained technician through the auscultatory method following previously described recommendations18,
using a stethoscope (Duo Sonic, Brazil) and a calibrated sphygmomanometer (Missouri®, São
Paulo, SP, Brazil) certiied by Inmetro (National
Institute of Metrology, Quality, and Technology). Measurements were taken from the left arm with the individual comfortably seated in a quiet room at a controlled temperature of 25 °C. The standard auscultatory method was tested against the automated and previously validated19 oscillometric method
(Microlife BP 3AC1-1, Microlife USA Inc., Dunedin, FL, USA). Another sample of 30 independent individuals of both genders rested for 10 minutes and their BP was randomly measured using both the auscultatory and oscillometric methods, the latter conducted by another blinded evaluator. Correlations between methods were r=0.90 (p<0.001) for systolic blood pressure (SBP) and r=0.80 (p<0.001) for diastolic blood pressure (DBP). Also, agreement between methods was evaluated using the Bland-Altman20 method. Mean differences were
3.9 mmHg [20.2/–12.4 mmHg] and –3.4 mmHg [10.5/–17.3 mmHg] for SBP and DBP, respectively.
Blood pressure reactivity (BPR) assessment
BPR measurements were performed using the
Cold Pressor Test (CPT) according to speciications
previously described by Hines and Brow3. These
right hand for 1 minute in water carefully maintained at 4 °C (Incoterm®, Porto Alegre, RS, Brazil). BP
measurements were respectively taken at 30 and 60 seconds of immersion through the auscultatory method. The two BP values were respectively named Peak30” and Peak60”, and the procedure is considered an index of BPR. BP was also measured 2 minutes after the end of immersion (After2’). Of note, the adoption of the auscultatory method for BP evaluation was due to the requirement of measurements at 30 and 60 seconds, which would not be possible using the automated oscillometric device.
Experimental sessions
The volunteers underwent two experimental sessions in random order on different days, 48 to 72 hours apart. The combined exercise session consisted of 3 laps of a circuit with 2 minutes of recovery between laps, including the following resistance and aerobic exercises: knee extension, bench press, knee flexion, rowing in the prone position, squat, shoulder press, and 5 minutes up and down a 15-cm high step at 75-85% maximum heart rate and/or 13 on the 15-point Borg Rating of Perceived Exertion (RPE), a scale that ranges from 6 to 2021. Resistance exercise loads were implemented
using dumbbells for upper body exercises and weights attached to lower limbs for lower body exercises. Each resistance exercise was performed in sets of 15 repetitions at 50% of the estimated 1 repetition maximum (1RM) as suggested by Tiggemann et al.22,23 with the use of the RPE21. The
resistance exercises were performed with rhythmic control (Metronome Plus®) of one second for the
concentric phase and one second for the eccentric phase. The control session was conducted under the same conditions as the combined exercise session,
with the exception that the subjects did not perform
exercises.
Measurements during the experimental sessions
Resting SBP, DBP, and mean arterial pressure (MAP) measurements were taken every 5 minutes over a 20-minute period and the average was considered for the analyses (Missouri®, São Paulo,
SP, Brazil). Also, BP was measured after each circuit lap and every 15 minutes during the 1 hour post-exercise recovery. The same timeline and measures were followed during the control session. The CPT was conducted before each session (after 20 minutes of rest) and one hour after the combined exercise and control sessions. Heart rate (HR) was also measured
during each exercise and at the respective moment in the control session (Pulse Tronic Club Trainer®,
Direction Technology Co. Ltd., Taiwan). The HR measurements were considered for aerobic exercise
control and identiication of the cardiovascular load
imposed by the experimental sessions. The RPE was taken during the combined exercise session for control of exercise intensity and the mean value considered for subsequent analyses21.
Statistical analysis
Data are presented using descriptive statistical procedures (mean, standard deviation, minimum and maximum values). The Shapiro-Wilk test was used to verify and present the normality of data distribution. Pearson’s correlation was used to examine the relationship between resting BP measured with auscultatory and oscillometric methods, as well as BPR in the different moments and the BP response during and after the exercise and control sessions. The Bland-Altman method20 was used to verify agreement
between the two BP measurement methods. The paired-samples t test was used to compare data for correspondent moments of experimental sessions. A two-way repeated measures ANOVA was conducted to compare BP and BPR responses within and between experimental sessions [Time (Pre vs. Post) * Session (Exercise vs. Control)]. Data were considered
signiicant at P<0.05, and statistical analyses were performed using the SPSS15.0 software (SPSS Inc., Chicago, IL, USA).
Results
Table 1 presents the mean values for HR and BP at rest and during both experimental sessions (exercise and control) as well as the mean RPE during the exercise session. The circuit training session elicited a mean cardiovascular intensity of 79±11% of maximum HR and a mean RPE of 13 in the 15-point Borg scale.
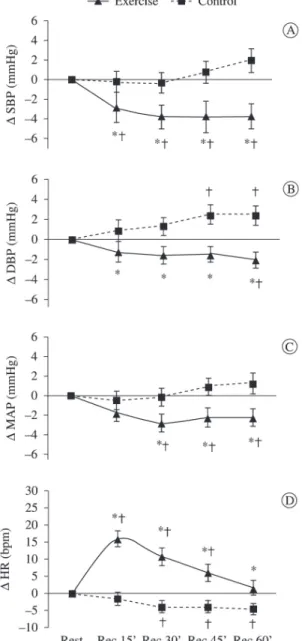
Figure 1 illustrates BP and HR responses within each experimental session as well as comparisons
between sessions. There was a signiicant decrease
in SBP for all evaluated moments after the circuit
training session (p<0.03). No signiicant changes
in SBP were observed after the control session. In
addition, SBP response was signiicantly different
in the circuit session when compared to the control
session (p<0.03). For DBP, a signiicant decrease
in relation to rest was observed 60 minutes after
the circuit session while a signiicant increase was
to Pre (p<0.05). Moreover, SBP was signiicantly
lower at the After2’ moment when comparing the Post-exercise session to Pre. For the control session, both SBP and DBP after the CPT (After2’) were
signiicantly elevated when compared to resting
(p<0.05). Figure 2A-B depicts BPR Pre and
Post-exercise sessions. Importantly, there was a signiicant
attenuation of BPR during and after the CPT post-exercise session when compared to the post-no exercise control session (p<0.01).
In order to show the importance of post-exercise hypotension in relation to the responses of BPR,
Table 1. Mean (±SD) of hemodynamic and perceptual variables at rest and during the exercise and control sessions (n=20).
Exercise Session
Control
Session p
Resting HR (bpm) 80±10 78±12 0.30 Session HR (bpm) 147±21 76±11 0.01 HR (%HR maximum) 79±11 41±5 0.01
RPE 13±1 -
-Resting SBP (mmHg) 114±12 113±12 0.74 Session SBP (mmHg) 135±15 112±11 0.01 Resting DBP (mmHg) 78±8 76±8 0.06 Session DBP (mmHg) 88±13 77±8 0.01
HR: Heart rate; RPE: Rate of perceived exertion; SBP: Systolic blood pressure; DBP: Diastolic blood pressure. p=comparison between Exercise and Control Sessions.
Figure 1. Range (mmHg) of systolic blood pressure (∆ SBP), diastolic blood pressure (∆ DBP), mean arterial pressure (∆ MAP), and heart rate (∆ HR) in the post-exercise session recovery
moments (Rec15’-Rec60’). *p<0.03 compared to Control session; †p<0.03 compared to Rest.
Moreover, DBP response was signiicantly different
in the circuit session when compared to the control session, with higher values for the latter in all of the measurement moments (p<0.03). For MAP, a
signiicant decrease in relation to rest occurred 30,
45, and 60 minutes after the circuit session, and these
moments were signiicantly different when compared
to the control session (p<0.03). When comparing the HR of the control and circuit sessions, all moments of recovery were different (p<0.03). However, the HR of the circuit session after 60 minutes of recovery did not differ from the resting HR pre-exercise (p>0.05).
Table 2 presents BPR before (Pre) and after (Post) the experimental sessions. It was observed that regardless of the measurement moment (i.e. Pre
or Post), the CPT elicited signiicant increases in
both SBP and DBP. However, BPR was signiicantly attenuated Post-exercise session when compared
Table 2. Mean (±SD) for blood pressure at rest and blood pressure reactivity responses during (Peak30” and Peak60”) and after (After2’) the Cold Pressor Test in the pre- (Pre) and post- (Post) experimental session.
SBP (mmHg) DBP (mmHg)
Exercise Control Exercise Control
Resting 114±12 113±12 78±8 76±8 Peak30” (Pre) 131±14* 129±14* 91±10* 91±9* Peak60” (Pre) 132±13* 130±14* 92±10* 90±10* After2’ (Pre) 115±12 115±13 79±9 79±10 Peak30” (Post) 127±13*† 130±14* 88±10*† 93±15* Peak60” (Post) 126±12*† 131±15* 89±10*† 91±11* After2’ (Post) 112±10† 117±13* 78±9 81±10*
Figure 3 presents the correlations between BPR and the mean BP response during one hour of recovery from the experimental sessions. Recovery BP
response was positive and signiicantly correlated
with BPR (p<0.05). Despite the moderate intensity of the correlations, they indicate that the greater the decrease in post-exercise BP is, the greater the attenuation of BPR during the CPT (Peak60”) will
be. In contrast, no signiicant correlations were found
between variables in the control session (p>0.05).
Discussion
The main findings of the present study were the occurrence of post-exercise hypotension after a circuit session involving aerobic and resistance exercises and the attenuation of BPR in response to
subsequent stress induction in apparently healthy adults of both genders. In addition, the observed results suggest that the post-exercise decrease in BP is associated with the attenuated BPR in response to a stressor test. Consistent with previous reports11-15,
it was observed post-exercise hypotension, however, research on this phenomenon after a combined aerobic and resistance exercise session is still necessary. Moreover, this investigation brings the
new inding that the magnitude of post-exercise
hypotension is associated with the degree of BPR attenuation during stress.
To our knowledge, this is the first study to investigate and compare BP responses and BPR before and after a circuit session of aerobic and resistance exercises in apparently healthy adults of both genders.
Signiicant acute cardiovascular effects of exercise
Figure 2. Range (∆ mmHg) of systolic blood pressure reactivity (SBPR) and diastolic blood pressure reactivity (DBPR) during (Peak30”
were observed that suggest a transient cardiovascular protection during rest and induced stress situations even in normotensive individuals. When examining absolute BP values during recovery, we found a favorable reduction only after the exercise session. In contrast, DBP had acutely increased after the control session. This acute exercise-induced reduction in BP was on average 6 and 5 mmHg for SBP and DBP, respectively (Figure 1A-B). Similarly, stress-induced BPR was signiicantly attenuated after the circuit
exercise session but not after the control session, reaching a mean difference of 7 mmHg (Figure 2A-B). The results presented here can have important clinical implications. Whelton et al.24 demonstrated
that small changes in BP over a long-term follow-up can have a relevant impact on cardiovascular disease
survival. More speciically, the authors showed that
reductions of 3 and 5 mmHg can reduce the risk of acute myocardial infarction by 8 to 14%, of coronary artery disease by 5 to 9%, and of overall mortality by 4 to 7%. Furthermore, they showed that a reduction of only 2 mmHg in both SBP and DBP is associated with a decrease of 6 to 14% and 4 to 6% in acute myocardial infarction and coronary artery disease, respectively. A small decrease of 2 mmHg in DBP was also associated with a reduction of 17% in hypertension prevalence in the general population.
Previous reports have demonstrated the protective effect of a single 30-minute exercise session performed at 70% of maximum oxygen consumption
on BP of hypertensive subjects during subsequent
activities of daily living25. These authors veriied an
attenuated BP response after exercise in comparison with a control session. Brownley et al.5 showed
exercise-induced attenuation of BPR in young
normotensive subjects in response to different modes
of stress induction (math and speech challenges). These observations were done while comparing stress responses between pre and post-aerobic exercise conditions. Similarly, in the present study, BPR was examined before and 60 minutes after a combined exercise circuit session. A protective effect of exercise was observed during the post-exercise recovery period in relation to the resting pre-exercise period (Figure 1A-C), at the same moments of pre-exercise cardiovascular stress (Table 2), and when comparing the same moments in the control session (Figure 2A-B). A new piece of evidence
found here was the signiicant relationship between
post-exercise BP (i.e. post-exercise hypotension) and BPR in response to the CPT (Figure 3). Therefore, it is possible that some mechanisms of exercise-induced post-exercise hypotension are the same as those underlying attenuated BPR after exercise.
Figure 3. Relationship between the variation in blood pressure reactivity during (Peak60”) the Cold Pressor Test post-session (Post-S) and the variation in systolic blood pressure (SBP) and diastolic blood pressure (DBP) after 1 hour of recovery. p<0.05 compared to
In this sense, the protective effect of exercise on BPR in response to stress would be dependent on its capability to elicit post-exercise hypotension, however, further investigation is needed.
Over the last decade, the mechanisms involved in the BP responses to a single bout of exercise have been investigated with a focus on the peripheral and neural pathways14,26. Although it was not within
the scope of the present study to investigate the mechanisms involved in post-exercise cardiovascular
responses, it is plausible that changes in barorelex
sensitivity and the consequent attenuation of sympathetic tone may be involved27. Previous
studies demonstrated a possible interaction between the release of P substance (a neuropeptide) from the terminals of sensory nerves during exercise and its receptor (NK1R) in the post-exercise recovery
period in conjunction with GABAergic activation.
This combination makes the nucleus of the solitary tract more active and consequently inhibits the activity of the ventrolateral medulla, reduces output to sympathetic nerves, finally promoting post-exercise hypotension. Therefore, it is possible that reduced sympathetic tonus is involved in the attenuated BPR during the CPT after a combined
exercise circuit session since a signiicant correlation
was noted between post-exercise BP and BPR, a condition determined through neural reflex4. In
contrast, exercise-induced nitric oxide release and thus peripheral resistance reduction may also be involved12,26,28. Future studies are necessary to
conirm the relationship between those mechanisms
and the present results.
Regarding the intensity of the combined exercise circuit protocol, there was a cardiovascular demand of 79±11% of age-predicted maximum HR and the mean RPE was 13±1 on the 15-point Borg scale (Table 1). Previous studies examined the acute effects on BP in different populations. Simões et al.13 showed the
occurrence of post-exercise hypotension in type 2 diabetics after a resistance exercise session performed at 43% of 1RM, in which the mean RPE was 11-13 on the Borg scale. Motta et al.12 investigated the
acute effects of aerobic exercise performed at 90% of the anaerobic threshold in adults of both genders and observed a cardiovascular demand of 80% of maximum HR and a mean RPE of 13, an intensity similar to the present study. If we also take into account other reports on RPE and blood lactate responses as indexes of resistance exercise29 and
aerobic exercise30 intensity, it is plausible to assume
that the combined exercise circuit examined in this study would correspond to a stimulus within the
moderate intensity domain. Therefore, exercise protocols within other intensity domains (i.e. intense or severe domains) should be analyzed.
In relation to the design of the experimental exercise session, the practical application is that a combined exercise circuit session involving both aerobic and resistance exercises constitutes an interesting option to attenuate subsequent cardiovascular stress with relatively short sessions (30-40 minutes). The circuit method is also considered more dynamic, which may
signiicantly inluence adherence and chronic beneits
(i.e. neuromuscular and cardiovascular adaptation). The main limitations of the present study were no measurements of BPR during activities of daily life and no measurements for a longer period but only during the CPT 1h post-exercise. It is speculated that this protective effect of combined exercise on BPR lasts for a longer period, however more research is needed to investigate this hypothesis. Furthermore,
the stress test was shown to be eficient in eliciting
cardiovascular stress regardless of the moment it was applied (pre or post-experimental sessions; Table 2). Another limitation was the non-measurement of heart rate variability and nitric oxide release. Those measurements would enable us to examine their
relationship with the observed indings and possibly
gather information regarding the mechanisms involved.
The results presented here can be useful for professionals involved in prescribing exercise for cardiovascular health. Apparently, healthy adults of both genders aiming to reduce cardiovascular stress, particularly BP and BPR, can beneit from circuit
training involving aerobic and resistance exercises, with duration ranging from 30 to 40 minutes. The training sessions can consist of a circuit of six resistance exercises, alternating lower and upper body muscle groups, followed by 5 minutes of aerobic exercise. The circuit can be performed in 3 laps with sets of 15 repetitions at 50% of the estimated 1RM or 13 on the 15-point Borg scale [6-20] for each resistance exercise and a 2-min recovery interval between laps. The aerobic exercise can be conducted using the linear model between 75-85% of age-predicted maximum HR and/or 13 on the Borg scale. Despite the potential practical applications of moderate-intensity combined exercise for decreasing BP and BPR, previous reports have demonstrated that post-exercise hypotension depends on the intensity13.
cardiovascular, and metabolic evaluation is strongly recommended.
Conclusions
A single circuit session of resistance and aerobic exercises performed at moderate intensity promoted
signiicant post-exercise decreases in BP. Moreover,
BPR measures were attenuated during this post-exercise hypotension condition. Finally, the decrease
in BP was signiicantly correlated with attenuated
BPR in healthy adults of both genders.
Acknowledgments
We are grateful to Conselho Nacional de
Desenvolvimento Científico e Tecnológico (CNPq),
Brazil (proc. 474328/2010-4) for their financial support. We also wish to extend our acknowledgments to Salvapé Produtos Ortopédicos Ltda. for donating the digital BP equipment.
References
1. Taylor M, Barr M, Stevens G, Bryson-Taylor D, Agho K, Jacobs J, et al. Psychosocial stress and strategies for managing adversity: measuring population resilience in New South Wales, Australia. Popul Health Metr. 2010;14:28. PMid:20942975 PMCid:PMC2965129. http://dx.doi.org/10.1186/1478-7954-8-28
2. Figueredo VM. The time has come for physicians to take notice: the impact of psychosocial stressors on the heart. Am J Med. 2009;122:704-12. PMid:19635269. http://
dx.doi.org/10.1016/j.amjmed.2009.05.001
3. Hines EA, Brow GE. The cold test pressor for measuring the reactibility of the blood pressure: data concerning 571
normal and hypertensive subjects. Am Heart J.
1936;11:1-9. http://dx.doi.org/10.1016/S0002-8703(36)90370-8 4. Wood DL, Sheps SG, Elveback LR, Schirger A.
Cold pressor test as a predictor of hypertension. Hypertension. 1984;6:301-6. PMid:6735451. http://dx.doi. org/10.1161/01.HYP.6.3.301
5. Brownley KA, Hinderliter AL, West SG, Girdler SS, Sherwood A, Light KC. Sympathoadrenergic mechanisms in reduced hemodynamic stress responses after exercise. Med Sci Sports Exerc. 2003;35:978-86. PMid:12783046. http://dx.doi.org/10.1249/01.MSS.0000069335.12756.1B 6. Lipp ME, Pereira MM, Justo AP, Matos TM. Cardiovascular reactivity in hypertensives: differential effect of expressing and inhibiting emotions during moments of interpersonal stress. Span J Psychol. 2006;9:154-61. PMid:17120695. 7. Lavie CJ, Milani RV. Depression, autonomic function,
and cardiorespiratory itness: comment on Hughes, et al.
(2010). Percept Mot Skills. 2011;112:319-21. PMid:21466105. http://dx.doi.org/10.2466/02.06.15.20. PMS.112.1.319-321
8. Das S, O’Keefe JH. Behavioral cardiology: recognizing and addressing the profound impact of psychosocial stress on cardiovascular health. Curr Hypertens Rep. 2008;10:374-81. PMid:18775114. http://dx.doi. org/10.1007/s11906-008-0070-6
9. Locks RR, Costa TC, Koppe S, Yamaguti AM, Garcia MC,
Gomes ARS. Effects of strength and lexibility training
on functional performance of healthy older people. Rev Bras Fisioter. 2012;16(3):184-90. PMid:22801513. http:// dx.doi.org/10.1590/S1413-35552012000300003 10. Gaesser GA, Angadi SS, Sawyer BJ. Exercise and diet,
independent of weight loss, improve cardiometabolic
risk proile in overweight and obese individuals. Phys
Sportsmed. 2011;39:87-97. PMid:21673488. http://dx.doi. org/10.3810/psm.2011.05.1898
11. Lizardo JHF, Simões HG. Efeitos de diferentes sessões de exercícios resistidos sobre a hipotensão pós-exercício. Rev Bras Fisioter. 2005;9(3):249-55.
12. Motta DF, Lima LC, Arsa G, Russo PS, Sales MM, Moreira SR, et al. Effect of type 2 diabetes on plasma kallikrein activity after physical exercise and its relationship to post-exercise hypotension. Diabetes Metab. 2010;36:363-8. PMid:20579916. http://dx.doi.
org/10.1016/j.diabet.2010.03.008
13. Simões GC, Moreira SR, Kushnick MR, Simões HG, Campbell CS. Postresistance exercise blood pressure
reduction is inluenced by exercise intensity in type-2
diabetic and nondiabetic individuals. J Strength Cond Res. 2010;24:1277-84. PMid:20386125. http://dx.doi. org/10.1519/JSC.0b013e3181d67488
14. Tipton CM. Concerning postexercise hypotension. Exerc Sport Sci Rev. 2011;39:109. PMid:21430451. http:// dx.doi.org/10.1097/JES.0b013e3182164376
15. Morais PK, Campbell CS, Sales MM, Motta DF, Moreira SR, Cunha VN, et al. Acute resistance exercise is more effective than aerobic exercise for 24h blood pressure control in type 2 diabetics. Diabetes Metab. 2011;37:112-7. PMid:21159536. http://dx.doi.org/10.1016/j.
diabet.2010.08.008
16. Jackson AS, Pollock ML. Generalized equations for predicting body density of men. 1978. Br J Nutr. 2004;91(1):161-8. PMid:14748950.
17. Jackson AS, Pollock ML, Ward A. Generalized equations for predicting body density of women. Med Sci Sports Exerc. 1980;12:175-81. PMid:7402053. http:// dx.doi.org/10.1249/00005768-198023000-00009 18. Perloff D, Grim C, Flack J, Frohlich ED, Hill M,
McDonald M, et al. Human blood pressure determination by sphygmomanometry. Circulation. 1993;88:2460-70. PMid:8222141. http://dx.doi.org/10.1161/01. CIR.88.5.2460
19. Stergiou GS, Tzamouranis D, Protogerou A, Nasothimiou
E, Kapralos C. Validation of the Microlife Watch BP Ofice professional device for ofice blood pressure measurement
according to the International protocol. Blood Press Monit. 2008;13:299-303. PMid:18799957. http://dx.doi. org/10.1097/MBP.0b013e3283057af6
Lancet. 1986;8:307-10. http://dx.doi.org/10.1016/ S0140-6736(86)90837-8
21. Borg G. Ratings of perceived exertion and heart rates during short-term cycle exercise and their use in a new cycling strength test. Int J Sports Med. 1982;3:153-8. PMid:7129724. http://dx.doi.org/10.1055/s-2008-1026080 22. Tiggemann CL, Korzenowski AL, Brentano MA,
Tartaruga MP, Alberton CL, Kruel LF. Perceived exertion in different strength exercise loads in sedentary, active, and trained adults. J Strength Cond Res. 2010;24(8):2032-41. PMid:20634752. http://dx.doi.org/10.1519/ JSC.0b013e3181d32e29
23. Tiggemann CL, Pinto RS, Kruel LF. Perceived Exertion in Strength Training. Rev Bras Med Esporte. 2010;16(4):301-9. http://dx.doi.org/10.1590/S1517-86922010000400014 24. Whelton PK, He J, Appel LJ, Cutler JA, Havas S,
Kotchen TA, et al. Primary prevention of hypertension: clinical and public health advisory from the National High Blood Pressure Education Program. JAMA. 2002;288:1882-8. PMid:12377087. http://dx.doi.
org/10.1001/jama.288.15.1882
25. MacDonald JR, Hogben CD, Tarnopolsky MA, MacDougall JD. Post exercise hypotension is sustained during subsequent bouts of mild exercise and simulated activities of daily living. J Hum Hypertens. 2001;15:567-71. PMid:11494096. http://dx.doi.org/10.1038/sj.jhh.1001223
26. Halliwill JR. Mechanisms and clinical implications of post-exercise hypotension in humans. Exerc Sport Sci Rev. 2001;29:65-70. PMid:11337825. http://dx.doi. org/10.1097/00003677-200104000-00005
27. Chen CY, Bonham AC. Postexercise hypotension: central mechanisms. Exerc Sport Sci Rev. 2010;38:122-7.
PMid:20577060 PMCid:PMC2936915. http://dx.doi. org/10.1097/JES.0b013e3181e372b5
28. Santana HA, Moreira SR, Botelho WB Nº, Silva CB, Sales MM, Oliveira VN, et al. The higher exercise intensity and the presence of allele I of ACE gene elicit a higher post-exercise blood pressure reduction and nitric oxide release in elderly women: an experimental study. BMC Cardiovasc Disord. 2011;11:71. PMid:22136292 PMCid:C3261092. http://dx.doi.org/10.1186/1471-2261-11-71
29. Moreira SR, Arsa G, Oliveira HB, Lima LC, Campbell CS, Simões HG. Methods to identify the lactate and glucose thresholds during resistance exercise for individuals with type 2 diabetes. J Strength Cond Res. 2008;22:1108-15. PMid:18545200. http://dx.doi. org/10.1519/JSC.0b013e31816eb47c
30. Simões HG, Hiyane WC, Benford RE, Madrid B, Prada FA, Moreira SR, et al. Lactate threshold prediction by blood glucose and rating of perceived exertion in people with type 2 diabetes. Percept Mot Skills. 2010;111:365-78. PMid:21162440. http://dx.doi.org/10.2466/06.13.15.27. PMS.111.5.365-378
Correspondence
Sérgio R. Moreira
Universidade Federal do Vale do São Francisco (UNIVASF) Av. José de Sá Maniçoba, s/n, Centro