Artigo
*e-mail: [email protected]
SENSITIVE METHOD FOR DETERMINATION OF PIPLARTINE, AN ALKALOID AMIDE FROM Piper SPECIES, IN RAT PLASMA SAMPLES BY LIQUID CHROMATOGRAPHY-TANDEM MASS SPECTROMETRY
Daniel P. Bezerra, Cláudia Pessoa, Manoel O. Moraes e Letícia V. Costa-Lotufo
Departamento de Fisiologia e Farmacologia, Faculdade de Medicina, Universidade Federal do Ceará, Rua Alexandre Baraúna, 946, 60430-160 Fortaleza - CE, Brasil
Dayana Rubio Gouvea, Valquíria A. Polisel Jabor eNorberto Peporine Lopes*
Departamento de Física e Química, Faculdade de Ciências Farmacêuticas de Ribeirão Preto, Universidade de São Paulo, Av. do Café, s/n, 14040-903 Ribeirão Preto - SP, Brasil
Keyller Bastos Borges
Departamento de Ciências Naturais,Universidade Federal de São João del Rei, Campus Dom Bosco, Praça Dom Helvécio, 74, 36301-160 São João del Rei - MG, Brasil
Mary Anne S. Lima e Edilberto R. Silveira
Departamento de Química Orgânica e Inorgânica, Universidade Federal do Ceará, CP 12200, 60451-970 Fortaleza - CE, Brasil
Recebido em 16/3/11; aceito em 29/8/11; publicado na web em 30/9/11
Piplartine (PPTN) is an alkaloid amide found in Piper speciesthat presents different activities. PPTN determination in rat plasma is necessary to better understand its biological effects. The aim of this study was to develop a sensitive LC-MS/MS method for the determination of PPTN in rat plasma.The performance criteria for linearity, sensitivity, precision, accuracy, recovery, and stability have been assessed and were within the recommended guidelines. The validated method proved to be suitable in a pilot study of PPTN kinetic disposition in rat plasma after a single intraperitoneal dose, and represents an appropriate tool to further pharmacokinetic studies.
Keywords: piplartine; LC-MS/MS; rat plasma analysis.
INTRODUCTION
Focus on plant research has recently increased all over the world, and a large body of evidence has been collected showing the immense potential of medicinal plants used in traditional medicine.1 People in
separate cultures and places are known to have used the same plants for similar medical problems. A larger number of these plants and their isolated constituents have shown beneficial therapeutic effects, including antioxidant, anti-inflammatory, anticancer, antimicrobial, and immunomodulatory effects.2
Piper species(Piperaceae) are distributed widely in the tropical and subtropical regions of the world. They are used not only in human dietaries, as spice, but also for other purposes such as a preservative, in perfumery, and have multiple applications in different folk medicines, including the Indian Ayurvedic system, and have been reported to possess numerous biological activities.3 In particular, they are useful
against asthma, bronchitis, fever, hemorrhoid diseases, gastrointesti-nal diseases, and rheumatism. The preparations obtained from plants belonging to the genus Piper have shown anti-inflammatory, antifee-dant, insecticidal, and antihypertensive activities, as well as anticancer properties.4 Phytochemical investigations of Piper species have led to
the isolation of several classes of physiologically active compounds such as alkaloids, amides, pyrones, terpenes, steroids, kawapyrones, piperolides, flavonoids, phenylpropanoids, lignans and neolignans.4
Several of these phytochemicals have significant biological activity, including alkaloid amides, such as piplartine (PPTN, Figure 1).
Previous studies have emphasized that phytochemicals isolated from spices have great pharmacological potential.5 In fact, PPTN, a
known alkaloid amide isolated from the Piper species shows several pharmacological activities. It has been reported that this alkaloid has
cytotoxic,5,6 antifungal,7 anti-platelet aggregation,8 antitumoral,5,6
anxiolytic and antidepressant,9 antileishmanial,10 and genotoxic11
activities. Only one HPLC method has been described in the literature for the quantitative determination of PPTN in plants in natura, in plantlets in vitro and ex vitro, and in callus of Piper tuberculatum.12 In
spite of the cited pharmacological potential, no previous investigations reporting PPTN determination in plasma are available in the literature.
Pharmacokinetic data are crucial to better understand the biologi-cal effects of new compounds. No information is currently available on the absorption, distribution, metabolism or excretion of PPTN. In this work, a method is presented for the determination of PPTN in rat plasma samples using liquid chromatography-tandem mass spectrometry (LC-MS/MS). Prior to verifying the reliability of the bioanalytical method for application in the pilot pharmacokinetic studies, it was rigorously validated in accordance with United States Food and Drug Administration (FDA) guidelines.13 Thus, the
administration of 50 mg kg-1 PPTN to Wistar rats. To our knowledge,
this is the first bioanalytical method for PPTN analysis and its ap-plication in a pilot study of PPTN kinetic disposition in rat plasma. EXPERIMENTAL
Chemicals and reagents
PPT was obtained from the roots of Piper tuberculatum as des-cribed previously.9 Briefly, 420.0 g of ground roots of P. tuberculatum
was macerated with a mixture of diethyl ether: ethyl acetate (1:1, v/v, 1.5 L) for 24 h (for three times). The solvent mixture was evaporated under reduced pressure to yield a yellowish solid (13.24 g), which provided PPTN (4.35 g) after crystallization from methanol. After being characterized, specifically by m.p. 122.2-122.6 °C, 1D and 2D NMR analyses and MS/MS, the PPTN was considered a pure compound (data not shown). Carbamazepine, used as the internal standard (IS), was purchased from Sigma (St. Louis, MO, USA).
Acetonitrile HPLC grade was obtained from Tedia (Fairfield, OH, USA). Methanol was purchased from Burdick & Jackson (Muskegon, MI, USA). Glacial acetic acid diethyl ether and ethyl acetate were pur-chased from J. T. Baker (Phillipsburg, NJ, USA). Toluene analytical grade was obtained from Mallinckrodt Baker Inc. (Phillipsburg, NJ, USA). The water used in all experiments was purified on a Milli-Q Plus System (Millipore, Bedford, MA, USA). All others reagents were of analytical grade at the highest purity available.
Instrumentation and LC-MS/MS conditions
Experiments were performed on HPLC equipment from Shimadzu (Kyoto, Japan) consisting of two LC10AD solvent pumps, an SLC 10A system controller, a CTO-10AS column oven and a 20 µL loop with a Rheodyne model 7125 injector (Cotati, CA, USA). An NST 18 analytical column (250 × 4.6 mm id, 5 µm particle size) obtained from Nanoseparation Technologies (São Paulo, SP, Brazil) protected by a LiChrospher 100 RP18 guard column (4 x 4 mm id, 5 µm particle
size) obtained from Merck (Darmstadt, Germany) was used for the development and validation of the method. The mobile phase consisted of acetonitrile: water (70:30, v/v) plus 0.2% of acetic acid delivered isocratically at 1.0 mL min-1. The mobile phase was degassed on-line
using high purity helium gas. The HPLC eluent was split by a Valco valve and a flow rate of approximately 0.2 mL min-1 was introduced
into the stainless steel capillary probe of the mass spectrometer. All experiments were conducted using a Quattro LC triple quadrupole mass spectrometer instrument (Micromass, Manchester, UK). Ions were generated using an electrospray ionization interface (ESI) and detected in the positive ion mode. Nitrogen was used as the desolvation and nebulizing gas at flow rates of 265 and 27 L h-1,
respectively. Argon was used as the collision gas, at a collision cell pressure of 1.85 x 10⁻³ mbar. The source block and desolvation
tem-peratures were 100 and 250 ºC, respectively. In order to establish the most MS/MS sensitive operating conditions, parameters optimization were performed by direct infusion of PPTN standard solution (10 µg mL-1) and IS prepared in the mobile phase, into the MS throught a
Syringe Pump (Micromass, Manchester, UK) at a flow rate of 20 µL min-1. The optimized ESI-MS conditions for positive ion mode
ope-ration resulted in the capillary voltage of 3.0 kV where the sampling cone voltage was maintained at 15 V for PPTN and at 20 V for IS. The collision energy was 10 eV for PPTN and 20 eV for the IS. The analyses were performed in the multiple reaction monitoring (MRM) mode by monitoring the ion transitions from m/z 317.4 > 220.9 for parent molecule [M+H]+ and daughter ion of PPTN and m/z 236.4 >
193.8 for the IS, collected with a dwell time of 0.4 s. The
instrumen-tation was controlled and data were collected and processed, using Micromass Masslynx 3.0 software (Manchester, UK).
Stock solution and calibration standards
A stock solution of PPTN was prepared at 1 mg mL-1 in
me-thanol. Quality controls (QC) and calibration standards were ob-tained by serial dilution of the stock solution with methanol. The calibration standards were 0.016, 0.08, 0.16, 0.4, 0.8, 2.0, 5.0, 10.0 and 20.0 µg mL-1. Spiked rat plasma samples were obtained by the
addition of 25 µL of these standard solutions to 0.2 mL of drug-free rat plasma prior to extraction, resulting in final PPTN plasmatic concentrations: 2.0, 10.0, 20.0, 50.0, 100.0, 250.0, 625.0, 1250.0, and 2500.0 ng mL-1, respectively. Plasma QC samples spiked with 20.0,
625.0, and 1250.0 ng mL-1 were prepared to evaluate the accuracy
and precision of the method. For the stability study, the QC samples were prepared at the concentrations of 20.0 and 1250.0 ng mL-1 of
PPTN. The IS solution was prepared in methanol at the concentration of 5.0 µg mL-1 and aliquots of 25 µL were added to samples prior
to extraction, resulting in a plasma concentration of 125.0 ng mL-1.
All standard solutions were stored frozen at −20 ºC until analysis and protected from light, remaining stable for at least two months. Sample preparation
PPTN was extracted from rat plasma by a liquid–liquid extraction (LLE) procedure employing toluene as the extractor solvent. After thawing at room temperature, aliquots of 0.2 mL of rat plasma, 25 µL of IS (5.0 µg mL-1) and 1.0 mL of toluene were transferred
to amber tubes and submitted to horizontal mechanical shaking for 30 min. The samples were then centrifuged at 2000 x g for 10 min. The organic phases were collected and evaporated to dryness under a gentle stream of compressed air. All these steps were carried out at room temperature (22 ± 2 ºC). The residues were dissolved in 50 µL of the mobile phase by vortex for 20 s and an aliquot of 20 µL was injected into the LC-MS/MS. During all operations, the samples were protected from light in order to avoid photo-degradation of PPTN. Animals
Young healthy male Wistar rats (body weight 220 ± 10 g) pro-vided the blank biological matrices used for calibration curves and QC sample preparation, and also for method application. Animals were obtained from the Central Animal House of the University of São Paulo (Ribeirão Preto, SP, Brazil) and from the Central Animal House of Federal University of Ceará (Fortaleza, CE, Brazil) for the obtention of drug-free plasma samples and for method application, respectively. Animals were housed under standard conditions in a limited access area and maintained in a reverse 12 h light–dark cycle (lights on at 6:00 a.m.). The animals were treated according to the ethical principles of animal experimentation of the Brazilian Colle-ge of Animal Research (COBEA, CE, Brazil). The Animal Studies Committee of the Federal University of Ceará (Fortaleza, CE, Brazil) approved the experimental protocols under code UFC 45/05. To obtain plasma, rat blood samples were collected in heparinized tubes from the retro-orbital venous plexus, centrifuged at room temperature at 2000 x g for 10 min and stored at −20 ºC.
Method validation
Administration (FDA).13 The validation parameters evaluated were:
linearity, sensitivity (limit of quantification, LOQ), recovery, accuracy, precision and stability of PPTN in plasma samples. Coefficients of variation (CV%) and relative error (RE%) percentages less than 15% were considered acceptable, except for the LOQ, whose values were extended to 20%, as recommended for the analysis of biological samples for pharmacokinetic studies.14
Matrix effects
Matrix effects were assessed by comparing the peak areas obtained from the analysis of pure standard solutions dissolved in the mobile phase with the peak areas acquired from samples of four different lots of rats not treated with PPTN. The experiment was done in triplicate for the low concentrations of PPTN (2.0 ng mL-1) and also for the
concentration of the IS used in the developed method (5.0 µg mL-1).
Linearity
The linearity of the method was evaluated by the analysis in tripli-cate of plasma samples spiked with increasing PPTN concentrations matching those employed for the construction of the calibration curve (2.0, 10.0, 50.0, 250.0, 500.0 and 1250.0 ng mL-1). The regression
results were obtained by plotting the peak height ratios of PPTN/IS versus nominal concentrations using least-squares linear regression analysis with 1/x weighting factor. The relationship between respon-se and concentration was considered to be linear up to the highest concentration analyzed with an error lower than 15% and correlation coefficient (r2) ≥ 0.995.
Recovery
The extraction efficiency was determined by comparing peak hei-ght ratios (PPTN/IS) of known amounts of PPTN in the mobile phase (unextracted) directly injected into the analytical column to the peak height ratios of plasma samples containing the same amounts of PPTN after extraction. The absolute recoveries were assessed at concentrations of 20.0, 625.0 and 1250.0 ng mL-1 (n = 3, for each concentration) and
were expressed as percentage of the amount extracted. Drug-free rat plasma samples were also analyzed to assess the capacity of sample pretreatment for eliminating endogenous interferences.
Sensitivity
The sensitivity of the method was evaluated through LOQ, which was defined as the lowest concentration that could be determined with accuracy and precision below 20% over five analytical runs. Plasma samples spiked with concentrations as low as 2.0 ng mL-1
PPTN were analyzed five-fold. Accuracy and precision
To assess precision and accuracy within-day, replicate analysis (n = 5) of QC plasma samples spiked at 20.0, 625.0 and 1250.0 ng mL-1
PPTN were performed on the same day. For the between-day assay, five determinations of each concentration level (as described for within-day assay) were analyzed on three consecutive days. Precision and accuracy were expressed as coefficient of variation (CV%) and relative error (RE%), respectively.
Stability
The stability of PPTN in plasma samples was evaluated by
testing the influence of freeze (−20 ºC) and thaw (22 ± 2 ºC) cycles and short-term room temperature while protected from light. Spiked plasma samples were prepared in triplicate (n = 3) at both the low (20 ng mL-1) and high concentration (1250 ng mL-1) of the QC
sam-ples. To perform the freeze-thaw cycle stability test, these samples were stored at −20 ºC for 24 h and thawed at room temperature. When completely thawed, the samples were refrozen for 12 h under the same conditions. The freeze-thaw cycle was repeated a further two times, and then the samples were analyzed on the third cycle. The short-term room temperature stability test was assessed by analyzing samples that were kept on the bench-top for 4 h at room temperature (22 ± 2 ºC). After this period, all the samples were analyzed on the same day. The peak height ratios (PPTN/IS) obtained from the sta-bility tests were compared to the peak height ratios obtained from freshly prepared samples. Student’s t-test was applied, with the level of significance set at p ≤ 0.05.
Application of the method
To assess the applicability of the validated method, two groups of six young healthy male Wistar rats were treated intraperitoneally with 50 mg kg-1 of PPTN dissolved in a mixture of water: DMSO
(9:1, v/v). The dose and route of administration of PPTN was selected based on previous results obtained by our group.10 The
control group consisted of three rats that received water instead of PPTN solution. After administration, retro-orbital venous plexus blood samples were collected from the rats into heparinized tubes at 30 min, 3 and 24 h (three animals for each time interval). Plasma fraction samples were separated and kept at −20 ºC until analysis. The samples and an extracted calibration curve were analyzed simultaneously by the LC-MS/MS method for the determination of PPTN concentration in rat plasma.
RESULTS AND DISCUSSION
Optimization of the LC-MS-MS method
In order to establish the most sensitive MS/MS operating con-ditions, parameters optimization were performed by direct infusion of PPTN and IS standard solutions (10.0 µg mL-1) prepared in the
mobile phase into the MS through a syringe pump at a flow rate of 20 µL min-1. The optimization of MS detection was carried out
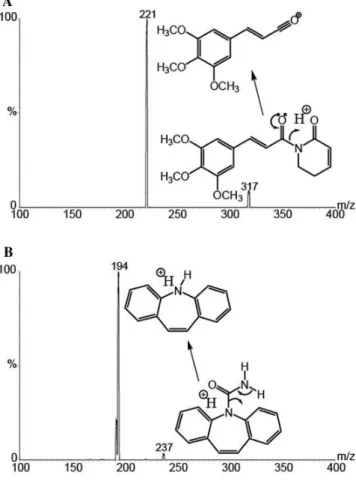
in the electrospray (ESI) positive ion mode due to the amide in the PPTN and carbamazepine (IS) chemical structures. The cone voltage yielded best results at 15 V for PPTN and at 20 V for the IS. The product ions were generated through fragmentation of the molecular ions by collision-activated dissociation using argon as the collision gas. The intensity of a selected product ion peak m/z in the MRM mode of each compound was optimized by varying the collision energy, which was 10 eV for PPTN and 20 eV for the IS. The protonated species [M+H]+ and their respective product
ions were monitored at 317.4 > 220.9 for PPTN (Figure 2A) and 236.4 > 193.8 for the IS (Figure 2B).
The resolution of PPTN and IS was obtained by reverse phase mode using a C18 analytical column. The composition of mobile pha-se and the choice of organic modifier was evaluated in terms of peak shape, sensitivity at mass detection for analyte/IS, and time analysis. The best signal and good ionization was achieved employing a mobile phase consisting of a mixture of acetonitrile: water (70:30, v/v) plus 0.2% of acetic acid at a flow rate of 1.0 mL min-1. These conditions
due the presence of amide groups in both analyte and IS molecules and its compatibility with the column stationary phase and MS. The addi-tion of 0.2% of glacial acetic acid to the mobile phase was sufficient to obtain a simultaneous positive ion ESI response for PPTN and IS. Method validation
In preliminary studies, the PPTN solution presented slight photo-degradation. Thus all experiments were conducted in amber tubes protected from light in order to avoid significant variation in the determinations.
The efficiency of th extraction procedure was calculated at high, medium and low plasma concentration levels for PPTN and the recovery results are given in Table 1. Mean absolute recoveries close to 75% indicate that the use of toluene as the extractor solvent
provided good and satisfactory recovery of PPTN and IS from rat plasma samples. In addition, the precision values of CV of between 1.8 and 3.3% demonstrated very good reproducibility of the LLE procedure throughout the whole calibration range.
The selectivity of the method was demonstrated by comparing the analysis of plasma samples from four different lots of rats not treated with PPTN and checking the potential interfering effect of endoge-nous compounds on PPTN quantification. Typical chromatograms for drug-free rat plasma sample (Figure 3A) and rat plasma spiked with PPTN (Figure 3B) and IS (Figure 3C) are shown in Figure 3. No endogenous interferences peaks across the retention window of PPTN and IS, or metabolite interference during the quantifying of PPTN in post-dose samples, was observed. In addition, the selectivity of this method was also evaluated in human plasma samples and the results observed were the same as those obtained for rat plasma samples.
Acceptable linearity was obtained for PPTN over the concen-tration range 2.0 to 2500.0 ng mL-1 in rat plasma (r2 = 0.9968).
The typical least-squares regression line was y = 0.00838139x + 0.0230658, where y represents the peak height ratios of PPTN and IS, and x represents the plasma concentrations of PPTN.
For sensitivity, the LOQ of PPTN in rat plasma was accepted as the lowest points on the calibration curve with a CV less than 20% for the analysis of PPTN. The LOQs were determined experimen-tally (n = 5) based upon the linear regression from the established linear range of the standard calibration curve. The plasma calibration standard of 2.0 ng mL-1 (n = 5) was reliablye quantified with a CV
of 11.2% and an RE of 5.7%. According to the preliminary results, this LOQ is adequate for the purposes of the method.
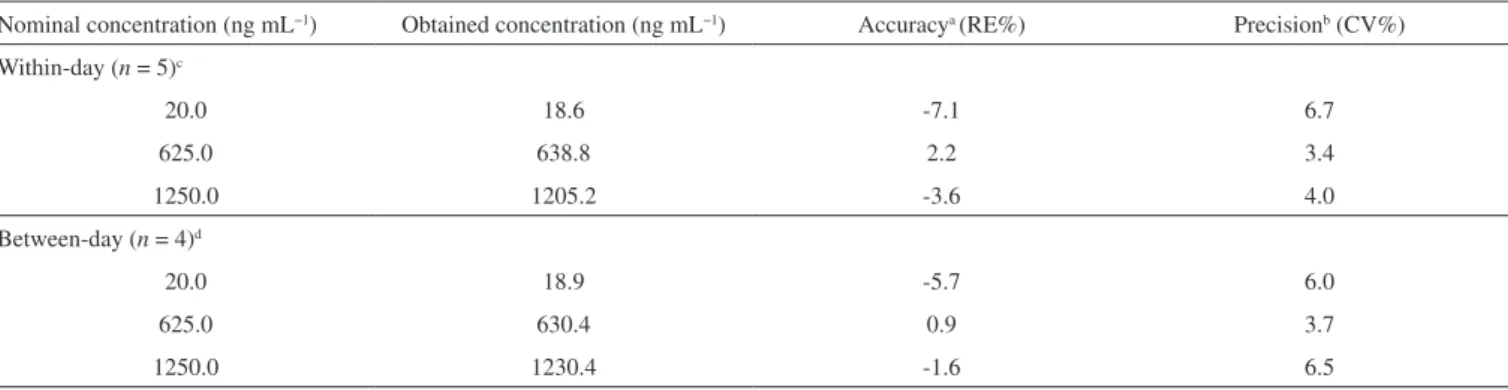
The within-day and between-day precision and accuracy of the method were evaluated by replicate (n = 5) analysis of the same spi-ked plasma samples series at low, medium and high concentrations of PPTN. The precision and accuracy of the method are shown in Table 2. The data indicate agreement with FDA recommendations; neither CV nor RE exceeded a value of 15%, proving that the assay method is reproducible on different days.
Stability was assessed by leaving the QC samples at low and high concentrations. The results showed no statistically significant differences between freeze–thaw cycles and short-term room tempe-rature of PPTN in rat plasma samples and freshly spiked samples of Figure 2. Tandem mass spectra showing the protonated molecular ion (m/z
317.42) and the predominant fragment ion (m/z 220.90) for the piplartine (A) and for the internal standard, carbamazepine, (m/z 236.40) and its respective fragment ion (m/z 193.83), (B) from infusion experiments carried out on the mobile phase
Table 1. Mean absolute recovery of the developed method
Plasma concentration (ng mL−1, n = 3a)
PPTN
Absolute recovery (%) Precisionb (CV%)
20.0 86.1 2.6
625.0 68.6 1.8
1250.0 72.2 3.3
Mean 75.6 12.2
an, number of samples; b CV, coefficient of variation.
Figure 3. Representative ion chromatograms of (A)blank rat plasma sample (Total Ion Current, TIC)and (B) rat plasma sample spiked with piplartine con-centration at LOQ level (2 ng mL-1) and (C)IS (carbamazepine, 125.0 ng mL-1).
the same concentrations. The results from Student’s t-test (Table 3) indicate that repeated freeze-thaw cycles, and after a period for 4 h at room temperature (22 ± 2 ºC), do not affect the sample integrity of PPTN in rat plasma but these samples should be protected from light.
Method application
This method was developed for the determination of PPTN in rat plasma samples using liquid chromatography-tandem mass spectrometry (LC-MS/MS) to investigate its suitability for pharma-cokinetic studies. The PPTN plasma concentration was determined following intraperitoneal administration of a single dose of 50 mg kg-1 to the Wistar rats (n = 3, for each group: 30 min, 3 and 24 h).
The rat plasma samples were obtained immediately after collecting blood samples, three times after administration. Figure 4 depicts
the chromatograms obtained from samples of rats treated with PPTN (pilot study) showing the applicability of the developed and validated method. The PPTN mean concentrations founded in rat plasma were 1511.9, 418.2 and 41.9 ng mL-1 for 30 min, 3 and
24 h, respectively. CONCLUSIONS
The present paper describes for the first time a fast and sensitive LC-MS/MS method for the quantification of PPTN in rat plasma. The method involved a simple sample preparation technique employing LLE with adequate recovery at low plasma volumes and low organic solvent consumption. The analyses were easily executed under iso-cratic chromatographic conditions with an analysis time of less than 4 min. The performance criteria for linearity, sensitivity, precision, accuracy, recovery, and stability have been assessed and were within the FDA recommended guidelines. LC-MS/MS in MRM mode is a powerful analytical technique for pharmacokinetic investigations fulfilling both specificity and selectivity requisites. This method was capable of accurately estimating PPTN concentration in rat plasma of up to 2.0 ng mL-1 with high reproducibility. Finally, the suitability of
the method for the determination of PPTN in rat plasma was clearly demonstrated in rats after intraperitoneal administration. This first validation study represents a relevant contribution to future inves-tigations of the PPTN pharmacokinetic, which has important and manifold pharmacological activities.
ACKNOWLEDGEMENTS
We wish to thank CNPq, CAPES, Instituto Claude Bernard, FUNCAP, Banco do Nordeste and FINEP for their financial support in the form of grants and fellowship awards.
REFERENCES
1. Tapsell, L. C.; Hemphill, I.; Cobiac, L.; Patch, C.S.; Sullivan, D. R.; Fenech, M.; Roodenrys, S.; Keogh, J. B.; Clifton, P. M.; Williams, P. G.; Fazio, V. A.; Inge, K. E.; Med. J. Aust.2006, 185, S4.
2. Huffman, M. A.; Proc. Nutr. Soc.2003, 62, 371; Viegas Jr., C.; Bolzani, V. da S.; Furlan, M.; Fraga, C. A. M.; Barreiro, E. J.; Quim. Nova2004, 27, 655; Viegas Jr., C.; Bolzani, V. da S.; Barreiro, E. J.; Quim. Nova
2006, 29, 326.
3. Rege, N. N.; Thatte, U. M.; Dahanuker, S. A.; Phytother. Res.1999, 13, 275; Tripathi, D. M.; Gupta, N.; Lakshmi, V.; Saxena, K. C.; Agrawal, A. K.; Phytother. Res.1999, 13, 561; Lee, S. E.; J. Am. Mosq. Control. Assoc.2000, 16, 245; Stöhr, J. R.; Xiao, P. G.; Bauer, R.; J. Ethnopharmacol.2001, 75, 133.
Table 2. Precision and accuracy of the developed method for analysis of PPTN in rat plasma
Nominal concentration (ng mL−1) Obtained concentration (ng mL−1) Accuracya (RE%) Precisionb (CV%) Within-day (n = 5)c
20.0 18.6 -7.1 6.7
625.0 638.8 2.2 3.4
1250.0 1205.2 -3.6 4.0
Between-day (n = 4)d
20.0 18.9 -5.7 6.0
625.0 630.4 0.9 3.7
1250.0 1230.4 -1.6 6.5
a Expressed as relative error (RE%); b Expressed as coefficient of variation percentage (CV%); c Number of replicates; d Number of days.
Table 3. Study of the stability of the PPTN in rat plasma sample employing
the developed method
Nominal concentration (ng mL-1) PPTN (p-valuesa) Freeze–thaw cycles (n = 3)
20.0 0.0821
1250.0 0.0613
Short-term room temperature (22 ± 2 ºC) (n = 3)
20.0 0.0722
1250.0 0.0687
ap ≤ 0.05 was considered significantly different.
Figure 4. Representative ion chromatograms of (A) plasma sample at 30 min, (B) 3 h and (C) 24 h after an intraperitoneal dose of piplartine (50 mg kg-1) to
4. Parmar, V. S.; Jain, S. C.; Bisht, K. S.; Jain, R.; Taneja, P.; Jha, A.; Tyagi, O. D.; Prasad, A. K.; Wengel, J.; Olsen, C. E.; Boll, P. M.; Phytochem-istry1997, 46, 597.
5. Lampe, J. W.; Am. J. Clin. Nutr.2003, 78, 579S; Bezerra, D. P.; Pessoa, C.; Moraes, M. O.; Silveira, E. R.; Lima, M. A. S.; Elmiro, F. J. M.; Costa-Lotufo, L. V.; Z. Naturforsch. C2005, 60, 539; Bezerra, D. P.; Castro, F. O.; Alves, A. P. N. N.; Pessoa, C.; Moraes, M. O.; Silveira, E. R.; Lima, M. A. S.; Elmiro, F. J. M.; Costa-Lotufo, L. V.; Braz. J. Med. Biol. Res.2006, 39, 801; Bezerra, D. P.; Militão, G. C. G.; Castro, F. O.; Pessoa, C.; Moraes, M. O.; Silveira, E. R.; Lima, M. A. S.; Elmiro, F. J. M.; Costa-Lotufo, L. V.; Toxicol. in Vitro2007, 21, 1.
6. Duh, C.-Y.; Wu, Y.-C.; Wang, S.-K.; J. Nat. Prod.1990, 53, 1575; Duh, C.-Y.; Wu, Y.-C.; Wang, S.-K.; Phytochemistry1990, 29, 2689; Tsai, I.-L.; Lee, F.-P.; Wu, C.-C.; Duh, C.-Y.; Ishikawa, T.; Chen, J.-J.; Chen, Y.-C.; Seki, H.; Chen, I.-S.; Planta Med.2005, 71, 535; Bezerra, D. P.; Castro, F. O.; Alves, A. P. N. N.; Pessoa, C.; Moraes, M. O.; Silveira, E. R.; Lima, M. A. S.; Elmiro, F. J. M.; Alencar, N. M. N.; Mesquita, R. O.; Lima, M. W.; Costa-Lotufo, L. V.; J. Appl. Toxicol.2008, 28, 156. 7. Navickiene, H. M. D.; Alécio, A. C.; Kato, M. J.; Bolzani, V.; Young,
M. C. M.; Cavalheiro, A. J.; Furlan, M.; Phytochemistry 2000, 55, 621; Silva, R. V.; Navickiene, H. M. D.; Kato, M. J.; Bolzani, V. S.; Méda, C. I.; Young, M. C. M.; Furlan, M.; Phytochemistry2002, 59, 521.
8. Park, B.-S.; Son, D.-J.; Park, Y.-H.; Kim, T.W.; Lee, S.-E.; Phyto-medicine2007, 14, 853; Iwashita, M.; Oka, N.; Ohkubo, S.; Saito, M.; Nakahata, N.; Eur. J. Pharmacol.2007, 570, 38.
9. Felipe, F. C. F. B.; Sousa-Filho, J. T.; Souza, L. E. O.; Silveira, J. A.; Uchoa, E. A.; Silveira, E. R.; Pessoa, O. D. L.; Viana, G. S. B.; Phytomedicine2007, 14, 605.
10. Bodiwala, H. S.; Singh, G.; Singh, R.; Dey, C. S.; Sharma, S. S.; Bhu-tani, K. K.; Singh, I. P.; J. Nat. Med.2007, 61, 418.
11. Bezerra, D. P.; Moura, D. J.; Rosa, R. M.; Vasconcellos, M. C.; Silva, A. C. R.; Silveira, E. R.; Moraes, M. O.; Henriques, J. A. P.; Costa-Lotufo, L. V.; Saffi, J.; Mutat. Res.2008, 652, 164.
12. Navickiene, H. M. D.; Bolzani, V. S.; Kato, M. J.; Pereira, A. M. S.; Bertoni, B. W.; França, S. C.; Furlan, M.;Phytochem. Anal. 2003,14, 281.
13. United States Food and Drug Administration (US-FDA); Guidance for Industry, Bioanalytical Method Validation, 2001.