Article
Printed in Brazil - ©2013 Sociedade Brasileira de Química0103 - 5053 $6.00+0.00
A
*e-mail: [email protected]
A Voltammetric Study on the Adsorption of Cd(II) and Zn(II) on
Marine Microalgae
Tetraselmis gracilis
(Kylin) Butcher
Kamila dos Santos Maguerroski, Marilda Rigobello-Masini and Jorge C. Masini*
Instituto de Química, Universidade de São Paulo, CP 26077, 05513-970 São Paulo-SP, Brazil
As capacidades de ligação de prótons e metais por células vivas da microalga
Tetraselmis gracilis foram estudadas por titulação potenciométrica e voltametria de redissolução anódica, respectivamente. A ligação de Cd(II) e Zn(II) foi estudada em água do mar (pH 8,2) por adições de soluções dos cátions metálicos em soluções simples ou misturas binárias. O cálculo das concentrações dos metais considerou o agregado célula-metal tendo difusão lenta. As capacidades de adsorção e constantes de equilíbrio condicionais foram 2,9 ± 0,3 µmol g-1 e 6,9 ± 0,3 L g-1 para
Cd(II) e 18,5 ± 0,9 µmol g-1 e 8,8 ± 0,2 L g-1 para Zn(II), respectivamente. Nas titulações com
misturas binárias, as capacidades de adsorção diminuíram para 0,14 ± 0,01 e 15,9 ± 1,1 µmol g-1
de Cd(II) e Zn(II), respectivamente, sugerindo que a ligação de Zn(II) inibe a de Cd(II). Em baixas concentrações de Zn(II), a superfície da alga liga-se a Cd(II), o que pode causar bioacumulação.
Proton and metal binding capacities of living cells of the microalgae Tetraselmis gracilis were determined by potentiometric titration and anodic stripping voltammetry, respectively. Binding of Cd(II) and Zn(II) was studied in seawater (pH 8.2) by additions of either single metallic species or binary mixtures. Computation of metal concentrations considered the cell-metal aggregates as slow diffusing. Adsorption capacities and conditional equilibrium constants were 2.9 ± 0.3 µmol g-1 and
6.9 ± 0.3 L g-1 for Cd(II) and 18.5 ± 0.9 µmol g-1 and 8.8 ± 0.2 L g-1 for Zn(II), respectively. For
titrations with binary mixtures of Cd(II) and Zn(II), the adsorption capacity of Cd(II) decreased to 0.14 ± 0.01 µmol g-1 and that for Zn(II) to 15.9 ± 1.1 µmol g-1. The results suggest that binding of
Zn(II) inhibits that of Cd(II). Under conditions of depleted Zn(II), the alga surface binds Cd(II), a process that can lead to bioaccumulation.
Keywords: anodic stripping voltammetry, biosorption, dynamic speciation, marine microalgae
Introduction
Biosorption is defined as a physicochemical process in which substances are removed from solution by a biological material (live or dead) via adsorption processes governed by mechanisms such as surface complexation,
ion exchange, precipitation, etc.1-3 The exterior surfaces
of aquatic organisms have a common composition of proteins and carbohydrates containing carboxylic, phenolic, amine, sulfhydryl and phosphate groups which are known to react with metallic ions, playing an important role in the regulation of the free metal ion concentrations in aquatic
environments.4 Surface complexation is a first step of
bioaccumulation processes.5 Thus, the characterization
of proton and metal binding parameters by aquatic living microorganisms is a first step for understanding the role
these organisms play in biogeochemical cycles of metal ions in aquatic ecosystems.
Biosorption parameters (adsorption capacities and conditional equilibrium constants) are usually evaluated by determining the free metal concentrations by atomic spectrometric techniques after the removal of cells and
cell debris by centrifugation or filtration.6 These separation
steps make difficult the evaluation of fluxes of the adsorbate from the cell surface to the adjacent medium, a process that is representative of what occurs at adsorbent/water
or absorbent/biota interfaces in aquatic environments.7,8
A major advantage of electroanalytical techniques, besides their high sensitivity, is the capability to make the measurement of the free plus labile fraction of metal ions in the presence of the algal suspension, allowing one to evaluate if there are fluxes of adsorbate at the interface cellular membrane/solution, or, more specifically, at the
Cd(II) and Cu(II) on Pseudomonas aeruginosa, Kong et al.10 found higher concentrations of metal in the cell suspension analyzed by square wave stripping voltammetry (SWSV) than in the solution, determined by atomic absorption spectrometry (AAS). This finding may be explained by the contribution of the labile fraction of metal to the current signal of SWSV. The labile fraction dissociates from the metal-cell aggregates upon the stimulus promoted by application of the deposition potential, whereas for solution AAS measurements, this fraction is not present as it remains bound to the cells retained by filtration or centrifugation.
Concentrations of many trace metals such as Zn(II) are depleted in the surface sea waters relative to deep waters, presumably as a consequence of biological uptake at sea surface and regeneration at depth. Zinc is a known micronutrient for marine phytoplankton, but Cd(II) which is normally considered to be a non-essential or toxic metal, also exhibits depletion at surface waters, especially at low concentration levels of Zn(II). These findings have suggested that Cd(II) can nutritionally substitute zinc in
in at least some phytoplankton species.12,13 As the metal
species can be assimilated and accumulated by algal cells, they can be transferred to higher trophic levels of food chains. Thus, the understanding of Cd(II) and Zn(II) accumulation by phytoplankton and the role phytoplankton plays governing their free concentrations in aquatic environments may be benefitted by the determination of biosorption parameters in single and binary mixtures of these metal species.
In the present work, the adsorption of cadmium and zinc on the surface of living cells of the marine microalga
T. gracilis was studied by SWSV technique for direct quantification of the free plus labile fractions of Cd(II) and Zn(II). The measurements were made in single and binary mixtures of Cd(II) and Zn(II) in seawater suspensions of
cells. T. gracilis is an estuarine species of microalgae which
has been used as food in mariculture.14
Experimental
Microalgae culture
Tetraselmis gracilis from the algae culture collection of the Oceanographic Institute of the University of
São Paulo was cultivated at 20 oC in 6 L flasks inside a
MA-415 thermostatized incubation chamber from Marconi (Piracicaba, São Paulo, Brazil) using sterilized seawater
with addition of Guillard f/2 medium.15 The culture was
made without forced aeration with a 12/12 light/dark
photoperiod and a photon flux density of 350 µE m−2 s−1. The
algal cells were counted daily using a haemocytometer-type
chamber in an optic microscope. At the 5th culture day, at
the exponential growth phase,16,17 samples were collected
for the experiments of proton and metal binding.
Apparatus and reagents
Voltammetric measurements were carried out using a model 263A potentiostat/galvanostat from Princeton Applied Research (Oak Ridge, Tennessee, USA). A MF2012 disk glassy carbon electrode (3.0 mm diameter) from Bioanalytical Systems, Inc. (West Lafayete, IN, USA) was used to prepare a mercury film working electrode. The electrochemical cell was completed with an Ag/AgCl reference electrode (KCl/AgCl saturated) and a platinum auxiliary electrode.
Infrared spectra were obtained by diffuse reflectance using a FTIR Bomem MB100 instrument. Potentiometric measurements were made with a Metrohm 654 pH meter coupled to a Metrohm combination glass electrode (Ag/AgCl in saturated KCl). Potentiometric titrations were performed using a Cavro XP-3000 syringe pump (Hamilton Co., USA) fitted out to a 5 mL syringe and a 3-way solenoid valve, commanded by the FIAlab 5.1 software (FIAlab Instruments, Bellevue, WA, USA). Titrations were performed in a 50 mL titration flask which was thermostated at 25.0 ± 0.2 °C by pumping water from an Etica 521 D thermostatic bath (Ethiktechnology, São Paulo, SP, Brazil) through the external jacket of the flask.
All reagents were of analytical grade and the working solutions were prepared in deionized water obtained from the Simplicity 185 system from Millipore (Billerica, MA, USA) coupled to an UV lamp. Stock solutions of
1000 mg L-1 standard of Cd(II) and Zn(II) were purchased
from Merck. Working solutions were prepared by dilution of this stock in seawater.
Potentiometric titrations
A volume of the culture medium containing the microalgae (ca. 250 mL) was distributed in several
polypropylene centrifuge tubes from Corning® and
centrifuged at 3,500 rpm for 5 min. The centrifuged
microalgae were washed 3 times with 0.60 mol L-1
NaCl to remove the culture medium and the titratable components of seawater. Washed microalgae were
suspended in 0.60 mol L-1 NaCl in a 50.0 mL volumetric
flask. Part of this suspension (25.0 mL) was transferred to
a thermostated (25.0 ± 0.2 oC) titration flask. An aliquot
of 2.0 mL of standardized 0.10 mol L-1 HCl solution in
0.60 mol L-1 NaCl was added to the suspension to protonate
occurred as a consequence of the acidification, as observed using an optical microscope). After the system reached the thermal equilibrium, the titration was performed by adding small increments of carbonate-free
hydrogenphthalate-standardized 0.10 mol L-1 NaOH (in 0.60 mol L-1 NaCl) to
vary the pH from 2.8 to 11.
Calibration of the combination glass electrode (Ag/AgCl
in 3 mol L-1 KCl/saturated AgCl reference electrode) was
made in terms of hydrogen ion concentration in 0.60 mol L-1
NaCl, as previously described.18,19
Working electrode for voltammetric measurements
Prior to use, the working electrode was manually polished to a mirror-like surface with 1.0 µm diamond suspension on metallographic cloth (Arotec S/A, São Paulo, Brazil) and sonicated for 5 min in deionized water. This procedure was repeated using a 0.25 µm diamond suspension, followed by a final 5 min sonication in ethanol.
The glassy carbon electrode was preplated with mercury
in a 5 mmol L-1 Hg(CH
3CO2)2 solution in 0.01 mol L-1
HNO3 under constant stirring by applying −1 V vs. Ag/AgCl
(KCl/AgCl saturated) for 150 s. The electrode was rinsed thoroughly with deionized water and transferred to the voltammetric cell containing the microalgae suspension.
Biosorption experiments
To prevent metal losses by adsorption on glassware, as well as cross contamination between biosorption
experiments, all materials were soaked in 10% (v v-1) HNO
3 for 24 h, followed by extensive washing with deionized water prior to use. Cleaned glassware was dried in an oven
at 100 oC and stored in dust-free plastic boxes.
An aliquot of 5.0 mL of a suspension containing about 5 mg of seawater-washed cells of microalgae, which
corresponds to the dry mass of approximately 108 cells, was
transferred to the electrochemical cell. The electrochemical
vessel was closed and the dissolved O2 was removed by
purging the suspension with high purity N2 (Air Liquid) for
2 min. Voltammetric measurements were made by applying a step of electrochemical conditioning to the working electrode (−0.2 V for 30 s), followed by a deposition time of 120 s at −1.2 V under stirring, and 15 s of equilibration time. Anodic stripping was made by scanning the potential from −1.3 to −0.4 V by SWV at 100 Hz, 25 mV of pulse height and scan increment of 2 mV. Voltammograms of sample solutions were subtracted from that of the blank (seawater) and smoothed by a factor 10 sliding average approach provided by the Research Electrochemistry Model 270/250 software from Princeton Applied Research.
Titration of the suspension was performed by adding small volumes of titrant containing either single or binary solutions of Cd(II) and Zn(II), so that the total concentration of the metal species in the titration vessel varied from 0.010
to 2.5 µmol L-1 for Cd(II) and from 0.050 to 20 µmol L-1
for Zn(II). After addition of each aliquot of titrant, the
suspension was purged with N2 for 30 s, which was adopted
as the contact time before starting the quantification of the free plus labile metal concentrations. Seawater used in these experiments as supporting electrolyte was collected in an unpolluted open ocean area of São Paulo state, Brazil, by the Oceanographic Institute of the University of São Paulo.
Quantification of the free plus electrochemically labile Zn(II) and Cd(II) concentrations was made by external calibration using analytical curves constructed daily (0.050
to 0.70 µmol L-1 for Zn(II) and 0.010 to 1.20 µmol L-1
for Cd(II)). These analytical curves were constructed in seawater, in absence of microalgae to match the conditions used for biosorption. Seawater from the same sampling point and sampling date was used for both calibration and biosorption experiments.
Calculation
Proton binding properties were determined by treatment of potentiometric titration data by modified Gran functions, an approach adopting the discrete site distribution model that has been widely described for determination of concentration and pKa of ionizable sites in proteins, humic
acids and microalgae surfaces.20
Metal binding parameters were determined as described in the next paragraphs. The peak current in seawater is given by equation 1:
ip = B Dr
M CM,T (1)
where ip = peak current; D = diffusion coefficient of M,
estimated as 7 × 10⁻⁶ cm2 s-1 for both Cd(II) and Zn(II);13,21
r = empirical constant whose value varies between 1/2 and
2/3;21 C
M,T = total concentration of Zn(II) and Cd(II);
B = constant dependent on the number of electrons involved
in the electrode reaction, thickness of the diffusion layer,
electrode area and deposition time. The product B Dr
M
is a constant that was determined from the slope of the calibration curve in seawater without the presence of microalgae.
In the adsorbing medium of microalgae suspension, the diffusion coefficient must be substituted by a mean value
for each CM because not only the free species is reduced
at the electrode, but also the labile fraction of adsorbed
(3)
where iL
p is the peak current read in presence of microalgae.
The value of —D is pondered by its relative proportion to CM
according to equation 4:21
(4)
where CML = concentration of the adsorbed M at the
equilibrium and DML = diffusion coefficient for the ML
adsorbate. The value of —D was computed as
since DM CM >> DML CML is assumed in biosorption
experiments.7 The values of C
ML were obtained from the
mass balance:
(5)
With the values of CM and CML, the equilibrium
parameters were computed for the adsorption of Cd(II) and Zn(II) by the microalga. Data were fitted to the Ruzic´s
equation:22
(6)
where CL,T is the total concentration of adsorption sites
on the alga surface (mol g-1) and K’ is the conditional
equilibrium constant. A plot of CM/CMLvs.CM provides a
straight line whose slope is the inverse of the adsorption
capacity (CL,T) and the intercept allows one to compute the
conditional equilibrium constant.
Differential equilibrium functions (KDEF) were
calculated as described by Altmann and Buffle.23
(9)
where , and Calg is the algae concentration
in g L-1. The differential terms were obtained by fitting
polynomial functions to data plotted as ln CM,T or ln Calg as
a function of ln α.
The degree of site occupation was computed as the
ratio , where CHL,T is the total concentration
of ionizable sites determined by potentiometric titration.18,24
According to equation 10, a plot of log θ vs. log KDEF
provided the heterogeneity parameter (Γ) and K0
DEF , which
is the KDEF for θ = 1.23
(10)
Results and Discussion
Proton binding sites
Treatment of the acid-base potentiometric titration data
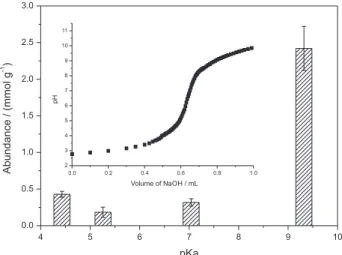
by the discrete site distribution model20 determined a total of
3.4 × 10⁻³ mol g-1 (dry weight) of ionizable sites distributed
in groups with pKa values of 4.43, 5.26, 7.04 and 9.32 (Figure 1). To our best knowledge, there are no previous studies on characterization of surface ionizable sites of
T. gracilis. The results found here suggest that this algal species has a high concentration of sites in comparison
with other species. For instance, a total of 2.4 × 10⁻³ mol g-1
was determined in the fresh water green alga Caetophora
elegans in 0.10 mol L-1 NaCl.11 Totals of 9.7 × 10⁻⁴ and
9.1 × 10⁻⁴ mol g-1 were determined as the proton binding
capacities in the microalgae Cyclotella crytica (diatom) and
Chlamydomonas reinhardtii (green alga), respectively.25
A total of 1.28 × 10⁻³ mol g-1 was found in Chlorella
miliata,26 and three functional groups with remarkably
uniform site densities of about 5 × 10⁻⁴ mol g-1 were found
in Ulva lactuca.27 Proton binding capacities of four species
of marine macroalgae varied from 1.1 × 10⁻³ (Ulva fascia,
Figure 1. Discrete site distribution of ionizable sites determined by potentiometric titration in 0.60 mol L-1 NaCl at 25.0 ± 0.2 oC. The inset
shows a typical titration curve of a suspension (25.0 mL) of T. gracilis
previously protonated by addition of 2.0 mL of 0.10 mol L-1 HCl in
green alga) to 2.9 × 10⁻³ mol g-1 (Petalonia fascia, brown
seaweed).28
Most studies on proton binding properties of algal
species find that the titration curves can be fitted by two,25,29
three26,27,30 and four11,31 classes of titratable groups. The
total concentration of ionizable sites found in T. gracilis
was distributed in four classes with distinct pKa (Figure 1). As the titrations were performed in high ionic strength
(0.60 mol L-1 NaCl), the effect of electrostatic interaction
on the ionization constants is minimized.32 Under these
conditions, the distribution of carboxylic groups in two classes of sites (pKa 4.4 and 5.3) is explained by effective chemical heterogeneity of the alga surface and not by apparent ionization constants resulting from the accumulation of negative charges as the carboxylic groups
are deprotonated along the alkalimetric titration.24
The group with pKa 7.0 may be assigned to imidazole groups of histidine, as well as phosphate or phosphonate
groups,26,27 whereas the group with pKa 9.3 can be assigned
to amine groups, as described by other authors for different
species of algae.11,25-32 However, as the computation method
cannot distinguish among species with ∆pKa < 1,33 the pH
titration range that fitted the pKa 9.3 may have contribution of minor ionizable sites containing sulfhydryl groups. The
results found for T. gracilis show that these groups with
pKa 9.3 correspond to about 73% of the total of ionizable sites (Figure 1). In comparison with the distribution of
other algal species, only C. elegans exhibited such a high
proportion of ionizable sites with pK > 9 (54 to 63%,
depending on the ionic medium),11 whereas other studies
found equal abundances of sites,27 or a predominance of
carboxylic groups.26,30,31
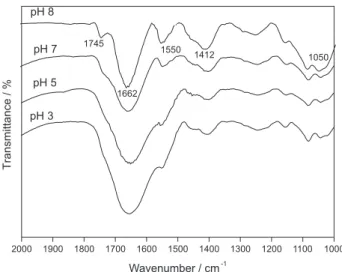
The nature of ionizable sites was also investigated by diffuse reflectance FTIR at different pH (Figure 2). The bands at pH 8 of amide I (stretching of C=O) and amide II (N−H bending and C−N stretching) are well defined at
1662 and 1550 cm-1, respectively. The band centered at
1662 cm-1 can have contribution of N−H bending of primary
amines. At pH 8, the low intensity band at 1745 cm-1 may
be assigned to stretching of carboxyl group. Its intensity increases as the pH is lowered as a consequence of the protonation of the carboxylate groups. This increase, however, is not easily observed because there is an overlap with the band of amide I, enlarging it as the pH is lowered.
The band at 1412 cm-1 may be assigned to vibration of
carboxylate group, whose intensity decreases with the pH, which is coherent with the protonation of carboxylate
groups.34 The wide band at 1233 cm-1 may be assigned to
vibrations of C−O−C in esters or P=O stretching, whereas
the bands in the range 1000-1150 cm-1 are related to
asymmetric and symmetric stretching of PO2− and P(OH)2
in phosphate, as well as vibrations of C−OH and C−C bonds of polysaccharides and alcohols. These results are consistent with predominance of ionizable sites containing nitrogen groups followed by carboxylic moieties and the possible presence of phosphate found by potentiometric titration.
Cadmium and zinc binding
Under the experimental conditions adopted in these experiments, the concentrations of both Cd(II) and Zn(II) in the seawater used as supporting electrolyte were not detectable (from the signal to noise ratio), not interfering in the biosorption studies. Speciation of Cd(II) and Zn(II) in seawater (pH 8.2) was computed with the MINEQL+ software, version 4.6 for Windows, which revealed that Cd(II) is mostly distributed as CdOHCl (aq.) (1.33%),
CdCl+ (20.4%), CdCl
3− (22.6%) and CdCl2 (aq.) (55.2%).
For Zn(II), this distribution was ZnOH+ (1.63%), ZnCl
4−
(2.89%), ZnCO3(aq.) (2.99%), ZnSO4 (aq.) (3.93%),
ZnCl3− (8.88%), Zn
2+ (10.2%), ZnCl+ (16.7%), ZnCl
2 (aq.) (17.2%) and ZnOHCl (aq.) (34.9%).
The adsorption kinetics was evaluated by varying the contact time before starting the deposition time. This experimental condition was achieved by varying the purge time from 30 to 240 s, which is made under open circuit, a condition that does not impose electrochemical stimulus to the system microalgae-metal at the vicinities of the working electrode. As the purging time increased within this interval, the peak currents did not decrease, suggesting that the biosorption at the algae surface was fast. This behavior allowed the titrations to be made by discrete sequential increments of titrant in a single titration flask. This approach
has been adopted by other authors9 because interaction of
metal ions with surface functional groups in the cellular membranes is usually fast, although metabolic mechanism in live cells can lead to bioaccumulation, a slow process (> 24 h) involving membrane transport and binding of the metals to macromolecules such as DNA, polypeptides,
phytochelatins and proteins.9,35-37
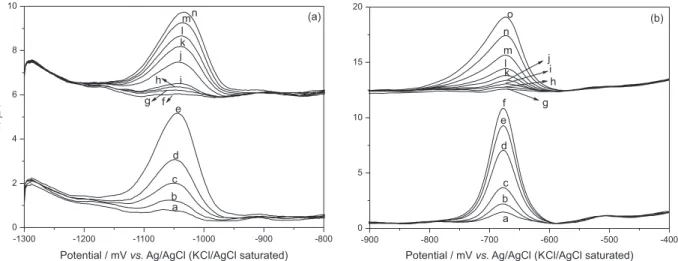
The peak potentials observed in the voltammograms of Zn(II) and Cd(II) in seawater were not significantly
different from those in the suspension of live T. gracilis
(Figure 3) and were independent of CM,T, so that the
adsorption parameters can only be calculated from the peak currents. The behavior of peak current and potential suggests that the cell-metal ion aggregates are labile or
quasi-labile with DML << DM. 38
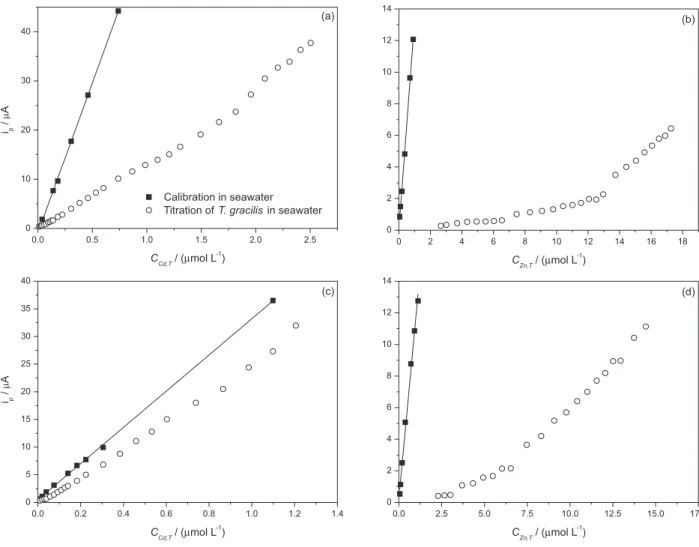
The variation of peak currents as a function of CM,T in
both the presence and absence of alga is shown in Figure 4. The binding of Cd(II) and Zn(II) by the cell surface shifted the titration curves in relation to the calibration in absence of alga. Adsorption of Zn(II) is more intense than that of Cd(II), as can be observed by comparing Figures 4a and 4b.
Quantification of CCd was possible for all CCd,T studied (0.01
to 2.5 µmol L-1) because measurable peak currents were
obtained for all titration points (Figure 4a). On the other
hand, not measurable peak currents were observed for CZn,T
from 0.05 to about 2 µmol L-1 (Figure 4b) as a consequence
of the strong adsorption of Zn(II) (or formation of inert
aggregates at low CZn,T). As the CM,T values increased after
a given point, a significant increase in the slope of the
graph ip vs. CM,T was observed, indicating the saturation
of the adsorbing sites. However, the slope of the titration curves in presence of alga did not parallel with that of the calibration, suggesting that binding sites with weaker
binding energy were still being titrated in that range of CM,T
(Figures 4a, 4b and 4d). The only titration curve whose
slope paralleled with the calibration for high CM,T was
for the case of Cd(II) in the titration with the mixture of Cd(II) and Zn(II) (Figure 4c). A comparison of the profiles of Figures 4a and 4c indicates that the stronger binding of Zn(II) inhibits the binding of Cd(II), making the titration curve of the sample closer to that obtained in the calibration.
The complexing or adsorption capacity computed by the Ruzic’s equation (Table 1) for Cd(II) and Zn(II) corresponds to only 0.084 and 0.54% of the total of
ionizable sites (CHL,T), respectively. The low degree of
site occupation was also observed for other authors for
different species of microalgae.11,25 This behavior may be
explained by the low ratios of CM,T to CHL,T used in these
experiments and by the fact that only the ionizable sites with strong affinity by the metal species affect the free (plus labile) fraction of metal that can be reduced at the
mercury electrode. Further increases in CM,T(in all cases)
decreased the slope of the titration curve (not shown), a behavior that can be explained by saturation of the Hg-film of the working electrode.
Both CM,T and CHL,T studied in this work were much
higher than the concentrations typically found in open
oceans, but the ratios CM,T/CHL,T may be representative of
environmental conditions found in coastal areas impacted by eutrophication and metal pollution as a consequence of anthropic activities.
When Zn(II) and Cd(II) were added individually to the titration flask, both ions were adsorbed, but Zn(II) was bound to a larger extension than Cd(II) to the surface of
T. gracilis (Figures 4a and 4b, Table 1), a fact that may be related to the nutrient role that Zn(II) plays in the plant metabolism and the existence of specific sites for
Figure 3. Voltammograms for Zn(II) (a) and Cd(II) (b) in seawater (a → e for Zn(II) and a → f for Cd(II)) and in suspensions of T. gracilis (f → n for Zn(II) and g → o for Cd(II)). The concentrations for Zn(II) were: (a) 0.051, (b) 0.10, (c) 0.19, (d) 0.38, (e) 0.70, (f) 2.66, (g) 3.01, (h) 3.69, (i) 4.32, (j) 4.92, (k) 5.49, (l)6.02, (m) 6.53 and (n) 7.46 µmol L-1; For Cd(II): (a) 0.010, (b) 0.020, (c) 0.039, (d) 0.076, (e) 0.10, (f) 0.12, (g) 0.010, (h) 0.030, (i) 0.058,
its binding (log K' = 8.88). Cadmium does not have any nutritional role, but some species of marine microalgae,
such as Tetraselmissuecica, are known to have metabolic
mechanisms to make the organism tolerant to Cd(II) by producing intracellular non-protein sulfhydryl
groups-rich compounds.36,39 The authors found a LC50 (lethal
concentration average) value of 7.9 mg L-1 (70.3 µmol L-1)
after six days of exposure. On the other hand, increased
activity of superoxide dismutase in T. gracilis exposed
to Cd(II) suggests that the metal species cause oxidative
stress.40 Another possible explanation for why the Zn(II) is
adsorbed in a higher amount could be, according to the data
of MINEQL+, the presence of free Zn(II) (10.2% of CZn,T),
whereas the free Cd(II) concentration is negligible. Free ions are those which have a higher capacity for interaction with biological surfaces (higher bioavailability).
The adsorption capacity of both ions decreased (Table 1) in the titrations with binary mixtures of Cd(II) and Zn(II),
Table 1. Adsorption parameters (n = 3) obtained from Ruzic’s equation and differential equilibrium functions
Metal Ruzic
a DEF
CL,T / (µmol g-1) log K´ R2 log KDEF
0 Γ R2
Cd(II) 2.8 ± 0.3 6.9 ± 0.3 > 0.98 3.4 ± 0.8 0.94 ± 0.08 > 0.98
Zn(II) 18.5 ± 0.9 8.8 ± 0.2 > 0.99 5.4 ± 0.8 0.6 ± 0.1 > 0.97
Cd(II) in presence of Zn(II) 0.14 ± 0.01 7.7 ± 0.2 > 0.96 − − −
Zn(II) in presence of Cd(II) 16 ± 1 9.0 ± 0.2 > 0.99 4 ± 1 0.7 ± 0.1 > 0.97
aRange of C
Mfor which the data were fitted by Ruzic’s equation: 0.15 to 15 nmol L-1 for Zn(II), in single and binary solutions; 6 to 108 nmol L-1 for single
Cd(II) adsorption and 1.6 to 134 nmol L-1 for adsorption of Cd(II) in presence of Zn(II).
Figure 4. Peakcurrents (ip) vs.CM,Tof titrations of T. gracilis suspensions (1 mg mL-1) in seawater (pH 8.2) with Cd(II) (a, c) and Zn(II) (b, d) in separate
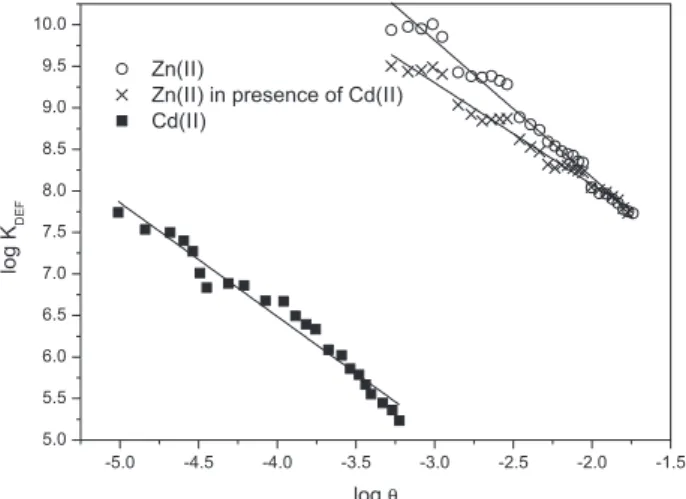
Figure 5. Differential equilibrium plots for biosorption of Cd(II) and Zn(II) by T. gracilis.
in agreement with the findings of Monteiro et al.41 for
the microalgae Scenedesmus obliquus and Desdesmus
pleimorphus. The decrease in adsorption capacity was much more significant for Cd(II) than that for Zn(II), but this behavior
cannot be generalized for algal species. Monteiro et al.41
observed that S. obliquus was able to remove Zn(II) to
higher extents than Cd(II), whereas the opposite occurred
with D. pleiomorphus. The log K´ for binding of Zn(II) was
not affected by the competition with Cd(II). For the case of
Cd(II), the log K´ increased by about one unity (Table 1). This
fact may be explained by the occurrence of Cd(II) specific adsorption sites, that is, if there is no competition, Cd(II) can
bind to a variety of groups and the log K´ is computed as an
average value between weak (high abundance) and strong sites (much less abundant). In case of competition with Zn(II), only the sites with stronger affinity for Cd(II) can be occupied, which is viewed as an increase in the conditional equilibrium
constant, and a decrease in the in the CL,T.
The higher affinity of Zn(II) biosorption in comparison
with that of Cd(II) can also be viewed in the log KDEFvs. logθ
plots (Figure 5). It was not possible to study the biosorption under similar conditions of site occupation because at conditions of low occupation (−5.0 < log θ < −3.3), in which the adsorption parameters of Cd(II) were
computed, CZn was not detectable as a consequence of
the strong/inert binding of this ion to the alga surface.
Computation of K0
DEF and Γ for biosorption of Zn(II)
(Table 1) was only possible in the range of log θ between −3.3 and −1.8, a condition in which the binding sites for Cd(II) approached the saturation, or the binding was too
weak to allow reliable computation.21 The smaller values
of Γ for Zn(II) in comparison with that for Cd(II) reflect a larger energetic heterogeneity of binding sites for Zn(II). The values of Γ between 0.6 and 0.7 are consistent with
adsorption by natural ligands.9,21
Comparison of the complexation parameters with the literature data is not straightforward because at our best knowledge this is the first work describing the biosorption
of Cd(II) and Zn(II) by T. gracilis. For instance, biosorption
of Cd(II) by live T. suecica reached a maximum adsorption
capacity of 40.22 mg g-1 (359 µmol g-1),35 but the authors
determined the free concentrations of metal by atomic spectroscopy after a contact time of 72 h, a condition in which bioaccumulation processes are occurring, whereas in the present work, only biosorption at short contact times was investigated.
Conclusion
Direct voltammetric measurements on T. gracilis
suspensions in seawater (pH 8.2) revealed that adsorption capacity and conditional equilibrium constants are higher for Zn(II) than that for Cd(II). Biosorption in mixtures of Cd(II) and Zn(II) decreased the adsorption capacity of both metal species, especially for Cd(II). On the other hand, the conditional equilibrium constant for Cd(II) increased by about one-unit in the binary system, suggesting the occurrence of minor high affinity binding sites (probably sulfhydryl groups) for this metal at the external surface of the cell membrane. Thus, under conditions of depleted
Zn(II), the log K´ and KDEF values suggest that the
microalgae surface can strongly bind Cd(II), a first step in the bioaccumulation and further biomagnification of this toxic metal in higher trophic levels of the marine food web.
Acknowledgements
Authors are grateful to Conselho Nacional de Desenvolvimento Científico e Tecnológico (CNPq) for the financial support (Grants 475554/2009-4 and 304178/2009-8).
References
1. Gadd, G. M.; J. Chem. Technol. Biotechnol. 2009, 84, 13. 2. Crist, R. H.; Oberholser, K.; Schwartz, D.; Marzoff, J.; Ryder, D.;
Crist, D. R.; Environ. Sci. Technol. 1988, 22, 755.
3. Crist, R. H.; Martin, J. R.; Guptill, P. W.; Eslinger, J. M.; Crist, D. R.; Environ. Sci. Technol. 1990, 24, 337.
4. Stumm, W.; Aquatic Surface Chemistry: Chemical Processes at the Particle-Water Interface; Wiley: New York, 1987, p. 520. 5. Williams, R. J. P.;. Pure Appl. Chem. 1983, 55, 35.
6. Savvaidis, I.; Hughes, M. N.; Poole, R. K.; Antonie Leeuwenhoek. 2003, 84, 99.
8. Waller, P. A.; Pickering, W. F. E.; Talanta 1990, 37, 981. 9. Rollemberg, M. C.; Goncalves, M. L. S.; dos Santos, M. M. C.;
Botelho, M. J.; Bioelectrochem. Bioenerg. 1999, 48, 61. 10. Kong, B.; Tang, B. Y.; Liu, X. Y.; Zeng, X. D.; Duan, H. Y.;
Luo, S. L.; Wei, W. Z.; J. Hazard. Mater. 2009, 167, 455. 11. Andrade, A. D.; Rollemberg, M. C. E.; Nobrega, J. A.; Process
Biochem. 2005, 40, 1931.
12. Price, N. M.; Morel, F. M. M.; Nature 1990, 344, 658. 13. Sunda, W. G.; Huntsman, S. A.; Environ. Sci. Technol. 1998,
32, 2961.
14. Moura, A. M.; Neto, E. B.; Koening, M. L.; Leca, E. E.; Braz. Arch. Biol. Technol. 2007, 50, 461.
15. Guillard, R. R.; Ryther, J. H.; Can. J. Microbiol. 1962, 8, 229. 16. Rigobello-Masini, M.; Masini, J. C.; Aidar, E.; FEMS Microbiol.
Ecol. 2006, 57, 18.
17. Rigobello-Masini, M.; Aidar, E.; Masini, J.; Braz. J. Microbiol.
2003, 34, 267.
18. Rigobello-Masini, M.; Masini, J. C.; Anal. Chim. Acta 2001,
448, 239.
19. Pehrsson, L.; Ingman, F.; Johansson, A.; Talanta 1976, 23, 769. 20. Masini, J. C.; Abate, G.; Lima, E. C.; Hahn, L. C.; Nakamura, M. S.; Lichtig, J.; Nagatomy, H. R.; Anal. Chim. Acta 1998,
364, 223.
21. Pinheiro, J. P.; Mota, A. M.; Goncalves, M. L. S.; Anal. Chim. Acta 1994, 284, 525.
22. Ruzic, I.; Anal. Chim. Acta 1982, 140, 99.
23. Altmann, R. S.; Buffle, J.; Geochim. Cosmochim. Acta 1988,
52, 1505.
24. Masini, J. C.; Anal. Chim. Acta 1993, 283, 803.
25. Kiefer, E.; Sigg, L.; Schosseler, P.; Environ. Sci. Technol. 1997,
31, 759.
26. Han, X.; Wong, Y. S.; Tam, N. F. Y.; J. Colloid Interface Sci.
2006, 303, 365.
27. Schijf, J.; Ebling, A. M.; Environ. Sci. Technol. 2010, 44, 1644. 28. Schiewer, S.; Wong, M. H.; Chemosphere 2000, 41, 271. 29. Vilar, V. J. P.; Botelho, C. M. S.; Pinheiro, J. P. S.; Domingos,
R. F.; Boaventura, R. A. R.; J. Hazard. Mater. 2009, 163, 1113. 30. Gonzalez-Davila, M.; Santana-Casiano, J. M.; Laglera, L. M.;
Mar. Chem. 2000, 70, 161.
31. Parmeggiani, A. C.; Masini, J. C.; J. Braz. Chem. Soc. 2003,
14, 416.
32. Schiewer, S.; Volesky, B.; Environ. Sci. Technol. 1997, 31, 2478. 33. Masini, J. C.; Talanta 1994, 41, 1383.
34. Jiang, W.; Saxena, A.; Song, B.; Ward, B. B.; Beveridge, T. J.; Myneni, S. C. B.; Langmuir 2004, 20, 11433.
35. Perez-Rama, M.; Torres, E.; Suarez, C.; Herrero, C.; Abalde, J.;
J. Environ. Manage. 2010, 91, 2045.
36. Perez-Rama, M.; Alonso, J. A.; Lopez, C. H.; Vaamonde, E. T.;
Bioresour. Technol. 2002, 84, 265.
37. Cruz, B. H.; Diaz-Cruz, J. M.; Arino, C.; Esteban, M.; Environ. Sci. Technol. 2005, 39, 778.
38. Van Leeuwen, H.; Cleven, R.; Buffle, J.; Pure Appl. Chem.
1989, 61, 255.
39. Perez-Rama, M.; Vaamonde, E. T.; Alonso, J. A.; Environ. Toxicol. Chem. 2006, 25, 128.
40. Okamoto, O. K.; Asano, C. S.; Aidar, E.; Colepicolo, P.;
J. Phycol. 1996, 32, 74.
41. Monteiro, C. M.; Castro, P. M. L.; Malcata, F. X.; Environ. Chem. Lett. 2011, 9, 511.
Submitted: February 5, 2013 Published online: May 21, 2013