www.atmos-chem-phys.net/9/6479/2009/ © Author(s) 2009. This work is distributed under the Creative Commons Attribution 3.0 License.
Chemistry
and Physics
Distribution and sources of bioaccumulative air pollutants at
Mezquital Valley, Mexico, as reflected by the atmospheric plant
Tillandsia recurvata
L.
A. Zambrano Garc´ıa1, C. Medina Coyotzin1, A. Rojas Amaro1, D. L´opez Veneroni1, L. Chang Mart´ınez2, and G. Sosa Iglesias1
1Direcci´on Ejecutiva de Investigaci´on y Posgrado, Instituto Mexicano del Petr´oleo, M´exico D.F., Mexico 2Universidad Michoacana de San Nicol´as de los Hidalgo, Morelia, Mexico
Received: 21 January 2009 – Published in Atmos. Chem. Phys. Discuss.: 4 March 2009 Revised: 18 June 2009 – Accepted: 5 July 2009 – Published: 8 September 2009
Abstract. Mezquital Valley (MV), a Mexican wastewater-based agricultural and industrial region, is a “hot spot” of regulated air pollutants emissions, but the concurrent unreg-ulated ones, like hazardous metals and polycyclic aromatic hydrocarbons (PAH), remain undocumented. A biomonitor-ing survey with the epiphyticTillandsia recurvatawas con-ducted there to detect spatial patterns and potential sources of 20 airborne elements and 15 PAH. The naturalδ13C andδ15N ratios of this plant helped in source identification. The re-gional mean concentration of most elements was two (Cr) to over 40 times (Ni, Pb, V) higher than reported forTillandsia in other countries. Eleven elements, pyrene and chrysene had 18–214% higher mean concentration at the industrial south than at the agricultural north of MV. The total quantified PAH (mean, 572 ng g−1; range, 143–2568) were composed by medium (65%, phenanthrene to chrysene), low (28%, naph-thalene to fluorene) and high molecular weight compounds (7%, Benzo(b)fluoranthene to indeno(1,2,3-cd)pyrene). The δ13C (mean,−14.6‰; range,−15.7‰ to−13.7‰) was con-sistently lower than−15‰ near the major petroleum com-bustion sources. Theδ15N (mean,−3.0‰; range,−9.9‰ to 3.3‰) varied from positive at agriculture/industrial areas to negative at rural sites. Factor analysis provided a five-factor solution for 74% of the data variance: 1) crustal rocks, 39.5% (Al, Ba, Cu, Fe, Sr, Ti); 2) soils, 11.3%, contrasting con-tributions from natural (Mg, Mn, Zn) and saline agriculture soils (Na); 3) cement production and fossil fuel combustion, 9.8% (Ca, Ni, V, chrysene, pyrene); 4) probable agricultural biomass burning, 8.1% (K and benzo(g, h, i)perylene), and
Correspondence to: A. Zambrano Garc´ıa (azambran@imp.mx)
5) agriculture with wastewater, 5.2% (δ15N and P). These results indicated high deposition of bioaccumulative air pol-lutants at MV, especially at the industrial area. SinceT. re-curvatareflected the regional differences in exposition, it is recommended as a biomonitor for comparisons within and among countries where it is distributed: southern USA to Argentina.
1 Introduction
Monitoring airborne metals, polycyclic aromatic hydrocar-bons (PAH) and other bioaccumulative compounds with liv-ing organisms (biomonitorliv-ing) is a technique in use and re-finement since at least the 1960’s. It is a multipurpose envi-ronmental tool for exploring pollutant occurrence and disper-sion trends at different geographical/time scales, to identify emission sources, estimate atmospheric deposition and relate biological/ecological changes to air pollution (Aboal et al., 2006; Conti and Cecchetti, 2001; Pirintsos and Lopi, 2008; Segala et al., 2008; Wolterbeek, 2002). Since bioaccumula-tive air pollutants usually travel in particles, biomonitoring is done preferentially with organisms that rely on the atmo-sphere as primary source of moisture and nutrients, such as lichens, mosses and some vascular plants. This dependence is indicated by positive correlations between the concentra-tion of pollutants in the biomonitor tissues and the amount of atmospheric deposition (Sloff, 1995; St. Clair et al., 2002; Wolterbeek, 2002).
soil and water pollution problems caused by over 100 years of agricultural irrigation with untreated sewage water from Mexico City (Cifuentes et al., 1994; Downs et al., 1999; Friedel et al., 2000; Siebe, 1994; V´azquez-Alarc´on et al., 2001). Mezquital Valley is also a major Mexican “hot spot” in emissions of particulate matter, SO2and other regulated pollutants by the Tula-Tepeji-Vito industrial corridor located there (SEMARNAT-INE, 2006). Nevertheless, there is very little information on the expected concurrence of unregulated air toxics at MV, such as hazardous metals, PAH and other persistent organic pollutants.
This survey explored MV for spatial deposition trends and potential sources of 20 trace and major elements and 15 hazardous PAH using the “ball moss” (Tillandsia recur-vataL.) as a natural receptor. This epiphytic Bromeliaceae is very common at the study region, where it mainly grows on mesquite trees (Prosopis laevigata(Willd) M. C. Johnst.). Adult individuals are spherical, ca. 10–12 cm in diameter, easy to recognize in the field and collect by hand. They have a reduced stem and non-functional roots. Most of their biomass is formed by linear leaves profusely covered with absorptive trichomes. This latter morphological feature in-creases the ability of this plant to capture moisture and parti-cles directly from the surrounding air, which justifies nam-ing it as an “air” or “atmospheric” plant (Schmitt et al., 1989). Tillandsia recurvata has some physiological resis-tance to high levels of O3 and SO2 (Benzig et al., 1992), which may partially explain why is it so abundant at the polluted MV. This and other atmosphericTillandsiaspecies have been used as in situ air pollution biomonitors in some southern US states and Latin-American countries, where this genus is exclusively distributed (e.g., De Sousa et al., 2007; Husk et al., 2004; Pignata et al., 2002; Pyatt et al., 1999; Schrimpff, 1984; Smodiˇs et al., 2004; Wannaz et al., 2006a, b). Successful transplanting ofTillandsiafrom rural into ur-ban areas for similar purposes has been reported by Brighina et al. (2002), Figuereido et al. (2007), and Malm et al. (1998). The naturalδ13C andδ15N stable isotope ratios ofT. re-curvatawere determined as additional information to iden-tify regional sources of air pollution. These ratios express the 13C to12C and15N to 14N proportions in the samples relative to their proportions in standard materials. They are sensitive to spatial and time variations in the isotopic com-position of the C and N sources used by plants (Bukata and Kyser, 2007; Liu et al., 2008; Norra et al., 2005; Skinner et al., 2006; Solga et al., 2006). Since most constitutive plant carbon derives from12CO2fixed directly from the at-mosphere by photosynthesis, plant δ13C ratios are particu-larly useful in detecting air pollution by the12C-rich emis-sions from fossil fuel combustion. These emisemis-sions have significantly lower13CO2:12CO2 ratios than unpolluted air, as indicated byδ13C values around−25‰,−30‰,−40‰ and−8‰ for coal, petroleum, natural gas and clean air, re-spectively (Pichlmayer et al., 1998). The mixing of fossil fuel emissions with clean air is thus related to the commonly
low air δ13C values at urban/industrial areas compared to rural/remote locations (e.g., −12‰ vs. −8‰, respectively, Boutton, 1991). Because of the increase in the air concentra-tions of12CO2caused by fossil fuel emissions and the prefer-ential photosynthetic fixation of this form of carbon dioxide over13CO2, plants exposed to such pollution develop lower δ13C values than those growing under clean air. In contrast, the plantδ15N changes related to air pollution sources can-not be interpreted straightforward because of the variety of N compounds involved, their emission and deposition forms, and the complex isotopic fractionation processes occurring within and between the sources and the plant receptors. The naturalδ15N values of land plants range roughly from−7‰ to +9‰ (Kelly et al., 2005). They can change because of the isotopic composition of the N sources and the ability of each plant species to discriminate against 15N. In gen-eral, for plants obtaining nutrients exclusively from atmo-spheric sources, this ratio decreases if the deposited N com-pounds are dominated byδ15N values lower than theirs. Such compounds are usually reduced N species abundant at, but not restricted to, agriculture/farming areas: e.g., ammonia (NH3, δ15N: −10‰ to −40‰, several sources). Contrar-ily, this ratio increases in plants predominantly exposed to compounds withδ15N values higher than theirs, mainly ox-idized N species (NOx), which are more common to ur-ban/industrial areas because of the heavier use of fossil fuels (Jung et al., 1997; Skinner et al., 2006; Solga et al., 2005). Since agriculture and industry coexist at our study area, we expected theT. recurvataδ13C andδ15N to reflect these land uses.
A data matrix with 50 MV sites and 38 chemical vari-ables was reduced by standard univariate statistical tech-niques. Exploratory factor analysis (FA) of selected variables and mapping allowed us to detect the major regional emis-sion sources. As far as we know, this is the first report on the bioaccumulative air pollution of MV using biomonitor-ing techniques.
2 Materials and methods
2.1 Study area
agricultural areas and is now restricted to the foothills and highlands. Over 90 000 ha of MV are currently dedicated to agriculture with raw sewage water from Mexico City. This is the major cause of chemical and biological contamination of the regional soils (Siebe and Cifuentes, 1995). The Tepeji-Tula-Atitalaquia industrial corridor has about 140 industries, including a petroleum refinery (325 000 barrels day−1); a 1500 MW electricity power plant fueled with residual fuel oil and, secondarily, with natural gas, and over 20 cement plants. That power plant is the largest emitter of air tox-ics among similar Mexican facilities (CEPAL-SEMARNAT, 2004). The regional cement production relies on raw lime-stone material obtained nearby by dusty quarries. Cement is processed using residual fuel oil, petroleum coke and other materials, like used tires and industrial wastes. Other MV industries include non-ferrous metal manufacturing, textile, chemical, processed food, and disposal, recycling or incin-eration of waste materials. Cabrera et al. (2003) estimated the MV emissions of total suspended particles (TSP) from industrial and mobile sources in 21 538 ton year−1. This is a rather large amount representing ca. 80% of the same emis-sions at the much larger and higher populated Mexico City (27 308 ton year−1, SMA, 2006). The contribution from nat-ural and agricultnat-ural sources to the MV air pollution is still unknown. Two major regional natural/crustal sources of par-ticulate material are the Cretaceous limestone (El Doctor Formation) that covers about 60% of MV, mainly exposed at the E-SE sector (Silva-Mora, 1997), and Lower Tertiary igneous rocks, roughly located at the valley’s west half.
2.2 Sampling and sample preparation
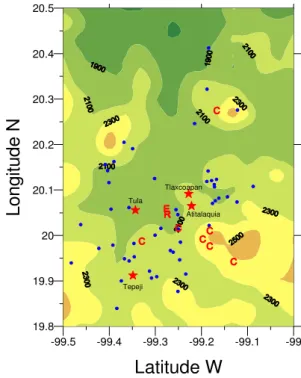
Tillandsia recurvatawas sampled at 50 sites throughout MV in the late spring and early summer, 2006 (Fig. 1). Most sites were at mountain foothills where mesquite trees, from which the biomonitor was obtained, are more common. In a few sites lacking this tree, sampling was done on alternative trees and cacti. The mean elevation of the sampling sites was 2200 m (min, 1879 m; max, 2435 m). Three composite sam-ples per site were collected from tree branches at≥1 m from the ground, each composed by six to eight “ball moss” in-dividuals from different trees. Cross contamination between samples was avoided by wearing new dust-free latex gloves per sample. Samples were taken to the laboratory in air-dried condition in brown paper bags, and stored at ambient temper-ature until processing (late September–October 2006). They were manually cleaned prior to chemical analyses by remov-ing dead plant parts as well as insects, feathers and spider webs, among other materials extraneous to the samples, but were not subjected to further cleaning procedures, as recom-mended for air pollution biomonitoring with plants (Rossini Oliva and Raitio, 2003). The samples were then subdivided into three portions for metal, PAH and isotopic analyses, and stored in polyethylene bags at−40◦C until analyses. Since T. recurvatais perennial, potential age-related variability in
-99.5 -99.4 -99.3 -99.2 -99.1 -99
Latitude W
19.8 19.9 20 20.1 20.2 20.3 20.4 20.5
L
o
n
g
it
u
d
e
N
Tula
Tepeji
Tlaxcoapan
Atitalaquia
Fig. 1. Mezquital Valley study area. Symbols: dots, sampling sites; stars, main urban settlements; E, electricity power plant; R, petroleum refinery; C, cement plants. The isoline numbers indicate topographic elevation (m).
pollutant bioaccumulation was minimized by analyzing only the newest 3–4 pairs of leaves per shoot. Thus, the time pe-riod of environmental exposition was assumed to be similar among sites, probably representing one or two years.
2.2.1 Metals
The glass and Teflon material for sample digestion was cleaned by immersion in 10% HNO3(24 h) followed by pro-fuse rinsing with deionized water. The plant samples were oven-dried to constant weight (70◦C, three days) and ground to fine powder with agate mortar and pestle. A fraction of the powder (0.15–0.2 g per sample) was digested with 6.0 ml HNO3(65%, Merck), 4.0 ml HCl (38%, JT Baker, Ultrex II), and 0.2 ml HF (48%, JT Baker, Ultrex II) in a microwave oven (Anton Paar, Multiwave 3000) using the “pine nee-dles” program: phase I (power, 1400 W; ramp, 10 min; hold, 10 min; fan 1), phase 2 (power, 0 W; hold, 30 min; fan 2). Digestion temperature was 180◦C. The digests were filtered with Whatman 4 paper and brought to 25 ml with deionized water.
was checked up by injecting element mixtures (Ultra Sci-entific) every 10–15 samples. The percent recovery of seven certified elements in seven equally processed sam-ples of the NIST 1575a standard reference material (trace elements in pine needles) was (mean±coefficient of vari-ation): Al (102.2±2.0), Ca (113.5±10.1), Fe (117.3±7.5), Mg (84.8±13.9), P (96.5±2.0), Zn (83.0±5.1). The recov-ery of Ba was low (35.8±6.4%), but was very good for In (103.7±2.9%), which was added as surrogate from a 5.0 ppm standard solution.
2.2.2 PAH
The samples were organically extracted in microwave oven and analyzed by high performance liquid chromatography (HPLC) for the 15 PAH listed in Table 1. All glassware and Teflon materials for sample preparation were cleaned with liquid detergent (Liqui Nox), running water and consecutive rinsing with bidistilled water, acetone and dichloromethane (DCM). Samples (5 to 8 g, air-dry weight) were frozen with liquid nitrogen and ground to powder with ceramic mortar and pestle. A fraction of the powder (0.25–0.5 g) was oven-dried (90◦C, 24 h) for dry weight determination and about 2.0 g were extracted in 10-sample batches with 30 ml DCM in microwave oven (CEM, model MarsX). The oven was programmed according to USEPA 3546 method: potency, 1200 W; pressure, 100 psi; temperature, 115◦C; time, 15 min; total extraction time, 30 min; cooling, 2 h. Each extraction batch included one pure DCM blank and one positive lab-oratory control sample (LCS). The LC samples were added 0.5 g of dehydrated and deactivated Cromosorb (60/80 mesh, Supelco, Inc; 400◦C for 4 h) as a surrogate for the vegetal matrix and 200µl of standard mixture containing 5µg ml−1 of each target PAH (Chemservice). The extracts were filtered through Millipore membrane and concentrated to 1.0 ml un-der a gentle stream of ultrapure nitrogen supplied with a ni-troevaporator (8158, N EVAP111, Organomation Associates, Inc). The concentrates were cleaned with chromatographic glass columns (40 cm length×1.5 cm ID) filled with deacti-vated (400◦C for 4 h) alumina-silica-gel (USEPA 3610B and 3630C). The columns were packed from bottom to top with 1.0 cm silanized glass fiber (Alltech) humidified with DCM, 10 g alumina (Baker, Inc.), 3.0 g silica gel (60/200 mesh, Mallincroft) and 2.0 g anhydrous sodium sulfate (JT Baker) dissolved in DCM. Extra DCM (30 ml) was added to the columns for final PAH separation. Eluates were captured in glass vials and concentrated to 1.0 ml under ultrapure nitro-gen. They were then changed into acetonitrile (4.0 ml, Bur-dick & Jackson), filtered with 0.2µm acrodiscs (Pall Gelman Laboratory), reconcentrated to 0.5 ml with ultrapure nitrogen and stored at−40◦C in amber glass vials until analyses.
The extracts were analyzed with a liquid chromatograph (Agilent HP, 1100 series) equipped with Nucleosil column (Macherey-Nagel, 265 mm, 100-5 C18 PAH), automatic sample injector, and DAD and fluorescence detectors. The
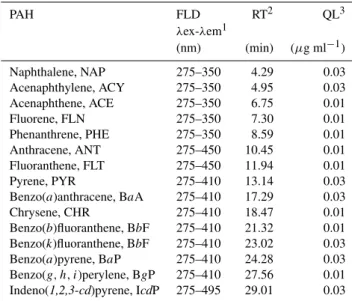
Table 1.Target PAH and HPLC analytical parameters.
PAH FLD RT2 QL3
λex-λem1
(nm) (min) (µg ml−1)
Naphthalene, NAP 275–350 4.29 0.03
Acenaphthylene, ACY 275–350 4.95 0.03
Acenaphthene, ACE 275–350 6.75 0.01
Fluorene, FLN 275–350 7.30 0.01
Phenanthrene, PHE 275–350 8.59 0.01
Anthracene, ANT 275–450 10.45 0.01
Fluoranthene, FLT 275–450 11.94 0.01
Pyrene, PYR 275–410 13.14 0.03
Benzo(a)anthracene, BaA 275–410 17.29 0.03
Chrysene, CHR 275–410 18.47 0.01
Benzo(b)fluoranthene, BbF 275–410 21.32 0.01 Benzo(k)fluoranthene, BbF 275–410 23.02 0.03 Benzo(a)pyrene, BaP 275–410 24.28 0.03 Benzo(g, h, i)perylene, BgP 275–410 27.56 0.01 Indeno(1,2,3-cd)pyrene, IcdP 275–495 29.01 0.03
1 Fluorescence detector excitation (ex) and emission (em) wave
length;2retention time;3Quantification limit.
analyses were done in 10-sample batches plus one blank and one positive control. A calibration curve per batch was devel-oped with seven concentrations (0.0625 to 5.0µg ml−1) of stock acetonitrile solution containing 5µg ml−1of each tar-get PAH. Samples were added 150µl of 4,4′-difluorobifenil (Chemservice) solution in acetonitrile (4µg ml−1) as inter-nal standard. Solvent A (methanol, 50%; acetonitrile, 25%; HPLC water, 25%) was injected from 0 to 3 min and gradu-ally exchanged by solvent B (acetonitrile) from 3 to 21 min. Only this latter solvent was added from 21 to 35 min. The in-jection volume was 5µl; flux, 0.3 ml min−1; column temper-ature, 25◦C; wavelength (FLD: 275–495 nm, Table 1; DAD: 230 nm). The total time of analysis per sample extract was 30 min. The method validation parameters were: linear-ity (R2>.98); accuracy and precision (RSD<3%); detection limit (0.004µg ml−1) and quantification limits, depending on the compound, 0.01 to 0.03µg ml−1(Table 1).
2.2.3 δ13C andδ15N
Air-dried samples (200–500 mg) were ground with cleaned ceramic mortar and pestle under liquid nitrogen, and dried at 80◦C for 24 h. Theδ13C andδ15N ratios were determined with a dual carbon and nitrogen analyzer coupled to a con-tinuous flow isotope ratio mass spectrometer (Europa Scien-tific). Equipment precision was 0.1‰ for C and 0.2‰ for N. The isotopic composition is defined by:
standards to determineδ13C and δ15N, respectively (Mari-otti, 1974; Coplen, 1995).
2.3 Statistics
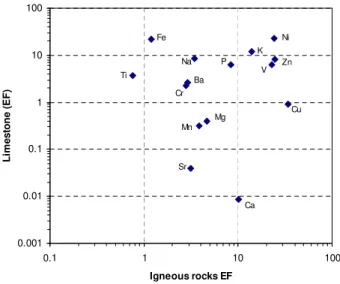
The raw site-pollutant data base was regionally summarized by simple central tendency and dispersion statistics. The ge-ographical distribution of pollutants was explored by map-ping with a geostatistical gridding method for irregularly spaced data (Surfer, Ver. 7.05, Kriging method) and com-paring concentrations between and among MV areas with t-tests or ANOVA, as appropriate. Potential emission sources were explored by factor analyses (FA) with principal com-ponent extraction and normalized varimax rotation (Statis-tica, Ver. 6.0). Since 50 sampling sites was a small num-ber of cases, FA was used conservatively. Only 20 pollutants were included in FA to keep a 2.5 site to variable ratio. The standardized median site values were used for FA. Pollutants excluded from this analysis had one or more of the follow-ing problems: they were not detected or below quantifica-tion levels at≥8 sampling sites (i.e., 16% of sites: Pb, Sb, BaA, BbF, BkF, BaP and IcdP); high skewness (>2) and/or kurtosis (>7); strong deviation from normality even after log transformation (Shapiro-Wilk test); no significant correlation with any other pollutant, because they tended to form factors with single pollutants (e.g., Cd and Cr), or contrarily, very high correlation (r>0.9), which may lead to multicollinear-ity. All low and some medium molecular weight PAH, which predominantly disperse in the gas phase, were also excluded from FA (NAP, ACY, ACE, FLN, PHE, ANT and FLT). Fi-nally, the pollutant selection for FA was aided by consider-ing element signal to noise ratios (SNR), which relate the regional to the site variability, as defined by Wolterbeek et al. (1996), and the element enrichment factors (EF) calcu-lated as
EF=(Xs/Als)/(Xr/Alr)
where Xsand Alsare the sample element and aluminum con-centrations (ppm), respectively; Xr and Alr are the element and aluminum concentrations (ppm) in the main crustal rocks of MV: limestone, according to Lozano and Bernal (2005), and acidic igneous rocks, using averaged data from an inter-net data base by Surendra (2001).
3 Results and discussion
Mezquital Valley was biomonitored withT. recurvatato de-tect the regional dispersion trends and potential emission sources of airborne metals and PAH.
3.1 Metals
Table 2 summarizes the regional element concentrations in the biomonitor. Calcium was the most abundant element (re-gional mean, 1.3% on dry weight basis; min, 0.5%; max,
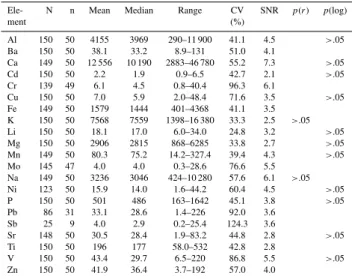
Table 2.Regional element concentrations inT. recurvata
(mg kg−1).
Ele- N n Mean Median Range CV SNR p(r) p(log)
ment (%)
Al 150 50 4155 3969 290–11 900 41.1 4.5 >.05 Ba 150 50 38.1 33.2 8.9–131 51.0 4.1
Ca 149 50 12 556 10 190 2883–46 780 55.2 7.3 >.05 Cd 150 50 2.2 1.9 0.9–6.5 42.7 2.1 >.05 Cr 139 49 6.1 4.5 0.8–40.4 96.3 6.1
Cu 150 50 7.0 5.9 2.0–48.4 71.6 3.5 >.05 Fe 149 50 1579 1444 401–4368 41.1 3.5
K 150 50 7568 7559 1398–16 380 33.3 2.5 >.05 Li 150 50 18.1 17.0 6.0–34.0 24.8 3.2 >.05 Mg 150 50 2906 2815 868–6285 33.8 2.7 >.05 Mn 149 50 80.3 75.2 14.2–327.4 39.4 4.3 >.05 Mo 145 47 4.0 4.0 0.3–28.6 76.6 5.5
Na 149 50 3236 3046 424–10 280 57.6 6.1 >.05 Ni 123 50 15.9 14.0 1.6–44.2 60.4 4.5 >.05 P 150 50 501 486 163–1642 45.1 3.8 >.05 Pb 86 31 33.1 28.6 1.4–226 92.0 3.6
Sb 25 9 4.0 2.9 0.2–25.4 124.3 3.6
Sr 148 50 30.5 28.4 1.9–83.2 44.8 2.8 >.05 Ti 150 50 196 177 58.0–532 42.8 2.8
V 150 50 43.4 29.7 6.5–220 86.8 5.5 >.05 Zn 150 50 41.9 36.4 3.7–192 57.0 4.0
N, number of samples; n, number of sampling sites with quantifi-able amount of elements; CV, coefficient of variation; SNR, mean signal to noise ratio; p(r) and p(log), probability associated to Shapiro-Wilks normality test for raw and log10 transformed data, respectively; empty cells, non-normal distribution.
4.5%). This indicated high regional exposure to limestone dust at MV, which is exacerbated by the cement indus-try. Predominance of Ca in lichen biomonitors growing near a cement plant was recently reported by Branquinho et al. (2008). They considered this element as the best indicator for cement-dust. Other major geological elements followed Ca in abundance (%): K (0.76)>Al (0.42)>Na (0.34) > Mg (0.29)>Fe (0.17)>P (0.05)>Ti (0.02)>Mn (0.008).
The trace elements constituted individually less than 0.005% of the T. recurvata dry biomass: V (0.0044) > Zn (0.0042) >Ba (0.0038)>Pb (0.0034) >Sr (0.0031) > Li (0.0018)> Ni (0.0016) >Cu (0.0007) >Cr (0.0006) > Sb (0.0005)>Mo (0.0004)>Cd (0.0002). The prevalence of V, an element typically abundant in crude oils (Bairwise, 1990), can be attributable to emissions from the major in-dustrial users of petroleum fuels at MV. This will be detailed later.
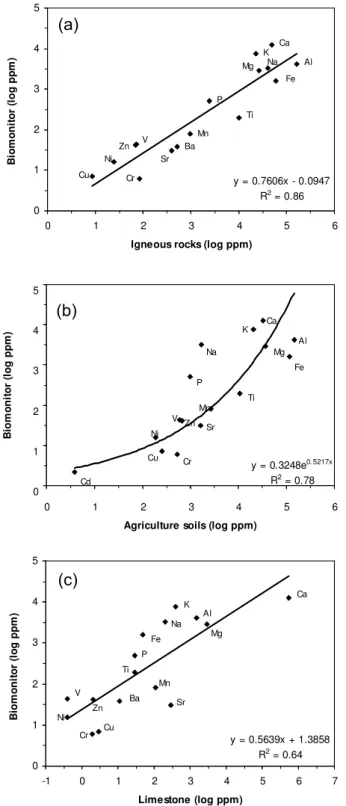
At the gross level of data reduction in Table 2, the element concentrations in T. recurvatareflected the composition of the MV acidic crustal rocks and agriculture soils (Fig. 2). According to this figure, there was a closer chemical similar-ity between the biomonitor and the igneous rocks (R2=0.86) than for soils (R2=0.78) and limestone (R2=0.64). Thus, a high proportion of the spatial element variability in the biomonitor could be expected to derive from these sources.
y = 0.7606x - 0.0947 R2 = 0.86
0 1 2 3 4 5
0 1 2 3 4 5 6
Igneous rocks (log ppm)
B io m o n it o r (l o g p p m ) Ca K Al Na Mg Fe Ti Mn V Zn Ba Sr Ni Cu Cr P
(a)
y = 0.5639x + 1.3858 R2 = 0.64 0 1 2 3 4 5
-1 0 1 2 3 4 5 6 7
Limestone (log ppm)
B io m o n it o r (l o g p p m ) Ca K Al Na Mg Fe P Mn Sr Ti Ba V Zn Cu Cr Ni
(c)
y = 0.3248e0.5217x
R2 = 0.78
0 1 2 3 4 5
0 1 2 3 4 5 6
Agriculture soils (log ppm)
B io m o n it o r (l o g p p m ) Ca K Al Mg Na Fe P Ti Mn V Zn Sr Ni
Cu Cr
Cd
(b)
Fig. 2. Elements in T. recurvata and crustal/soil sources at Mezquital Valley (log10transformed mean values, ppm=mg kg−1). Geochemical data: acidic igneous rocks, calculated from Verma-Surendra (2001); agricultural soils, median values among Flores-Delgadillo et al. (1992), Hern´andez-Silva et al. (1994), Huerta et al. (2002), Lucho-Constantino et al. (2005), and Siebe (1994); lime-stone (Lozano and Bernal, 2005).
(MV:OT). This ratio was≥2 in 25 out of 44 cases in Table 3, which implies≥100% higher bioaccumulation by the Mexi-canTillandsia. The difference was larger for anthropogenic elements such as Ni, Pb and V, whose respective concen-trations at MV were 79, 66 and up to 43 times higher than measured inTillandsia biomonitors from Argentina (Wan-naz et al., 2006a, b). Assuming similar interspecies ability to capture and retain airborne metals, such differences indi-cate that regional atmospheric deposition levels at MV are at least as high as indicated by those ratios. The MV:OT ratio was <1.0 only in 11 cases; i.e., lower element con-centration at MV (Table 3). Most of them involved Cu and Zn biomonitored within urban/industrial areas at S˜ao Paulo, Brazil (Figuereido et al., 2007), Cali and Medellin, Colombia (Schrimpff, 1984). This is attributable to the fewer rural sites included in these studies, which are usually less exposed to anthropogenic emissions and tend to lower the regional mean estimates.
3.2 PAH
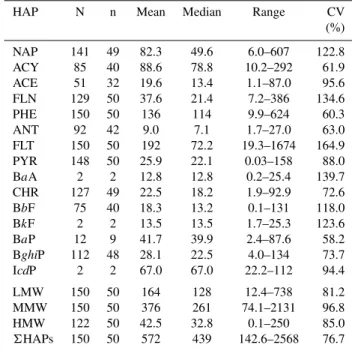
Table 4 summarizes the regional concentration and variabil-ity of PAH in the biomonitor. The sum of quantified PAH per site ranged from 143 to 2568 ng g−1, with regional mean and median equal to 572 and 439 ng g−1, respectively, indicat-ing a data distribution skewed to the right. Apart from PHE and CHR, which were lognormally distributed, the rest of PAH had neither normal nor lognormal distributions. The re-gional variability of PAH depended on the compound, rang-ing from 58% (ACY) to 165% (FLN). The medium molec-ular weight PAH (MMW: PHE, ANT, FLT, PYR, BaA and CHR) was the most abundant group, representing 64.5% of the total measured PAH. The low molecular weight PAH (LMW: NAP, ACY, ACE and FLN) constituted 28.1%, and the high molecular weight (HMW: BbF, BkF, BaP, BghiP and IcdP) only 7.3%. The relatively low amount of the most hazardous PAH group (HMW) deserves further research to be explained. Hypothetically, it may be attributed to pho-todegradation enhanced by the high solar irradiation rates re-ceived in this tropical semiarid region and the scarce protec-tion from it provided by the very open local vegetaprotec-tion.
The most frequent PAH were FLT, FLN, PHE and PYR, which were present at all sampled sites, followed by CHR, NAP and BghiP, which were missed only at one or two sites. Most HMW PAH had low to very low frequencies. For in-stance, BaP had quantifiable levels at only nine sites, and BaA, BkF and IcdP at the two sites closest to the petroleum refinery and the electrical power plant (Fig. 1). The most abundant compounds were FLT (24.2% of total quantified PAH, regional average), PHE (17.1%) and NAP (10.4%).
Table 3. Elements in otherTillandsiabiomonitors from other countries (OT) respect toT. recurvataat Mezquital Valley, Mexico (MV). Units: mg kg−1; values in parentheses, MV:OT ratio.
Element MV Argentina1 Argentina2 Brazil3 Colombia4 Colombia5 US6
Al 4155 1112 (3.7)
Ba 38.1 36.8 (1)
Ca 12 556 3312 (3.8) 4160 (3.0)
Cd 2.2 0.4 (5.3) 0.82 (2.6)
Cr 6.1 2.2 (2.8)
Cu 7.0 0.9 (7.8) 0.9 (7.0) 19.3 (0.4) 52.7 (0.1) 30.5 (0.2) 7.1 (1.0) Fe 1579 223 (7.1) 257 (6.1) 1144 (1.4) 575 (2.7)
K 7568 5890 (1.3) 2550 (3.0)
Mg 2906 2025 (1.4) 414 (7.0)
Mn 80.3 22.6 (3.6) 22.3 (3.6) 174 (0.5) 52.8 (1.5)
Na 3236 1923 (1.7)
Ni 15.9 0.2 (79.4) 0.2 (79.4) 11.9 (1.3) 52.8 (0.3) Pb 33.1 0.5 (66.2) 0.5 (66.2) 40.6 (0.8) 26.3 (1.3)
Sb 4.0 0.5 (8.0)
V 43.4 1.0 (43.4) 1.1 (39.5) 2.7 (16.1)
Zn 41.9 4.0 (10.5) 3.8 (11.0) 111 (0.4) 119 (0.4) 379 (0.1) 73.5 (0.6)
1Wannaz et al. (2006a),T. capillaris;2Wannaz et al. (2006b),T. permutata;3Figuereido et al. (2007),T. usneoides, average value for the
two-months transplanting period presenting the maximum concentration, excluding the control site,4,5Schrimpff (1984), Cali and Medell´ın cities, respectively;6Husk et al. (2004),T. usneoidesin Florida, samples recollected in 1998. Empty cells: data not reported.
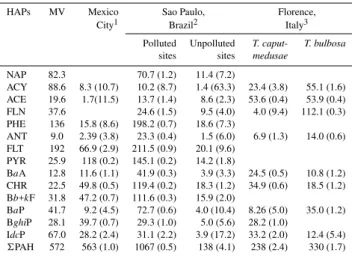
capture and retain them, and design aspects of the biomon-itoring studies; for instance, number and type of sampling sites, length of exposure and sampling strategy (in situ vs. transplanted samples). No difference was clear between the total PAH at MV and one heavily polluted site at Mex-ico City measured by Hwang et al. (2003) with pine nee-dles, a morphologically and physiologically different recep-tor. The mean total PAH reported forT. usneoidesfrom pol-luted sites in R´ıo de Janeiro (De Sousa et al., 2007) dou-bled the mean value at MV. Nevertheless, the most polluted MV sites had similar or slightly different total PAH (1284– 1748 ng g−1) than the polluted sites at Rio de Janeiro, and no MV site had lower total PAH than unpolluted Brazilian sites (93 to 175 ng g−1). Levels of total PAH at MV were 70% to 140% higher than recorded for two different Tilland-siaspecies transplanted from Costa Rica into downtown Flo-rence, Italy, for eight months (Brighina et al., 2002).
3.3 δ13C andδ15N
The spatial patterns of theδ13C andδ15N inT. recurvata re-flected quite well the main land uses at MV. Interestingly, these ratios showed that this epiphyte is naturally less dis-criminatory against13C and more discriminatory against15N than most terrestrial plants.
The regionalδ13C ratio (mean,−14.6‰; min,−15.7‰; max,−13.7‰) was similar to known values for this species (−15.3‰ to −13.2‰, Martin, 1994) and within range for Tillandsia with crassulacean acid metabolism (CAM; δ13C>−20‰, Crayn et al., 2004); i.e., plants which fix CO2
Table 4.Regional PAH concentrations (ng g−1) inT. recurvata.
HAP N n Mean Median Range CV
(%)
NAP 141 49 82.3 49.6 6.0–607 122.8
ACY 85 40 88.6 78.8 10.2–292 61.9
ACE 51 32 19.6 13.4 1.1–87.0 95.6
FLN 129 50 37.6 21.4 7.2–386 134.6
PHE 150 50 136 114 9.9–624 60.3
ANT 92 42 9.0 7.1 1.7–27.0 63.0
FLT 150 50 192 72.2 19.3–1674 164.9
PYR 148 50 25.9 22.1 0.03–158 88.0
BaA 2 2 12.8 12.8 0.2–25.4 139.7
CHR 127 49 22.5 18.2 1.9–92.9 72.6
BbF 75 40 18.3 13.2 0.1–131 118.0
BkF 2 2 13.5 13.5 1.7–25.3 123.6
BaP 12 9 41.7 39.9 2.4–87.6 58.2
BghiP 112 48 28.1 22.5 4.0–134 73.7
IcdP 2 2 67.0 67.0 22.2–112 94.4
LMW 150 50 164 128 12.4–738 81.2
MMW 150 50 376 261 74.1–2131 96.8
HMW 122 50 42.5 32.8 0.1–250 85.0
6HAPs 150 50 572 439 142.6–2568 76.7
Table 5. Mean PAH concentration (ng g−1) in T. recurvataat Mezquital Valley (MV) andTillandsiain other countries (OT). Val-ues in parentheses are the MV:OT ratio.
HAPs MV Mexico Sao Paulo, Florence, City1 Brazil2 Italy3
Polluted Unpolluted T. caput- T. bulbosa sites sites medusae
NAP 82.3 70.7 (1.2) 11.4 (7.2)
ACY 88.6 8.3 (10.7) 10.2 (8.7) 1.4 (63.3) 23.4 (3.8) 55.1 (1.6) ACE 19.6 1.7(11.5) 13.7 (1.4) 8.6 (2.3) 53.6 (0.4) 53.9 (0.4) FLN 37.6 24.6 (1.5) 9.5 (4.0) 4.0 (9.4) 112.1 (0.3) PHE 136 15.8 (8.6) 198.2 (0.7) 18.6 (7.3)
ANT 9.0 2.39 (3.8) 23.3 (0.4) 1.5 (6.0) 6.9 (1.3) 14.0 (0.6) FLT 192 66.9 (2.9) 211.5 (0.9) 20.1 (9.6)
PYR 25.9 118 (0.2) 145.1 (0.2) 14.2 (1.8)
BaA 12.8 11.6 (1.1) 41.9 (0.3) 3.9 (3.3) 24.5 (0.5) 10.8 (1.2) CHR 22.5 49.8 (0.5) 119.4 (0.2) 18.3 (1.2) 34.9 (0.6) 18.5 (1.2) Bb+kF 31.8 47.2 (0.7) 111.6 (0.3) 15.9 (2.0)
BaP 41.7 9.2 (4.5) 72.7 (0.6) 4.0 (10.4) 8.26 (5.0) 35.0 (1.2) BghiP 28.1 39.7 (0.7) 29.3 (1.0) 5.0 (5.6) 28.2 (1.0)
IdcP 67.0 28.2 (2.4) 31.1 (2.2) 3.9 (17.2) 33.2 (2.0) 12.4 (5.4) 6PAH 572 563 (1.0) 1067 (0.5) 138 (4.1) 238 (2.4) 330 (1.7)
1Hwang et al. (2003): measurements inPinus maximartinezii
nee-dles at one site with vehicle/industrial emissions.2After de Souza Pereira et al. (2007): average summer and winter measurements in
T. usneoides. 3Brighigna et al. (2002): eight-month transplanting study at an urban site. Empty cells: data not reported.
predominantly at night as a water-saving adaption to arid environs (Pierce et al., 2002). This ratio was the most ho-mogeneous of the measured variables. It varied only 2‰ throughout MV (CV, 9.0%). Its less negative values oc-curred at the predominantly rural NW sector of the valley (δ13C =−14.3‰ ±0.13, mean±standard error), being on average 0.6‰ higher than at the industrialized SE sector (−14.9‰ ±0.12; p<0.006 from one-way ANOVA by sec-tors). This suggests that T. recurvata has a “background” δ13C signature similar to values recorded at the NW sector of MV (−14.3‰, on average).
The δ13C values ofT. recurvata decreased from the ru-ral periphery of MV to the core industrial area, from values
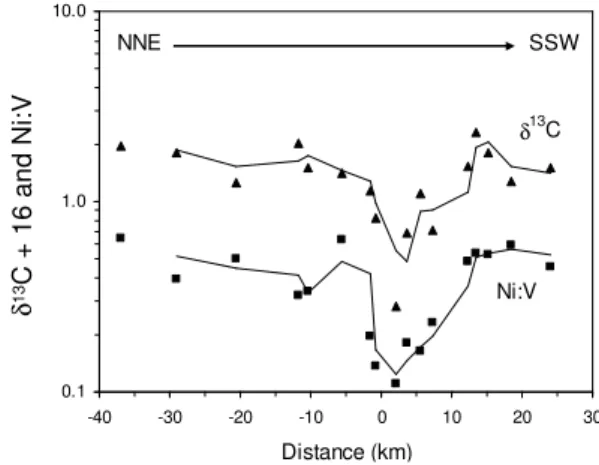
≥−14.5‰ to≤−15‰ (Fig. 3a). This negative shift reflected the increased emissions of13C-depleted compounds from in-dustrial fossil fuel combustion. The crude oils processed there have an averageδ13C =−27‰, as inferred from avail-able data for Mexican petroleum (e.g., Macko and Parker, 1983; Prinzhofer et al., 2000); i.e., 12.4‰ more negative than the mean value forT. recurvata. The effect from petroleum sources was further recognized by the regional correlation of δ13C with the Ni/V ratio (r=0.39,p=0.01), which was even closer (r=0.70, p=0.001) when considering only the sam-pling sites along a belt transect in the predominant wind di-rection (NE-SW). Since Ni and V are the predominant trace metals in crude oils and keep relatively constant mutual pro-portions, their ratios (Ni/V or V/Ni) are used for geochem-ical classification of crude oils (Bairwise, 1990) and as en-vironmental indicators for petroleum sources (Ganor et al.,
1988). Figure 4 illustrates the parallel pattern followed by δ13C and Ni/V along a NE-SW transect, including a sharp de-cline at the closest downwind sites from the main petroleum sources (km 0). The regional mean Ni/V for T. recurvata was 0.49±0.29 (n=50). The lower (<0.20) and higher val-ues (>0.80) of this ratio occurred, respectively, near and far from the petroleum facilities. The Mexican crude oils used at MV have Ni/V values ranging from 0.07 to 0.24, and 0.17 on average, calculated from data by Castro and Vazquez (2009) and Espinosa Pena et al. (1996). Thus, the biomonitor tended to acquire Ni/V values similar to crude oil at the sites more exposed to petroleum combustion emissions (Fig. 4).
The spatial pattern ofδ15N reflected clearly the agricul-ture, industrial and rural land uses at MV. The regional mean was−3.0‰ (min,−9.9‰; max, 3.3‰), which represented a 6‰ to 9.6‰15N enrichment respect to other Mexican atmo-sphericTillandsiafrom less polluted habitats (δ15N =−9.0‰ to−12.6‰, Hietz and Wanek, 2003; Hietz et al., 1999). The lowest, probably “background” signature for T. recurvata, occurred at the rural SW corner of MV (δ15N≈−7.0‰). Since theδ15N of land plants range roughly from−7‰ to +9‰ (Kelly et al., 2005), thisTillandsiabelongs to the most discriminative plants against15N. This suggests that it could rely on biologically usable atmospheric compounds with low δ15N, such as gaseous NH3 and its derivative aerosol NH+4 (Krupa, 2003). Another contributing factor may be a symbiotic association with bacteria able to convert atmo-spheric14N2 into usable salts forT. recurvata. Puente and Bashan (1994) documented the occurrence of such bacte-ria in MexicanT. recurvata, but their function needs to be proven.
(a)
-99.5 -99.4 -99.3 -99.2 -99.1 -99
Latitude W
19.8 19.9 20 20.1 20.2 20.3 20.4 20.5
L
o
n
g
it
u
d
e
N
(b)
-99.5 -99.4 -99.3 -99.2 -99.1 -99
Latitude W
19.8 19.9 20 20.1 20.2 20.3 20.4 20.5
L
o
n
g
it
u
d
e
N
Fig. 3.Spatial distribution of the naturalT. recurvataδ13C(a)and δ15N(b)isotopic ratios (per mil, ‰) at Mezquital Valley.
and rural environs (higher values) negatively correlated with the NH+4:NO−3 ratio of the bulk N deposition. This implies that increasing the proportion of NO−3 and compounds with highδ15N, like N2O (+6.7 to +7.0‰, Brenninkmeijer et al., 2003), would shift positively this plant ratio. The same effect would result by lowering the proportion of NH+4 and other 15N-depleted compounds.
Although there may be a variety of N atmospheric com-pounds contributing to theT. recurvataδ15N spatial pattern, specifying which of them accounted for it was beyond the reach of this survey. It can be, however, hypothesized that the higher δ15N values near the agriculture areas may be related to the heavy use of untreated wastewater for irriga-tion. There are noδ15N data for this water, but it is reason-able to assume high positive values, as reported elsewhere for wastewater (δ15N = +10‰ to +22‰). Soils and plants ex-posed to such15N-enriched water tend to acquire highδ15N
0.1 1.0 10.0
-40 -30 -20 -10 0 10 20 30
Distance (km)
1
3
C
+
1
6
a
n
d
N
i:
V
SSW NNE
δ13C
Ni:V
δ
1
3C
+
1
6
a
n
d
N
i:
V
Fig. 4. Medianδ13C (triangles) and Ni:V ratios (squares) inT. re-curvataat sites along a transect oriented with the predominant wind direction at Mezquital Valley (arrow). The main petroleum com-bustion sources are located at km 0. Theδ13C values were added 16 to allow the logarithmic transformation of the y-axis. The fitting lines are two-period running means.
values (Cole et al., 2004; Wigand et al., 2007). This is most likely the case at MV, where agriculture soils have a net pos-itive N balance despite the substantial loss that may occur by volatilization from the open wastewater channels and dur-ing irrigation (Siebe, 1998). However, it can be hypothe-sized that gaseous and particulate emissions of compounds with high δ15N (e.g., N2O and NO−3, respectively) from those channels and soils are large enough to convert the nat-urally negativeδ15N ofT. recurvatainto positive values. Re-cent, spatially limited measurements (5 ha) on the emissions of N2O from local agriculture soils showed rates varying from 0.01–0.04 mg m−2h−1 before irrigation with wastew-ater to 3.4 mg m−2h−1after irrigation, which are similar to fluxes from artificially fertilized soils (Gonz´alez-M´endez, et al. 2008). Other regional activities, like burning agriculture debris, may also contribute with high15N emissions.
Theδ15N values at the core industrial area were similar to those at agriculture sites (0‰ to +3‰). This could be due both to in situ NOx emissions from fossil fuel combustion sources (signaled with C, E and R in Fig. 3b) and to down-wind transport of 15N-enriched compounds from the main agriculture areas located immediately to the north of the in-dustrial park.
3.4 Distribution of pollutants and identification of major emission sources
former elements are more likely to be emitted by widely dis-tributed sources; e.g., soil or crustal rocks, whereas the latter ones may derive from localized emission sources.
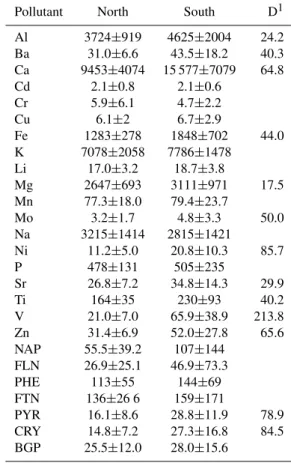
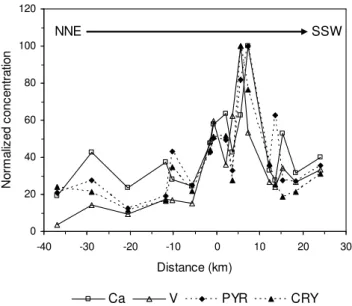
In looking for general spatial patterns at MV, the predomi-nantly agricultural north was compared to the industrial south using the median site concentrations and straight t-tests. Eleven elements (Al, Ba, Ca, Fe, Mg, Mo, Ni, Sr, Ti, V and Zn) plus CHR and PYR had 18 to 214% higher concentra-tions at the industrial area (p<0.05, Table 6). None was sig-nificantly more concentrated at the agricultural north. Such spatial difference is partially illustrated in Fig. 5. This figure plots the site normalized median concentration of Ca, CHR, PYR and V within a belt transect oriented along the pre-dominant wind direction (NNE to SSW), including the main types of particle emitters in the region. At the industrial area (≥0 km in Fig. 5), those pollutants had site concentrations up to 5.2 (Ca), 4.2 (CHR), 4.8 (PYR) and 29 (V) times higher than at the farthest north, rural location (Mixquiahuala), lo-cated 37 km from the industrial area (Fig. 5). At sites near or within the main north agriculture area (−2 to−30 km in Fig. 5), most elements and PAH had intermediate concentra-tions.
Figure 6 illustrates four selected distribution patterns of pollutants as mapped with the median site data. Vanadium had a well-defined concentration peak (>175 mg kg−1) lo-cated 3.7 km to the south of the petroleum refinery and the power plant (Fig. 6a). Its concentration dropped centrifu-gally from there, but at faster rate toward the north than to the south, indicating air transport in this latter direction. The V concentration increased again southward (ca., 12 km from the main peak) probably due to further fossil fuel emissions from cement industries, which are also heavy users of resid-ual petroleum and other materials (petcoke, natural gas, ve-hicle tires and a variety of residual materials).
Chromium had also a single concentration peak (>20 mg kg−1, Fig. 6b). In contrast with V, this was located at the north of the valley; i.e., upwind from the industrial park. At the rest of the sampling areas, the biomonitor accumulated rather similar Cr levels (≈5 mg kg−1). Two potential sources causing that Cr peak are nearby polluted agriculture soils and limestone dust from quarrying.
Calcium (Fig. 6c) had two high concentration spots, one at the SE (>36 000 mg kg−1) and another at the NE (>25 000 mg kg−1) of the study region, coinciding with two major limestone areas where mining for cement materials oc-curs. In general, this element was more concentrated in the biomonitor at the East half of MV were limestone rocks pre-dominate.
Figure 6d shows the distribution of total PAH. The high-est concentrations were recorded at the south of MV, mainly to the WSW of the core industrial area. The lowest lev-els occurred at rural NW sector, upwind respect to the ur-ban/industrial areas. The tree concentration peaks in Fig. 6d were determined by the most abundant MMW (FLT and
Table 6. Mean and standard deviation of elements (mg kg−1) and PAH (ng g−1) inT. recurvataat north and south Mezquital Valley.
Pollutant North South D1
Al 3724±919 4625±2004 24.2 Ba 31.0±6.6 43.5±18.2 40.3 Ca 9453±4074 15 577±7079 64.8 Cd 2.1±0.8 2.1±0.6
Cr 5.9±6.1 4.7±2.2 Cu 6.1±2 6.7±2.9
Fe 1283±278 1848±702 44.0 K 7078±2058 7786±1478
Li 17.0±3.2 18.7±3.8
Mg 2647±693 3111±971 17.5 Mn 77.3±18.0 79.4±23.7
Mo 3.2±1.7 4.8±3.3 50.0 Na 3215±1414 2815±1421
Ni 11.2±5.0 20.8±10.3 85.7 P 478±131 505±235
Sr 26.8±7.2 34.8±14.3 29.9 Ti 164±35 230±93 40.2 V 21.0±7.0 65.9±38.9 213.8 Zn 31.4±6.9 52.0±27.8 65.6 NAP 55.5±39.2 107±144
FLN 26.9±25.1 46.9±73.3 PHE 113±55 144±69 FTN 136±26 6 159±171
PYR 16.1±8.6 28.8±11.9 78.9 CRY 14.8±7.2 27.3±16.8 84.5 BGP 25.5±12.0 28.0±15.6
1D, significant South – North percent difference
(Student t,p<0.05).
PHE) and LMW (NAP) PAH, probably reflecting vehicular emissions from the closest urban settlements.
Prior to factor analysis, the element signal-to-noise ratio (SNR) and enrichment factors (EF) were considered as cri-teria for variable selection (see Sect. 2.3). The average SNR was 4.1 (min, 2.1, Cd; max, 7.3, Ca, Table 2), a good ratio in signal information for a biomonitoring survey. Compara-tively, Wolterbeek et al. (1996) reported average SNR values from 1.3 to 3.4 for lichens, mosses and tree bark biomonitors in Europe.
0 20 40 60 80 100 120
-40 -30 -20 -10 0 10 20 30
Distance (km)
N
o
rm
a
liz
e
d
c
o
n
c
e
n
tr
a
tio
n
Ca V PYR CRY
NNE SSW
Fig. 5. Normalized median site concentration of two metals and two PAH inT. recurvataalong a NNE-SSW transect at Mezquital Valley. The 100 value represents the maximum site concentra-tion: Ca, 32 600 mg kg−1; CRY, 82.1 ng g−1; PYR, 65.9 ng g−1; V, 197.2 mg kg−1. The border between the main agricultural and industrial areas is roughly located at km 0.
Cr, Mg, Mn, Sr and Ti, probably originated from crustal/soil sources. The natural emission of some elements can be en-hanced by activities like mining. This could be the case for Ca and Cr, whose highest site concentrations occurred near limestone mining areas.
Table 7 shows a factor analysis solution for the 50 MV sites×20 pollutants standardized data. Five factors (F1 to F5) or potential sources with eigenvalues>1.0 accounted for 74% of the data variance. Most of it (39.5%) was associ-ated to F1, which was loaded by Ti>Ba>Fe>Al>Sr>Cu (loadings>0.6), and to some extent by Ca (0.49). Such com-position indicates crustal sources, including both igneous rocks and limestone (Ca). According to the site scores from FA (not shown), this factor was geographically centered at the MV agriculture/industrial frontier, 1.5 km from the re-finery in NE direction, where the first four elements (Ti to Al) peaked in concentration. This suggests soil dust travel-ing N to S from the agriculture areas as the element vehi-cle. Since most F1 elements are considerably more concen-trated in the local igneous rocks than in limestone (igneous to limestone concentration ratios: Al, 106:1; Ba, 48:1; Cu, 3:1; Fe, 1201:1; Ti 340:1, with data by Lozano and Bernal, 2005; Surendra, 2001), this factor appears more related to soil sources composed predominantly by igneous parental material.
Factor 2 (11.3% of variance) was loaded (>0.60) by Mn>Mg>Zn, and slightly by Cu (0.44). Interestingly, Na had a negative loading (−0.71) on this factor. This reflected
Table 7.Factor analysis of pollutants inT. recurvata(n=50).
F1 F2 F3 F4 F5
Ti 0.89 0.07 0.25 0.16 0.17 Ba 0.87 0.26 0.14 −0.07 0.17 Fe 0.86 0.08 0.32 0.14 0.19 Al 0.78 −0.30 0.30 0.08 0.22 Sr 0.72 0.26 0.25 −0.15 0.21 Cu 0.61 0.44 0.09 0.27 0.05 Mn 0.25 0.70 −0.14 0.18 −0.18 Mg 0.35 0.68 0.13 0.24 0.21 Zn 0.24 0.66 0.57 0.08 0.19 Na 0.22 −0.71 −0.08 0.37 0.06 PYR 0.17 0.05 0.81 0.12 0.03 V 0.33 0.19 0.79 −0.06 0.29 CRY 0.23 0.24 0.78 0.05 0.34 Ni 0.12 −0.28 0.73 −0.04 −0.26 Ca 0.49 0.04 0.62 0.05 0.33 BgP −0.20 0.13 0.14 0.72 −0.15 K 0.31 −0.02 −0.02 0.71 0.04 δ15N 0.26 −0.19 −0.05 −0.2 0.69
P 0.42 0.27 0.17 0.08 0.67
δ13C −0.08 −0.01 −0.19 −0.01 −0.73
% variance 39.5 11.3 9.8 8.1 5.2
a major spatial contrast between Na, with higher concentra-tions (4000 to 5000 mg kg−1) within or near agriculture areas (Fig. 8); whereas the other elements were more concentrated at the farther rural areas to the south (Mn>100 mg kg−1) and SE of MV (Mg>4000 mg kg−1). Although Zn had high lev-els at some industrial sites (>60 mg kg−1), it kept similar concentrations at the SE rural area, resembling the Mg pat-tern. This factor may be also related to soil sources, but dis-tinguishing saline agriculture soils at the MV lowlands (Na) from natural soils (Mg, Mn and Zn). Sodium is the main cation in irrigation wastewater at MV (Cervantes-Medel and Armienta, 2004; Jimenez and Ch´avez, 2004), which is at-tributed transport by wastewater from the saline areas near Mexico City (Siebe, 1998). However, potential inputs from other sources for the elements loading on this factor cannot be excluded. For instance, industrial particulate matter trav-eling N to S (Cu and Zn) and gasoline vehicle emissions (Mn) from a major line source located at the S limit of MV, the Mexico City-Quer´etaro highway.
(a)
-99.5 -99.4 -99.3 -99.2 -99.1 -99
Latitude W
19.8 19.9 20 20.1 20.2 20.3 20.4 20.5
L
o
n
g
it
u
d
e
N
(b)
-99.5 -99.4 -99.3 -99.2 -99.1 -99
Latitude W
19.8 19.9 20 20.1 20.2 20.3 20.4 20.5
L
o
n
g
it
u
d
e
N
(c)
-99.5 -99.4 -99.3 -99.2 -99.1 -99
Latitude W 19.8
19.9 20 20.1 20.2 20.3 20.4 20.5
L
o
n
g
it
u
d
e
N
(d)
-99.5 -99.4 -99.3 -99.2 -99.1 -99
Latitude W
19.8 19.9 20 20.1 20.2 20.3 20.4 20.5
L
o
n
g
it
u
d
e
N
Fig. 6.Spatial distribution of V(a), Cr(b), Ca(c)and total PAH(d)inT. recurvataat Mezquital Valley. Units: mg kg−1.
0.001 0.01 0.1 1 10 100
0.1 1 10 100
Igneous rocks EF
L
im
e
s
to
n
e
(
E
F
)
Ni K
Zn V
Cu P
Na Fe
Ti
Ba Cr
Mg Mn
Ca Sr
Fig. 7. Mean element enrichment factors in T. recurvata at Mezquital Valley.
-99.5 -99.4 -99.3 -99.2 -99.1 -99
Latitude W
19.8 19.9 20 20.1 20.2 20.3 20.4 20.5
L
o
n
g
it
u
d
e
N
Al
Ba Ca
Cu
Fe
K Mg
Mn Na Ni
P
Sr Ti
V
Zn PYR
CRY
BGHIP
C13
N15
-0.4 -0.2 0.0 0.2 0.4 0.6 0.8 1.0
Factor 1 -0.4
-0.2 0.0 0.2 0.4 0.6 0.8 1.0
F
a
c
to
r
3
F1 F3
Fig. 9.Factor 3 vs. factor 1 plot. F1 includes elements from mainly crustal origin; F3, elements and PAH from petroleum fuel combus-tion and cement produccombus-tion (Ca). The third circle includes elements related to agriculture soil sources (F2, F4 and F5, not shown).
further evidence to associate it with petroleum combustion. Figure 9 illustrates how these pollutants separate in the factor space from the predominantly crustal/soil elements (Al, Ba, Cu, Fe, Sr and Ti).
Factor 4 (F4) had 8.1% of the variance associated with it. It was loaded by K and benzo(g, h, i)perylene, deriving tentatively from biomass burning, which may include agri-culture debris in the flatlands and forest fires in the highlands at the W side of MV.
Factor 5 (F5) accounted only by 5.2% of the variance. It was loaded by theδ15N isotope ratio and P. This factor may reflect agriculture activities with wastewater, characterized by large emissions of N compounds, mainly NH3, NH+4 and NO−3 (Cervantes-Medel and Armienta, 2004; Jimenez and Ch´avez, 2004) and P (Ortega-Larrocea et al., 2001). Phos-phorus may also derive from pesticides used in agriculture, which often contain this element. The negative loading of δ13C on this factor added evidence on the regional difference between agriculture and industrial (fossil fuel combustion) land uses.
Although FA did not extracted pure factors/sources, it acceptably distinguished contributions from the most rele-vant sources of particulate matter into the MV air. Most element variability in the biomonitor, 64% out of 74% to-tal explained variance, appeared associated with crusto-tal/soil sources and agriculture activities (F1+F2+F4+F5), and only 10% (F3) was attributable to emissions from industrial fos-sil fuel combustion, including power generation, petroleum refining and cement production. Increasing the number of sampling sites, especially around some major fixed sources, such as the power plant and cement factories, may allows us to differentiate their particular contributions to the load of bioaccumulative atmospheric pollutants in the study region.
4 Conclusions
This survey produced previously unknown information on the regional levels, sources and dispersion of airborne metals and PAH for Mezquital Valley, Mexico.Tillandsia recurvata was confirmed as a good natural receptor for those pollutants. The site to site concentration variability, as indicated by high signal-to-noise ratios for most metals (>3.0), reflected the differential long-term exposition to most measured pollu-tants, especially to the anthropogenic ones. Some anthro-pogenic metals (e.g., Ni, Pb and V) had particularly high con-centrations respect to values for similar biomonitors in other countries, indicating that atmospheric deposition should be several times higher at this Mexican region. The levels of PAH were more similar to values forTillandsiabiomonitors, with a few exceptions (e.g., ACY and IcdP). The southern industrial portion of MV was more polluted than the agri-cultural north, as implied by the higher concentrations of 11 elements and two PAH. From the chemical correlation be-tween the biomonitor and the regional rocks, results from factor analysis and the geographic patterns of pollutants, it is concluded that crustal/soil sources had a higher relative im-pact than agriculture and industry on the spatial variability of pollutants. The high “background” δ13C and lowδ15N ofT. recurvatamake this epiphyte a sensitive biomonitor for 13C-depleted and15N-enriched sources. It may be thus rec-ommendable to use it as a common natural receptor for com-parative studies within and among Latin American countries and the southern US states, where it is naturally distributed. This would minimize potential variability from using differ-ent species.
Acknowledgements. This study was funded by the Mexican Oil
Company (PEMEX, project F.21393) and the Mexican Petroleum Institute (D.00391), and conducted under the MILAGRO 2006 Mexico field campaign. We thank Marina Mor´an Pineda, executive of the IMP Gas Spectroscopy and Environmental Studies Labora-tory, for logistical support; Ingrid Garc´ıa Torres and Jos´e Rojas for assistance in the sample preparation process; Adolfo Espejo Serna and Ana Rosa L´opez Ferrari, with the Metropolitan University Herbarium at Mexico City, for taxonomical identification of our samples. We also express our gratitude to three anonymous reviewers, who greatly helped us to improve this work.
Edited by: L. Molina
References
Aboal, J. R., Real, C., Fern´andez, J. A., and Carballeira, A.: Map-ping the results of extensive surveys: the case of atmospheric biomonitoring and terrestrial mosses, Sci. Total Environ., 356, 256–274, 2006.
Benzig, D. H., Arditti, J., Nyman, L. P., Temple, P. J., and Adams, J. P.: Effects of ozone and sulfur dioxide on four bromeliads, Environ. Exp. Bot., 32(1), 25–29, 1992.
Boutton, T. W.: Stable carbon isotope ratios of natural materials: II, Atmospheric, terrestrial, marine and freshwater environments, in: Carbon Isotope Techniques, edited by: Coleman, D. C. and Fry, B., 173–185, 1991.
Branquinho, C., Gaio-Oliveira, G., Augusto, S., Pinho, P., M´aguas, C., and Correia, O.: Biomonitoring spatial and temporal impact of atmospheric dust from a cement industry, Environ. Pollut., 151(2), 292–299, 2008.
Brenninkmeijer, C. A. M., Janssen, C., Kaiser, J., R¨ockmann, T., Rhee, T. S., and Assonov, S. S.: Isotope effects in the chemistry of atmospheric trace compounds, Chem. Rev., 103, 5125–5161, 2003.
Brighina, L., Papini, A., Mosti, S., Cornia, A., Bocchini, P., and Galleti, G.: The use of tropical bromeliads (Tillandsiaspp.) for monitoring atmospheric pollution in the town of Florence, Italy, Rev. Biol. Trop., 50(2), 577–584, 2002.
Bukata, A. R. and Kyser, T. K.: Carbon and nitrogen isotope vari-ations in tree-rings as records of perturbvari-ations in regional car-bon and nitrogen cycles, Environ. Sci. Technol., 41, 1331–1338, 2007.
Cabrera Ru´ız, R. B. E., Gordillo Mart´ınez, A. J., and Cer´on Beltr´an, A.: Inventario de contaminaci´on emitida a suelo, agua y aire en 14 municipios del Estado de Hidalgo, M´exico, Rev. Int. Contam. Ambie., 19(4), 171–171, 2003.
Castro, L. V. and Vazquez, F.: Fractionation and characterization of Mexican crude oils, Energ. Fuel., 23(3), 1603–1609, 2009. CEPAL-SEMARNAT: Evaluaci´on de las externalidades
ambien-tales de la generaci´on termoel´ectrica en M´exico, http://www. semarnat.gob.mx/informacionambiental/Publicacion/ext.pdf, 2004.
Cervantes-Medel, A. and Armienta, M. A.: Influence of faulting on groundwater quality in Valle del Mezquital, Mexico, Geof´ısica Internacional, 43(3), 477–493, 2004.
Cifuentes, E., Blumenthal, U., Ru´ız Palacios, G., Bennett, S., and Peasey, A.: Epidemiological panorama for the agricultural use of wastewater: The Mezquital Valley, Mexico, Salud P´ublica M´exico, 36, 3–9, 1994.
Cole, M. L., Valiela, I., Kroeger, K. D., Tomansky, G. L., Cebrian, J., Wigand, C., McKinney, R. A., Grady, S. P., and Carvalho da Silva, M. H.: Assessment of aδ15N isotopic method to indicate anthropogenic eutrophication in aquatic ecosystems, J. Environ. Qual., 33, 124–132, 2004.
Conti, M. E. and Cecchetti, G.: Biological monitoring: lichens as bioindicators of air pollution assessment – a review, Environ. Pollut., 114, 471–492, 2001.
Coplen, T. B.: Discontinuance of SMOW and PDB, Nature, 375, 285 pp., 1995.
Crayn, D. M., Winter, K., and Smith, J. A. C.: Multiple origins of crassulacean acid metabolism and the epiphytic habit in the Neotropical family Bromeliacea, PNAS, 101(10), 3703–3708, 2004.
De Sousa Pereira, M., Heitmann, D., Reifenh¨auser, W., Ornellas Meire, R., Silva Santos, L., Torres, J. P. M., Malm, O., and K¨orner, W.: Persistent organic pollutants in atmospheric depo-sition and biomonitoring withTillandsia usneoides(L.) in an in-dustrialized area in Rio de Janeiro state, southeast Brazil – Part
II: PCB and PAH, Chemosphere, 67, 1736–1745, 2007. Downs, T. J., Cifuentes-Garc´ıa, E., and Buffet, I. M.: Risk
screen-ing for exposure to groundwater pollution in a wastewater irriga-tion district of the Mexico City region, Environ. Health Persp., 107(7), 553–561, 1999.
EPA: Method 6010C. Inductively Coupled Plasma-Atomic Emis-sion Spectrometry, ReviEmis-sion 3, 30 pp., 2000.
Espinosa Pena, M., Manjarrez, A., and Campero, A.: Distribution of vanadyl porphyrins in a Mexican offshore heavy crude oil, Fuel Process. Technol., 46, 171–182, 1996.
Figuereido, A. M., Nogueira, C. A., Saiki, M., Milian, F. M., and Domingos, N.: Assessment of atmospheric metallic pollution in the metropolitan region of S˜ao Paulo, Brazil, employing Tilland-sia usneoidesL. as biomonitor, Environ. Pollut., 145(1), 279– 292, 2007.
Friedel, J. K., Langer, T., Siebe, C, and Stahr, K.: Effects of long-term waste water irrigation on soil organic matter, soil microbial biomass and its activities in central Mexico, Biol. Fert. Soils, 31(5), 441–421, 2000.
Flores-Delgadillo, L., Hern´andez-Silva, G., Alcal´a-Mart´ınez, R., and Maples-Vermeersch, M.: Total contents of cadmium, copper, manganese and zinc in agricultural soils irrigated with wastewa-ter from Hidalgo, Mexico, Rev. Int. Contam. Ambie., 8(1), 37– 46, 1992.
Ganor, E., Altshuller, S., Foner, H. A., Brenner, S., and Gabay, J.: Vanadium and nickel in dustfall as indicators of power plant pol-lution, Water Air Soil Pollut., 42, 241–252, 1988.
Gerdol, R., Bragazza, L., Marchesini, R., Medici, A., Pedrini, P., Benedetti, S., Bovolenta, A., and Coppi, S.: Use of moss (Tortula muralisHedw.) for monitoring organic and inorganic air pollu-tion in urban and rural sites in Northern Italy, Atmos. Environ., 36, 4069–4075, 2002.
Gonz´alez-M´endez, B., Siebe, C., Fiedel, S., Hern´andez, J. M., and Ru´ız-Su´arez, L. G.: N2O emissions from soil irrigated with un-treated wastewater in central Mexico, J. Soil Sci. Plant Nutr., 8(3), 185, 2008.
Hern´andez-Silva, G., Flores-Delgadillo, L., Maples-Vermeersch, M., Solorio-Mungu´ıa, J. G., and Alcal´a-Mart´ınez, J. R.: Riesgo de acumulaci´on de Cd, Pb, Cr y Co en tres series de suelos del DR03, Estado de Hidalgo, M´exico, Revista Mexicana de Cien-cias Geol´ogicas, II(1), 53–61, 1994.
Hietz, P. and Wanek, W.: Size-dependent variation of carbon and nitrogen isotope abundances in epiphytic bromeliads, Plant Biol., 5, 137–142, 2003.
Hietz, P., Wanek, W., and Popp, M.: Stable isotopic composition of carbon and nitrogen and nitrogen content in vascular epiphytes along an altitudinal transect, Plant Cell Environ., 22, 1435–1443, 1999.
Huerta, L., Contreras-Valadez, R., Palacios-Mayorga, S., Miranda, J., and Calva-Vasquez, G.: Total element composition of soils contaminated with wastewater irrigation by combining IBA tech-niques, Nucl. Instrum. Meth. B, 189, 158–162, 2002.
Husk, G. J., Weishampel, J. F., and Schlesinger.: Mineral dynamics in Spanish moss,Tillandsia usneoidesL. (Bromeliacea), from Central Florida, USA, Sci. Total Environ., 321, 165–172, 2004. Hwang, H. M., Wade, T. L., and Sericano, J. L.: Concentrations
Jimenez, B. and Ch´avez, A.: Quality assessment of an aquifer recharged with wastewater for its potential use as drinking source: “El Mezquital Valley” case, Water Sci. Technol., 50(2), 269–276, 2004.
Jung, K., Gebauer, G., Gehre, M., Hoffmann, D., Weißflog, L., and Sch¨u¨urmann, G.: Anthropogenic impacts on natural nitrogen iso-tope variations inPinus sylvestrisstands in an industrially pol-luted area, Environ. Pollut., 97(1-2), 175-181, 1997.
Kelly, S. D., Stein, C., and Jickells, T. D.: Carbon and nitrogen iso-topic analysis of atmospheric organic matter, Atmos. Environ., 39, 6007–6011, 2005.
Krupa, S.: Effects of atmospheric ammonia (NH3) on terrestrial vegetation: a review, Environ. Pollut., 124, 179–221, 2003. Liu, X. Y., Xiao, H. Y., Liu, C. Q., Li, Y. Y., and Xiao, H. W.:
Stable carbon and nitrogen isotopes of the mossHaplocladium microphyllumin an urban and a background area (SW China): the role of environmental conditions and atmospheric nitrogen deposition, Atmos. Environ., 42, 5413-5423, 2008.
Lozano, R. and Bernal, J. P.: Characterization of a new set of eight geochemical reference materials for XRF major and trace ele-ment analysis, Revista Mexicana de Ciencias Geol´ogicas, 22(3), 329–344, 2005.
Lucho-Constantino, C. A., ´Alvarez-Su´arez, M., Beltr´an-Hern´andez, R. I., Prieto-Garc´ıa, F., and Poggi-Varaldo, H. M.: A multivariate analysis of the accumulation and fractionation of major and trace elements in agricultural soils in Hidalgo State, Mexico irrigated with raw wastewater, Environ. Int., 31(3), 313–323, 2005. Macko, S. A. and Parker, P. L.: Stable nitrogen and carbon isotope
ratios of beach tars on South Texas Barrier Islands, Mar. Envi-ronm. Res., 10, 93–103, 1983.
Malm, O., de Freitas Fonseca, M., Hissnauer Miguel, P., Rodr´ıguez Bastos, W., and Neves Pinto, F.: Use of epiphyte plants as biomonitors to map atmospheric mercury in a gold trade cen-ter city. Amazon, Brazil, Sci. Total Environ., 213(1–3), 57–64, 1998.
Mariotti, A.: Natural N-15 abundance measurements and atmo-spheric nitrogen Standard calibration, Nature, 311, 685–687, 1974.
Martin, C. E.: Physiological ecology of the Bromeliaceae, Bot. Rev., 60(1), 1–82, 1994.
Norra, S., Handley, L. L., Berner, Z., and St¨uben, D.:13C and15N natural abundances of urban soils and herbaceous vegetation in Karlsruhe, Germany, Eur. J. Soil Sci., 56(5), 607–620, 2005. Ortega-Larrocea, M. P., Siebe, C., B´ecard, G., M´endez, I., and
Web-ster, R.: Impact of a century of wastewater irrigation on the abundance of arbuscular mycorrhizal spores in the soil of the Mezquital Valley of Mexico, Appl. Soil Ecol., 16(2), 149–157, 2001.
Pardo, L. H., McNulty, S. G., Bogs, J. L., and Duke, S.: Regional patterns in foliar15N across a gradient of nitrogen deposition in the northeastern US, Environ. Pollut., 149, 293–302, 2007. Pearson, J., Wells, D. M., Seller, K. J., Bennett, A., Soares, A.,
Woodall, J., and Ingrouille, M. J.: Traffic exposure increases nat-ural15N and heavy metal concentrations in mosses, New Phytol., 147(2), 317–326, 2002.
Pichlmayer, F., Sch¨oner, W., Seibert, P., Stichler, W., and Wagen-bach, D.: Stable isotope analysis for characterization of pol-lutants at high elevation alpine sites, Atmos. Environ., 32(23), 4075–4085, 1998.
Pierce, S., Winter, K., and Griffiths, H.: Carbon isotope ratio and the extent of daily CAM use by Bromeliaceae, New Phytol., 156, 75-83, 2002.
Pignata, M. L., Gudi˜no, G. L., Wannaz, E. D., Pl´a, R. R., Gonz´alez, C. M., Carreras, H. A., and Orellana, L.: Atmospheric quality and distribution of heavy metals in Argentina employing Tilland-sia capillaris as a biomonitor, Environ. Pollut., 129, 59–68, 2002.
Pirintsos, S. A. and Loppi, S.: Biomonitoring atmospheric pollu-tion: the challenge of times in environmental policy on air qual-ity, Environ. Pollut. 151(2), 269–271, 2008.
Prinzhofer, A., Vega, M. A. G., Battani, A., and Escudero, M.: Gas geochemistry of the Macuspana Basin (Mexico): thermogenic accumulations in sediments impregnated by bacterial gas, Mar. Petrol. Geol., 17, 1029–1040, 2000.
Puente, M. E. and Bashan, Y.: The desert epiphyte Tillandsia recurvataharbours the nitrogen-fixing bacteriumPseudomonas stutzeri, Can. J. Bot., 72, 406–408, 1994.
Pyatt, F. B., Grattan, J. P., Lacy, D., Pyatt, A. J., and Seward, M. R. D.: Comparative effectiveness ofTillandsia usneoidesL. and
Parmotrema praesorediosum(Nyl.) Hale as bio-indicators of at-mospheric pollution in Louisiana (U.S.A.), Wate Air Soil Poll., 111, 317–326, 1999.
Rossini Oliva, S. and Raitio, H.: Review of cleaning techniques and their effects on the chemical composition of foliar samples, Boreal Environ. Res., 8, 263–272, 2003.
Schmitt, A. K., Martin, C. E., and L¨uttge, U. E.: Gas exchange and water vapor uptake in the atmospheric bromeliadTillandsia recurvataL, Bot. Acta, 102, 80–84, 1989.
Schrimpff, E.: Air pollution patters in two cities of Colombia ac-cording to trace substances contents of an epiphyte Tillandsia recurvata, Water Air Soil Poll., 21(1–4), 279–316, 1984. Segala, E. A., Baˆesso, B. M., and Domingos, M.: Structural analysis
ofTillandsia usneoidesL. exposed to air pollutants in S˜ao Paulo city-Brazil, Water Air Soil Poll., 189, 61–68, 2008.
SEMARNAT-INE.: Inventario Nacional de Emisiones de M´exico, 1999, Secretar´ıa del Medio Ambiente y Recursos Natu-rales/Instituto Nacional de Ecolog´ıa, M´exico, D. F., 409 pp., 2006.
Siebe, C.: Acumulaci´on y disponibilidad de metales pesados en sue-los regados con aguas residuales en el distrito de riego 03, Tula, Hidalgo, M´exico, Revista Internacional de Contaminaci´on Am-biental, 10(1), 15–21, 1994.
Siebe, C.: Nutrient inputs to soils and their uptake by alfalfa through long-term irrigation with untreated sewage effluent in Mexico, Soil Use Manage., 14, 119–122, 1998.
Siebe, C., and Cifuentes, E.: Environmental impact of wastewater irrigation in central Mexico: an overview, Int. J. Environ. Heal. R., 5, 161–173, 1995.
Silva-Mora, L.: Geolog´ıa volc´anica y car´acter qu´ımico preliminar de las rocas de la reg´on Tula-Polotitl´an, Estados de Hidalgo, M´exico y Quer´etaro, M´exico, Revista Mexicana de Ciencias Geol´ogicas, 14(1), 50–77, 1997.
Skinner, R. A., Ineson, P., Jones, H., Sleep, D., Leith, I. D., and Sheppard, L. J.: Heathland vegetation as a bio-monitor for nitro-gen deposition and source attribution usingδ15N values, Atmos. Environ., 40, 498–507, 2006.
29(1), 11–20, 1995.
SMA.: Gesti´on Ambiental del Aire en el Distrito Federal: Avances y Propuestas, 2000–2006, Secretar´ıa del Medio Ambiente, Gob-ierno del Distrito Federal, M´exico, 2006.
Smodiˇs, B., Pignata, M. L., Saiki, M., Cort´es, E., Bangfa, N., Mark-ert, B., Nyarko, B., Arunachalam, J., Garty, J., Vutchkov, N., Wolterbeek, H. Th., Steinnes, E., Freitas, M. C., Lucaciu, A., and Frontasyeva, M.: Validation and application of plants as biomonitors of trace atmospheric pollution- a co-ordinated effort in 14 countries, J. Atmos. Chem., 49, 3–13, 2004.
Solga, A., Burkhardt, J., Zechmeister, H. G., and Frahm, J. P.: Ni-trogen content, 15N abundance and biomass of the two pleu-rocarpous mossesPleurozium schreberi (Brid.) Mitt. and Scle-ropodium purum(Hedw.) Limpr. in relation to atmospheric ni-trogen deposition, Environ. Pollut., 134, 465–473, 2005. Solga, A., Eichert, T., and Frahm, J. P.: Historical alteration in
the nitrogen concentration and15N natural abundance of mosses in Germany: indication for regionally varying changes in atmo-spheric nitrogen deposition within the last 140 years, Atmos. En-viron., 40, 8044–8055, 2006.
St. Clair, S. B., St. Clair, L. L., Mangelson, N. F., and Weber, D. J.: Influence of growth form on the accumulation of airborne copper by lichens, Atmos. Environ., 36, 5637–5644, 2002.
Surendra, P. V.: Geochemical and Sr-Nd-Pb isotopic evidence for a combined assimilation and fraccional crystallisation process for volcanic rocks from the Huichapan caldera, Hidalgo, Mexico, Lithos, 56(2–3), 141–164, 2001.
V´azquez-Alarc´on, A., Justin-Cajuste, L., Siebe-Grabach, C., Alc´antar-Gonz´alez, G., and de la Isla de Bauer, M. L.: Cadmio, niquel y plomo en agua residual, suelo y cultivos en el Valle del Mezquital, Hidalgo, M´exico, Agrociencia, 35, 267–274, 2001. Wannaz, E. D. and Pignata, M. L.: Calibration of four species of
Tillandsia as biomonitors, J. Atmos. Chem., 53(3), 185–209, 2006a.
Wannaz, D. E., Carreras, H. A., P´erez, C. A., and Pignata, M. L.: Assessment of metal accumulation in two species ofTillandsiain relation to atmospheric sources in Argentina, Sci. Total Environ., 361, 267–278, 2006b.
Wigand, C., McKinney, R. A., Cole, M. L., Thursby, G. B., and Cummings, J.: Varying stable nitrogen isotope ratios of differ-ent coastal marsh plants and their relationships with wastewater nitrogen and land use in New England, USA, Environ. Monit. Assess., 131, 71–81, 2007.
Wolterbeek, H. Th.: Biomonitoring of trace element air pollution: principles, possibilities and perspectives, Environ. Pollut., 120, 11–21, 2002.