ACPD
9, 5809–5852, 2009Distribution and sources of bioaccumulative air
pollutants
A. Zambrano Garc´ıa et al.
Title Page
Abstract Introduction
Conclusions References
Tables Figures
◭ ◮
◭ ◮
Back Close
Full Screen / Esc
Printer-friendly Version
Interactive Discussion Atmos. Chem. Phys. Discuss., 9, 5809–5852, 2009
www.atmos-chem-phys-discuss.net/9/5809/2009/ © Author(s) 2009. This work is distributed under the Creative Commons Attribution 3.0 License.
Atmospheric Chemistry and Physics Discussions
This discussion paper is/has been under review for the journalAtmospheric Chemistry and Physics (ACP). Please refer to the corresponding final paper inACPif available.
Distribution and sources of
bioaccumulative air pollutants at
Mezquital Valley, Mexico, as reflected by
the atmospheric plant
Tillandsia
recurvata
L.
A. Zambrano Garc´ıa1, C. Medina Coyotzin1, A. Rojas Amaro1,
D. L ´opez Veneroni1, L. Chang Mart´ınez2, and G. Sosa Iglesias1
1
Direcci ´on Ejecutiva de Investigaci ´on y Posgrado, Instituto Mexicano del Petr ´oleo, M ´exico D.F., Mexico
2
Universidad Michoacana de San Nicol ´as de los Hidalgo, Morelia, Mexico
Received: 21 January 2009 – Accepted: 28 January 2009 – Published: 4 March 2009
Correspondence to: A. Zambrano Garc´ıa (azambran@imp.mx)
ACPD
9, 5809–5852, 2009Distribution and sources of bioaccumulative air
pollutants
A. Zambrano Garc´ıa et al.
Title Page
Abstract Introduction
Conclusions References
Tables Figures
◭ ◮
◭ ◮
Back Close
Full Screen / Esc
Printer-friendly Version
Interactive Discussion
Abstract
Mezquital Valley (MV), a Mexican wastewater-based agricultural and industrial region, is a “hot spot” of regulated air pollutants emissions, but the concurrent unregulated ones, like hazardous metals and polycyclic aromatic hydrocarbons (PAH), remain un-documented. A biomonitoring survey with the epiphyticTillandsia recurvatawas
con-5
ducted there to detect spatial patterns and potential sources of 20 airborne elements and 15 PAH. The natural δ13C and δ15N ratios of this plant helped in source iden-tification. The regional mean concentrations of most elements was two (Cr) to over 40 times (Ni, Pb, V) higher than reported for Tillandsia in other countries. Eleven elements, pyrene and chrysene had 18–214% higher mean concentration at the
in-10
dustrial south than at the agricultural north of MV. The total quantified PAH (mean, 572 ng g−1; range, 142.6–2568) were composed by medium (65%, phenanthrene to chrysene), low (28%, naphthalene to fluorene) and high molecular weight compounds (7%, Benzo(b)fluoranthene to indeno(1,2,3-cd)pyrene). The δ13C (mean, −14.6‰;
range, −15.7 to −13.7‰) was lower (<−15‰) near the major petroleum combustion
15
sources. Theδ15N (mean,−3.0‰; range,−9.9 to 3.3‰) varied from positive at
agricul-ture/industrial areas to negative at rural sites. Factor analysis provided a five-factor so-lution for 74% of the data variance: (1) crustal rocks, 39.5% (Al, Ba, Cu, Fe, Sr, Ti); (2) soils, 11.3%, contrasting contributions from natural (Mg, Mn, Zn) and saline agriculture soils (Na); (3) cement production and fossil fuel combustion, 9.8% (Ca, Ni, V, chrysene,
20
pyrene); (4) probable agricultural biomass burning, 8.1% (K and benzo(g,h,i)perylene), and (5) agriculture with wastewater, 5.2% (δ15N and P). These results indicated high deposition of bioaccumulative air pollutants at MV, especially at the industrial area. SinceT. recurvata reflected the regional differences in exposition, it is recommended as a biomonitor for comparisons within and among countries where it is distributed:
25
ACPD
9, 5809–5852, 2009Distribution and sources of bioaccumulative air
pollutants
A. Zambrano Garc´ıa et al.
Title Page
Abstract Introduction
Conclusions References
Tables Figures
◭ ◮
◭ ◮
Back Close
Full Screen / Esc
Printer-friendly Version
Interactive Discussion
1 Introduction
Monitoring airborne metals, polycyclic aromatic hydrocarbons (PAH) and other bioac-cumulative compounds with living organisms (biomonitoring) is a technique in use and refinement since at least the 1960’s. It is a multipurpose environmental tool for exploring pollutant occurrence and dispersion trends at different geographical/time
5
scales, to identify emission sources, estimate atmospheric deposition and relate bi-ological/ecological changes to air pollution (Aboal et al., 2006; Conti and Cecchetti, 2001; Pirintsos and Lopi, 2008; Segala et al., 2008; Wolterbeek, 2002). Since bioac-cumulative air pollutants usually travel in particles, biomonitoring is done preferentially with organisms that rely on the atmosphere as primary source of moisture and
nutri-10
ents, such as lichens, mosses and some vascular plants. This dependence is indicated by positive correlations between the concentration of pollutants in the biomonitor tis-sues and the amount of atmospheric deposition (Sloff, 1995; St. Clair et al., 2002; Wolterbeek, 2002).
We report results from a biomonitoring survey of airborne metals and PAH at
15
Mezquital Valley (MV) conducted in the context of the MILAGRO 2006 field campaign in Mexico. This region is environmentally better known by severe soil and water pollu-tion problems caused by over 100 years of agricultural irrigapollu-tion with untreated sewage water from Mexico City (Cifuentes et al., 1994; Down et al., 1999; Friedel et al., 2000; Siebe, 1994; V ´azquez-Alarc ´on et al., 2001). Mezquital Valley is also a major Mexican
20
“hot spot” in emissions of SO2, particulate matter and other regulated pollutants by the Tula-Tepeji-Vito industrial corridor located there (SEMARNAT-INE, 2006). Never-theless, there is very little information on the expected concurrence of unregulated air toxics at MV, such as hazardous metals, PAH and other persistent organic pollutants.
This survey explored MV for spatial deposition trends and potential sources of 20
25
ACPD
9, 5809–5852, 2009Distribution and sources of bioaccumulative air
pollutants
A. Zambrano Garc´ıa et al.
Title Page
Abstract Introduction
Conclusions References
Tables Figures
◭ ◮
◭ ◮
Back Close
Full Screen / Esc
Printer-friendly Version
Interactive Discussion Johnst.). Adult individuals are spherical, ca. 10–12 cm in diameter, easy to recognize
in the field and collect by hand. They have a reduced stem and non-functional roots. Most of their biomass is formed by linear leaves profusely covered with absorptive trichomes. This latter morphological feature increases the ability of this plant to capture moisture and particles directly from the surrounding air, which justifies naming it as
5
an “air” or “atmospheric” plant (Schmitt et al. 1989). Tillandsia recurvata has some physiological resistance to high levels of O3and SO2(Benzig et al., 1992), which may partially explain why is it so abundant at the polluted MV. This and other atmospheric Tillandsiaspecies have been used as in situ air pollution biomonitors in some southern US States and Latin-American countries, where this genus is exclusively distributed
10
(e.g., De Sousa et al., 2007; Husk et al., 2004; Pignata et al., 2002; Pyatt et al., 1999; Schrimpff, 1984; Smodiˇs et al., 2004; Wannaz et al., 2006a,b). Successful transplanting ofTillandsiafrom rural into urban areas for the same purpose has been reported by Brighina et al. (2002); Figuereido et al. (2007) and Malm et al. (1998).
In addition to metals and PAH, the naturalδ13C andδ15N stable isotope ratios were
15
determined in the T. recurvata samples as further information to identify air pollution sources. The use of these plant ratios for such purpose is based upon their depen-dence on the isotopic composition of the C and N sources used by plants (e.g., Bukata and Kyser, 2007; Liu et al., 2008; Skinner et al., 2006; Solga et al., 2006). Theδ13C is useful in detecting fossil fuel emission sources because of the sharp difference
be-20
tween the C isotopic signature of petroleum and other fuels (δ13C=−20 to −35‰, Goldstein and Shaw, 2003) and that of natural unpolluted air (δ13C=−8‰). The 13 C-depleted gaseous and particulate emissions from petroleum combustion dilute this iso-tope in the air, causing a negative shift of theδ13C. Plants exposed to such polluted air incorporate C compounds impoverished in13C, like CO2 for photosynthesis, and
25
ACPD
9, 5809–5852, 2009Distribution and sources of bioaccumulative air
pollutants
A. Zambrano Garc´ıa et al.
Title Page
Abstract Introduction
Conclusions References
Tables Figures
◭ ◮
◭ ◮
Back Close
Full Screen / Esc
Printer-friendly Version
Interactive Discussion from −7 to +9‰ (Kelly et al., 2005), but a plant δ15N can be changed by the
iso-topic composition of its N sources and the ability of each plant species to discriminate against15N. In general, for plants obtaining this nutrient from atmospheric sources, if the emissions into the air are dominated by N compounds with more negative or less positiveδ15N than theirs, this ratio decreases. Such N compounds are usually reduced
5
species (NHy) abundant at, but not exclusive to, agriculture/farming areas. Contrarily, this ratio increases in plants predominantly exposed to N species with more positive or less negativeδ15N than theirs, mainly oxidized N species (NOx) more common to urban/industrial areas because of the heavier use of fossil fuels (Jung et al., 1997; Skinner et al., 2006; Solga et al., 2005). Since agriculture and industry coexist at MV,
10
we expected theT. recurvataδ13C andδ15N to reflect these land uses.
A data matrix with 50 MV sites and 38 chemical variables was reduced by standard univariate statistical techniques. Exploratory factor analysis (FA) of selected variables and mapping allowed us to detect the major regional emission sources. As far as we know, this is the first report on the bioaccumulative air pollution of MV using
biomoni-15
toring techniques.
2 Materials and methods
2.1 Study area
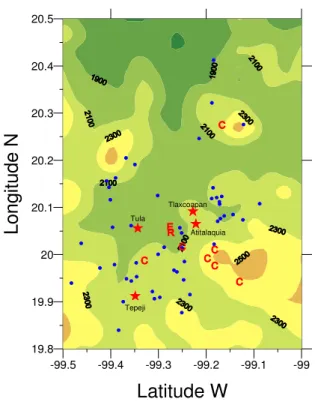
Mezquital Valley is located in Hidalgo State, Mexico, ca. 60 km NW of Mexico City (Fig. 1). It is a semiarid region (ca. 2429 km2) with about 500 thousand inhabitants
20
distributed in medium-size towns (e.g., Tula and Tepeji del R´ıo) and many small vil-lages. The mean annual temperature and precipitation range from 16.5◦C and 432 mm at the north portion of the valley, which is mainly dedicated to agriculture, to 17.2◦C and 647 mm at the industrialized south. The mean elevation at the agriculture flat-lands is 2000 m above mean sea level, and up to 2400 m in the surrounding
moun-25
ACPD
9, 5809–5852, 2009Distribution and sources of bioaccumulative air
pollutants
A. Zambrano Garc´ıa et al.
Title Page
Abstract Introduction
Conclusions References
Tables Figures
◭ ◮
◭ ◮
Back Close
Full Screen / Esc
Printer-friendly Version
Interactive Discussion as dominant element. This vegetation disappeared at the agricultural areas and is
now restricted to the foothills and highlands. Over 90 000 ha of MV are currently dedi-cated to agriculture with raw sewage water from Mexico City. This is the major cause of chemical and biological contamination of the regional soils (Siebe and Cifuentes, 1995). The Tepeji-Tula-Atitalaquia industrial corridor has about 140 industries,
includ-5
ing a petroleum refinery (325 thousand barrels/day); a 1500 MW electricity power plant fueled with residual fuel oil and, secondarily, with natural gas, and over 20 small and large cement plants. That electricity plant is the largest emitter of air toxics among similar Mexican facilities (CEPAL-SEMARNAT, 2004). The regional cement production relies on raw limestone material obtained nearby by dusty open-sky mining operations.
10
Cement is processed using residual fuel oil, petroleum coke and other materials, like used tiers and industrial wastes. Other MV industries include non-ferrous metal man-ufacturing, textile, chemical, processed food, and disposal, recycling or incineration of waste materials. Cabrera et al. (2003) estimated the MV emissions of total suspended particles (TSP) from industrial and mobile sources in 21 538 ton year−1. This is a rather
15
large amount, representing ca. 80% of the same emissions at the much larger and higher populated Mexico City (27 308 ton/year, SMA 2006). The contribution from nat-ural and agricultnat-ural sources to the MV air pollution is still unknown. Two major regional natural/crustal sources of particulate material are the Cretaceous limestone (El Doc-tor Formation) that covers about 60% of MV, and mainly exposed at the E-SE secDoc-tor
20
(Silva-Mora, 1997), and Lower Tertiary igneous rocks, roughly located at the valley’s west half.
2.2 Sampling and sample preparation
Tillandsia recurvatawas sampled at 50 sites throughout MV in the late spring and early summer, 2006 (Fig. 1). Most sites were at mountain foothills where mesquite trees,
25
ACPD
9, 5809–5852, 2009Distribution and sources of bioaccumulative air
pollutants
A. Zambrano Garc´ıa et al.
Title Page
Abstract Introduction
Conclusions References
Tables Figures
◭ ◮
◭ ◮
Back Close
Full Screen / Esc
Printer-friendly Version
Interactive Discussion site were collected from tree branches at≥1 m from the ground, each composed by
six to eight “ball moss” individuals from different trees. Cross contamination between samples was avoided by wearing new dust-free latex gloves per sample. Samples were taken to the laboratory in air-dried condition in brown paper bags, and stored at ambient temperature until processing (late September/October, 2006). Prior chemical
5
analyses, plant dead parts and extraneous materials like insects, feathers and spider webs were removed manually. Since T. recurvata is perennial, potential age-related variability in pollutant bioaccumulation was minimized by analyzing only the newest 3– 4 pairs of leaves per shoot, representing probably one to two years of environmental exposition. The clean samples were subdivided into three portions for metal, PAH and
10
isotopic analyses, and stored in polyethylene bags at−40◦C until analyses.
2.2.1 Metals
The glass and Teflon material for sample digestion was cleaned by immersion in 10% HNO3(24 h) followed by profuse rinsing with deionized water. The plant samples were oven-dried to constant weight (70◦C, three days) and ground to fine powder with agate
15
mortar and pestle. A fraction of powder (0.15–0.2 g per sample) was digested with 6.0 ml HNO3(65%, Merck), 4.0 ml HCl (38%, JT Baker, Ultrex II), and 0.2 ml HF (48%, JT Baker, Ultrex II) in a microwave oven (Anton Paar, Multiwave 3000) using the “pine needles” program: phase I (power, 1400 W; ramp, 10 min; hold, 10 min; fan 1), phase 2 (power, 0 W; hold, 30 min; fan, 2). Digestion temperature: 180◦C. The digests were
20
filtered with Whatman 4 paper and brought to 25 ml with deionized water.
The elements were determined by inductively coupled plasma/optical emission spec-trometry (ICP-OES, Perkin–Elmer, Optima 3200 DV) following the USEPA 6010C method (EPA, 2000). The sample injection flow was 1.0 ml min−1. Calibration curves were prepared with diluted element standard solutions (High Purity). QC repeatability
25
ACPD
9, 5809–5852, 2009Distribution and sources of bioaccumulative air
pollutants
A. Zambrano Garc´ıa et al.
Title Page
Abstract Introduction
Conclusions References
Tables Figures
◭ ◮
◭ ◮
Back Close
Full Screen / Esc
Printer-friendly Version
Interactive Discussion (mean±coefficient of variation): Al (102.2±2.0), Ca (113.5±10.1), Fe (117.3±7.5), Mg
(84.8±13.9), P (96.5±2.0), Zn (83.0±5.1). The recovery of Ba was low (35.8±6.4%), but was very good for In (103.7±2.9%), which was added as surrogate from a 5.0 ppm standard solution.
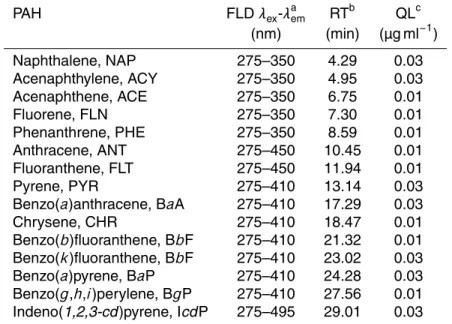
2.2.2 PAH
5
The samples were organically extracted in microwave oven and analyzed by high per-formance liquid chromatography (HPLC) for the 15 PAH listed in Table 1. All glass-ware and Teflon materials for sample preparation were cleaned with liquid detergent (Liqui Nox), running water and consecutive rinsing with bidistilled water, acetone and dichloromethane (DCM). Samples (5 to 8 g, air-dry weight) were ground with ceramic
10
mortar and pestle under liquid nitrogen. A fraction of powder (0.25–0.5 g) was oven-dried (90◦C, 24 h) for dry weight determination and about 2.0 g were extracted in 10-sample batches with 30 ml DCM in microwave oven (CEM, model MarsX). The oven was programmed as USEPA 3546 method: potency, 1200 W; pressure, 100 psi; tem-perature, 115◦C; time, 15 min; total extraction time, 30 min; cooling, 2 h. Each
extrac-15
tion batch included one pure DCM blank and one positive laboratory control sample (LCS). As a surrogate for the vegetal matrix, the LCS were added 0.5 g of dehydrated and deactivated Cromosorb (60/80 mesh, Supelco, Inc; 400◦C for 4 h) and 200 µl of standard mixture containing 5 µg/ml of each target PAH (Chemservice). The extracts were filtered through Millipore membrane and concentrated to 1.0 ml under a
gen-20
tle stream of ultrapure nitrogen supplied with a nitroevaporator (8158, N EVAP111, Organomation Associates, Inc). The concentrates were cleaned up with glass chro-matographic columns (40 cm length×1.5 cm ID) filled with deactivated (400◦C for 4 h)
alumina-silica-gel (USEPA 3610B and 3630C). The columns were packed from bottom to top with 1.0 cm silanized glass fiber (Alltech) humidified with DCM, 10 g alumina
25
ACPD
9, 5809–5852, 2009Distribution and sources of bioaccumulative air
pollutants
A. Zambrano Garc´ıa et al.
Title Page
Abstract Introduction
Conclusions References
Tables Figures
◭ ◮
◭ ◮
Back Close
Full Screen / Esc
Printer-friendly Version
Interactive Discussion under ultrapure nitrogen, changed into acetonitrile (4.0 ml, Burdick & Jackson), filtered
with 0.2 µm acrodiscs (Pall Gelman Laboratory), reconcentrated to 500 µl with ultrapure nitrogen and stored at−40◦C in amber glass vials until analyses.
The extracts were analyzed with a liquid chromatograph (Agilent HP, 1100 series) equipped with Nucleosil column (Macherey-Nagel, 265 mm, 100-5 C18 PAH), an
auto-5
matic sample injector, and DAD and fluorescence detectors. The analyses were done in 10-sample batches plus one blank and one positive control. Each batch had its own calibration curve with seven concentrations (0.0625 to 5.0 µg/ml) of stock ace-tonitrile solution containing 5 µg/ml of each target PAH. Samples were added 150 µl of 4,4′-difluorobifenil (Chemservice) solution in acetonitrile (4 µg/ml) as internal standard.
10
Solvents A (methanol, 50%; acetonitrile, 25%; HPLC water, 25%) was injected from 0 to 3 min and gradually exchanged by solvent B (acetonitrile) from 3 to 21 min; only sol-vent B was injected from 21 to 35 min. Injection volume, 5 µl; flux, 0.3 ml/min; column temperature, 25◦C; wavelength (FLD: 275–495 nm, Table 2; DAD: 230 nm); total analy-sis time per sample extract, 30 min. Method validation parameters: linearity (R2<.98);
15
accuracy and precision (RSD<3%); detection limit, (1.0 µg ml−1); quantification limits, 0.01 to 0.03 µg ml−1, depending on the compound (Table 1).
2.2.3 δ13C andδ15N
Air-dried samples (200–500 µg) were ground with cleaned ceramic mortar and pestle under liquid nitrogen, and dried at 80◦C for 24 h. The δ13C and δ15N ratios were
20
determined with a dual carbon and nitrogen analyzer coupled to a continuous flow isotope ratio mass spectrometer (Europa Scientific). Equipment precision was 0.1‰ for C and 0.2 ‰ for N. The isotopic composition is defined by:
δ13C or δ15N(‰)=(Rsample/Rstandard−1)×1000
where R is the sample or standard ratio of the heavy to the light isotope: 13C/12C
25
ACPD
9, 5809–5852, 2009Distribution and sources of bioaccumulative air
pollutants
A. Zambrano Garc´ıa et al.
Title Page
Abstract Introduction
Conclusions References
Tables Figures
◭ ◮
◭ ◮
Back Close
Full Screen / Esc
Printer-friendly Version
Interactive Discussion 2.3 Statistics
The raw site-pollutant data base was regionally summarized by simple central tendency and dispersion statistics. The geographical distribution of pollutant was explored by mapping with a geostatistical gridding method for irregularly spaced data (Surfer, Ver. 7.05, Kriging method) and comparing concentrations between and among MV areas
5
witht-tests or ANOVA, as appropriate. Potential emission sources were explored by factor analyses (FA) with principal component extraction and normalized varimax rota-tion (Statistica, Ver. 6.0). Since 50 sampling sites was a small number of cases, FA was used conservatively. Only 20 pollutants were included in FA to keep a 2.5 site to variable ratio. The standardized median site values were used for FA. Pollutants
10
excluded from this analysis had one or more of the following problems: they were not detected or below quantification levels at≥8 sampling sites (i.e., 16% of sites: Pb, Sb,
BaA, BbF, BkF, BaP and IcdP); high skewness (>2) and/or kurtosis (>7); strong de-viation from normality even after log transformation (Shapiro-Wilk test); no significant correlation with any other pollutant, because they tended to form factors with single
pol-15
lutants (e.g., Cd and Cr), or contrarily, very high correlation (r>.9), which may lead to multicollinearity. All low and some medium molecular weight PAH, which predominantly disperse in the gas phase, were also excluded from FA (NAP, ACY, ACE, FLN, PHE, ANT and FLT). Finally, the pollutant selection for FA was aided by considering element signal to noise ratios (SNR), which relate the regional to the site variability, as defined
20
by Wolterbeek et al. (1996), and the element enrichment factors (EF) calculated as
EF=(Xs/Als)/(Xr/Alr)
where Xs and Als are the sample element and aluminum concentrations (ppm), re-spectively; Xrand Alrare the element and aluminum concentrations (ppm) in the main crustal rocks of MV: limestone, according to Lozano and Bernal (2005), and igneous
25
ACPD
9, 5809–5852, 2009Distribution and sources of bioaccumulative air
pollutants
A. Zambrano Garc´ıa et al.
Title Page
Abstract Introduction
Conclusions References
Tables Figures
◭ ◮
◭ ◮
Back Close
Full Screen / Esc
Printer-friendly Version
Interactive Discussion
3 Results and discussion
Mezquital Valley was biomonitored withT. recurvata to detect the regional dispersion trends and potential emission sources of airborne metals and PAH.
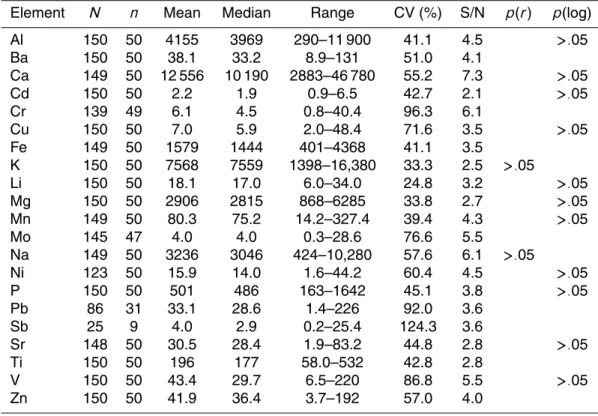
3.1 Metals
Table 2 summarizes the regional element concentrations in the biomonitorT. recurvata.
5
Calcium was the most abundant element (regional mean, 1.3% on dry weight basis; min, 0.5%; max, 4.5%). This indicated high regional exposure to limestone dust at MV, which is exacerbated by the cement industry. Predominance of Ca in lichen biomonitors growing near a cement plant was recently reported by Branquinho et al. (2007). They considered this element as the best indicator for cement-dust. Other geochemically
10
major elements followed Ca in abundance (%): K (0.76)>Al (0.42)>Na (0.34) > Mg (0.29)>Fe (0.17)>P (0.05)>Ti (0.02)>Mn (0.008).
The trace element constituted individually less than 0.005% of the T. recurvata dry biomass: V (0.0044)>Zn (0.0042)>Ba (0.0038)>Pb (0.0034)> Sr (0.0031)>Li (0.0018)>Ni (0.0016)>Cu (0.0007)>Cr (0.0006) >Sb (0.0005)>Mo (0.0004)>Cd
15
(0.0002). The prevalence of V, an element typically abundant in crude oils (Bairwise, 1990), can be attributable to emissions from the major industrial users of petroleum fuels at MV. This will be detailed later.
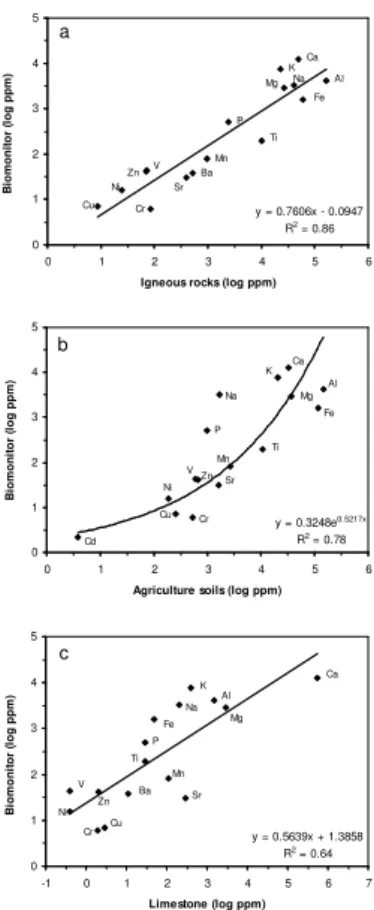
At the gross level of data reduction in Table 2, the element concentrations inT. re-curvatareflected the composition of the MV crustal rocks and agriculture soils (Fig. 2).
20
According to this figure, there was a closer chemical similarity between the biomonitor and the igneous rocks (R2=.86) than for soils (R2=.78) and limestone (R2=.64). Thus, a high proportion of the spatial element variability in the biomonitor could be expected to derive from these sources.
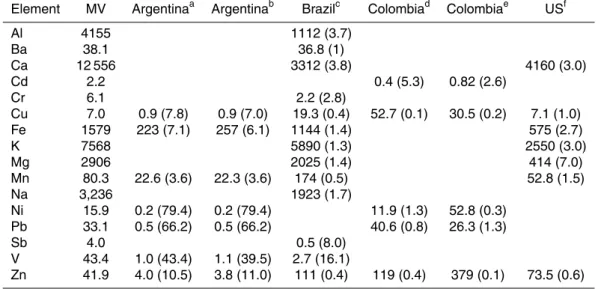
Most measured elements had higher mean concentrations than reported for other
25
ACPD
9, 5809–5852, 2009Distribution and sources of bioaccumulative air
pollutants
A. Zambrano Garc´ıa et al.
Title Page
Abstract Introduction
Conclusions References
Tables Figures
◭ ◮
◭ ◮
Back Close
Full Screen / Esc
Printer-friendly Version
Interactive Discussion ratio was≥2 in 25 out of 44 cases in Table 3, which implies≥100% higher
bioaccumu-lation by the Mexican Tillandsia and, assuming similar interspecies ability to capture and retain airborne metals, at least equally higher atmospheric deposition at MV. Such difference was larger for anthropogenic elements like Ni, Pb and V, whose concentra-tions were, respectively, 79, 66 and up to 43 times as high as forTillandsiabiomonitors
5
reported for Argentina (Wannaz et al., 2006a,b). The MV:OT ratio was<1.0; i.e., lower element concentration inTillandsiaat MV, in 11 cases (Table 3). Most of them involved Cu and Zn biomonitored within urban/industrial areas at S ˜ao Paulo, Brazil (Figuereido et al., 2007), and Cali and Medellin, Colombia (Schrimpff, 1984). This is in part due to the fewer rural sites included in these later studies, since they are usually less exposed
10
to anthropogenic emissions and tend to lower the mean concentrations calculated at the regional level.
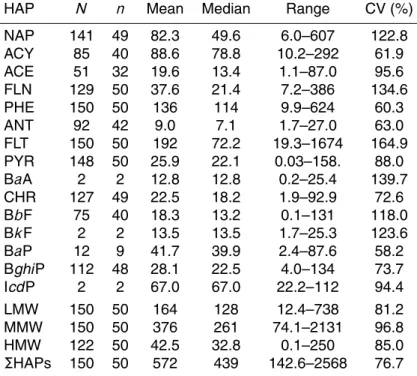
3.2 PAH
Table 4 summarizes the regional concentration and variability of PAH in the biomoni-tor. The sum of quantified PAH per site ranged from 143 to 2568 ng g−1, with regional
15
mean and median equal to 572 and 439 ng g−1, respectively, indicating a data distribu-tion skewed to the right. Apart from PHE and CHR, which were lognormally distributed, the rest of PAH had neither normal nor lognormal distributions. The regional variabil-ity of PAH depended on the compound, ranging from 58% (ACY) to 165% (FLN). The medium molecular weight PAH (MMW: PHE, ANT, FLT, PYR, BaA and CHR) was the
20
most abundant group, representing 64.5% of the total measured PAH. The low molec-ular weight PAH (LMW: NAP, ACY, ACE and FLN) constituted 28.1%, and the high molecular weight (HMW: BbF, BkF, BaP, BghiP and IcdP) only 7.3%. The relatively low amount of the most hazardous PAH group (HMW) deserves further research to be explained. Hypothetically, it may be attributed to photodegradation enhanced by
25
the high solar irradiation rates received in this tropical semiarid region and the scarce protection from it provided by the very open local vegetation.
ACPD
9, 5809–5852, 2009Distribution and sources of bioaccumulative air
pollutants
A. Zambrano Garc´ıa et al.
Title Page
Abstract Introduction
Conclusions References
Tables Figures
◭ ◮
◭ ◮
Back Close
Full Screen / Esc
Printer-friendly Version
Interactive Discussion sampled sites, as well as CHR, NAP and BghiP, which were missing only at one or
two sites. Most HMW PAH had low to very low frequencies. For instance, BaP had quantifiable levels at only nine sites, and BaA, BkF and IcdP at the two sites closest to the petroleum refinery and the electrical power plant (Fig. 1). The most abundant compounds were FLT (24.2% of total quantified PAH, regional average), PHE (17.1%)
5
and NAP (10.4%).
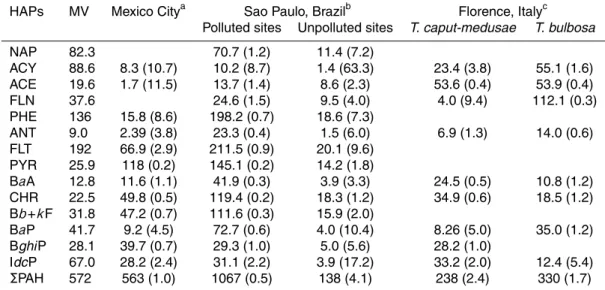
Table 5 compares the mean total PAH inT. recurvataat MV with other biomonitoring studies usingTillandsia. Such comparisons are, however, limited by the several factors affecting the total sum of PAH; e.g., the number and type of measured compounds, the biomonitor’s ability to capture and retain them, and design aspects of the biomonitoring
10
studies; e.g., number and type of sampling sites, length of exposure and sampling strat-egy (in situ vs. transplanted samples). No difference was clear between the total PAH at MV and one heavily polluted site at Mexico City measured by Wang et al., (2007) with pine needles, a morphologically and physiologically different receptor. The mean total PAH reported for T. usneoides from polluted sites in R´ıo de Janeiro (De Sousa
15
et al., 2007) doubled the mean value at MV. Nevertheless, the most polluted MV sites had similar or slightly different total PAH (1284–1748 ng g−1) than the polluted sites at Rio de Janeiro, and no MV site had lower total PAH than unpolluted Brazilian sites (93 to 175 ng g−1). Levels of total PAH at MV were 70 to 140% higher than recorded for two differentTillandsiaspecies transplanted from Costa Rica into downtown Florence,
20
Italy, for eight months (Brighina et al., 2002).
3.3 δ13C andδ15N
The δ13C and δ15N isotopic ratios of T. recurvata showed that this epiphyte is less discriminant against13C and more discriminant against15N than most terrestrial plants, and their spatial patterns at MV reflected the regional differences in C and N emissions
25
from the main land uses.
The regionalδ13C ratio (mean, −14.6‰; min, −15.7‰; max, −13.7‰) was similar
ACPD
9, 5809–5852, 2009Distribution and sources of bioaccumulative air
pollutants
A. Zambrano Garc´ıa et al.
Title Page
Abstract Introduction
Conclusions References
Tables Figures
◭ ◮
◭ ◮
Back Close
Full Screen / Esc
Printer-friendly Version
Interactive Discussion Tillandsiawith crassulacean acid metabolism (CAM;δ13C>−20‰, Crayn et al., 2004);
i.e., plants which fix CO2 predominantly at night as a water-saving adaption to arid environs (Pierce et al., 2002). This ratio was the most homogeneous of the measured variables. It varied only 2‰throughout MV (CV, 9.0%). Its less negative values oc-curred at the predominantly rural NW sector of the valley (δ13C=−14.3‰±0.13, mean
5
±standard error), being on average 0.6‰ higher than at the industrialized SE sector
(−14.9‰±0.12;p<.006 from one-way ANOVA by sectors). This suggests that “back-ground” regionalδ13C values for this plant may be similar to those at the NW sector (−14.3‰, on average).
The δ13C decreased in T. recurvata from the rural periphery of MV (≥−14.5‰)
to-10
ward the core industrial area (≤−15‰, Fig. 3a). This negative shift reflected the in-creased emissions of13C-depleted compounds from industrial fossil fuel combustion. This shift was expectable because crude petroleum and its combustion subproducts have more negativeδ13C values (−20 to−35‰, Goldstein and Shaw, 2003; Pichlmayer et al., 1998) thanT. recurvata. This was confirmed by the regional positive correlation
15
between the biomonitor’s δ13C and the Ni/V ratio (r=.39, p=.01), which was even closer (r=.70,p=.001) when considering only the sampling sites within a belt transect in the predominant wind direction (NE-SW, Fig. 4). These ratios had a parallel pattern along that transect, including a sharp decline at the sites located downwind of the main electric power plant and the refinery.
20
The spatial pattern of δ15N reflected the emissions of this element from agricul-ture and industrial land uses at MV. Its regional mean was−3.0‰ (min,−9.9‰; max, 3.3‰), which represented 6 to 9.6‰ enrichment in15N with respect to other Mexican atmosphericTillandsia from less polluted habitats (δ15N=−9.0 to −12.6‰, Hietz and
Wanek, 2003; Hietz et al., 1999). The lowest, probably “background”δ15N values ofT.
25
ACPD
9, 5809–5852, 2009Distribution and sources of bioaccumulative air
pollutants
A. Zambrano Garc´ıa et al.
Title Page
Abstract Introduction
Conclusions References
Tables Figures
◭ ◮
◭ ◮
Back Close
Full Screen / Esc
Printer-friendly Version
Interactive Discussion This is documented to occur in MexicanT. recurvata(Puente and Bashan, 1994), but
this needs experimental work to be clarified.
The δ15N spatial pattern of T. recurvata at MV changed from positive (>3.0‰) to negative (<−6.0‰) along the predominant wind direction (NE-SW, Fig. 3b). The most
positive or slightly negative values occurred near agriculture and industrial/urban
ar-5
eas, whereas the most negative were recorded at the farther W-SW rural sites. Sim-ilarly high to lowδ15N spatial contrasts have been documented for plants growing at other industrial/urban or agriculture areas and rural/remote locations (Gerdol et al., 2002; Jung et al., 1997; Pearson et al., 2000; Solga et al., 2005). Such contrasts are in general attributed to the higher N emission/deposition by human activities in the
for-10
mer areas. This explanation finds support from the positive correlations often observed between plantδ15N and the total N deposition (e.g., Pardo et al., 2007; Skinner et al., 2006). There are two major, probably supplementary, hypotheses about what causes the higher plant δ15N at urban/industrial areas: (a) increased exposure to some oxi-dized N species (NOx) mainly from fossil fuel combustion, and b) fractionating losses
15
of the lighter14N compounds from the plants by leaching or nitrification processes with subsequent concentration of 15N in the remaining N pools (Jung, 1997). A spatial contrast between theδ15N of mosses sampled near agriculture areas (less negative values) and rural environs (more negative values) was reported by Solga et al. (2005). They found this contrast related to the NH4:NO+3 ratio in the bulk N deposition. This
ra-20
tio was higher at agriculture areas; i.e., it was inversely proportional to the mossδ15N. This implies that increasing the proportion of NO+3 and/or other compounds with high δ15N in the bulk deposition, like N2O (+6.7 to+7.0‰, Brenninkmeijer et al., 2003) shift positively this plant ratio.
The positive δ15N values in the biomonitor near the MV agriculture areas may be
25
ACPD
9, 5809–5852, 2009Distribution and sources of bioaccumulative air
pollutants
A. Zambrano Garc´ıa et al.
Title Page
Abstract Introduction
Conclusions References
Tables Figures
◭ ◮
◭ ◮
Back Close
Full Screen / Esc
Printer-friendly Version
Interactive Discussion et al., 2007). This is most likely the case at MV, where agriculture soils have a net
positive N balance despite the substantial loss that may occur by volatilization of N compounds from the open wastewater channels and during irrigation (Siebe, 1998). Specifying which N compounds accounted for theδ15N distribution at MV was beyond the reach of this survey; however, it can be hypothesized that gaseous and particulate
5
emissions of compounds with highδ15N (e.g., N2O and NO3, respectively) from those channels and soils are large enough to shift the naturally negativeδ15N ofT. recurvata toward positive values. Recent, spatially limited measurements (5 ha) on the emissions of N2O from MV agriculture soils show rates varying from 0.01–0.04 mg m
−2
h−1prior irrigation with wastewater to 3.4 mg m−2h−1 after irrigation; i.e., similar to fluxes from
10
fertilized arable soils (Gonz ´alez-M ´endez, et al. 2008). Other regional activities, like burning of agriculture debris, may also contribute to the highδ15N values of this plant. The plantδ15N in the core industrial area (0 to +3‰) was similar to values at the agriculture sites. This could be due both to in situ N emissions from fossil fuel com-bustion sources (signaled with C, E and R in Fig. 3b) and wind-transported N from the
15
main agriculture areas located immediately to the north of the industrial park.
3.4 Pollutant distribution and potential emission sources
Some insights on the element spatial dispersion at MV can be derived from their re-gional variability in the biomonitor (Table 2). The average coefficient of variation was 51% and ranged from 19% (Li) to 141% (Sb). The elements with lower variability (e.g,
20
Li, 19%, and K, 25%) were in general more homogeneously distributed throughout the region than those more variable (e.g., V, 83%, Cr, 72%). The former elements are more likely to be emitted by widely distributed sources; e.g., soil or crustal rocks, whereas the latter ones may derive from localized emission sources.
In looking for spatial patterns of the studied pollutants, the median site concentrations
25
ACPD
9, 5809–5852, 2009Distribution and sources of bioaccumulative air
pollutants
A. Zambrano Garc´ıa et al.
Title Page
Abstract Introduction
Conclusions References
Tables Figures
◭ ◮
◭ ◮
Back Close
Full Screen / Esc
Printer-friendly Version
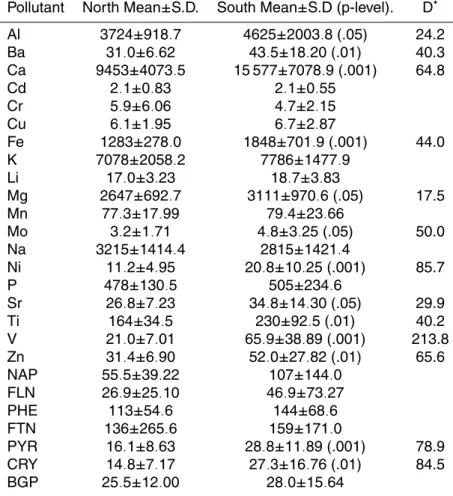
Interactive Discussion Sr, Ti, V and Zn), and CHR and PYR had 18 to 214% higher concentrations at the
industrial area (p<.05, Table 6), and none was significantly more concentrated at the agricultural north. Such spatial difference is partially illustrated in Fig. 5. This figure plots the site normalized median concentration of Ca, CHR, PYR and V within a belt transect oriented along the predominant wind direction (NNE to SSW), including the
5
main types of particle emitters in the region. At the industrial area (≥0 km in Fig. 5), those pollutants had site concentrations up to 5.2 (Ca), 4.2 (CHR), 4.8 (PYR) and 29 (V) times higher than at the farthest north, rural location (Mixquiahuala, 37 km, or
−37 km in Fig. 5). At sites near or within the main north agriculture area (−2 to−30 km in Fig. 5), most elements and PAH had intermediate concentrations.
10
Figure 6 illustrates four selected distribution patterns of pollutants as mapped with the median site data. Vanadium (Fig. 6a) had a well-defined single concentration peak 3.7 km to the south of the major petroleum processing and combustion facilities. Its concentration dropped concentrically from there, but at faster rate toward the north than to south, indicating air transport in this direction. The V concentration slightly increased
15
again southward (ca. 12 km from the main peak) probably due to further fossil fuel emissions from cement industries, which are heavy users of residual petroleum and other materials (petcoke, natural gas, vehicle tires and a variety of residual materials). Chromium had also a single high concentration peak (>20 mg kg−1; Fig. 6b) located at the north end of the valley; i.e., upwind from the industrial park. Two potential
20
sources causing this Cr peak are nearby polluted agriculture soils and mining opera-tions for limestone. At the rest of the sampling areas, the biomonitor had rather similar Cr levels (≈5 mg kg−1).
Calcium had two high concentration spots coinciding with two major limestone areas, where mining for raw cement materials occurs, one at the NE and the other at the SE
25
of the study region (Fig. 6c). In general, this element was more concentrated at the East half of MV were limestone rocks predominate. Its maximum site concentration occurred in the SSE sector, where the largest cement plants are located.
concen-ACPD
9, 5809–5852, 2009Distribution and sources of bioaccumulative air
pollutants
A. Zambrano Garc´ıa et al.
Title Page
Abstract Introduction
Conclusions References
Tables Figures
◭ ◮
◭ ◮
Back Close
Full Screen / Esc
Printer-friendly Version
Interactive Discussion trations were recorded at the south of MV, mainly to the E-SW of the core industrial
area, and the lowest concentrations at the mostly rural NW sector, upwind with respect to urban/industrial areas. The tree concentration peaks in Fig. 6d were determined by the most abundant MMW (FLT and PHE) and LMW (NAP) PAH, probably reflecting vehicular emissions from the closest urban settlements.
5
Prior to factor analysis, the element signal-to-noise ratio and enrichment factors (EF) were considered together with other criteria for variable selection (see Statistic section). The average SNR was 4.1 (min, 2.1, Cd; max, 7.3, Ca, Table 2), which was good in terms of signal information for a biomonitoring survey compared to values reported by Wolterbeek et al. (1996) for lichen, mosses and tree bark biomonitors (1.3 to 3.4).
10
Figure 7 shows the mean element EF relative to the Al concentrations in the regional rocks. Enrichment values close to 1.0 are in general indicative of crustal origin; higher EF values, subjectively ≥5, indicate enrichment by anthropogenic emissions.
Potas-sium, Ni, P, V and Zn were more enriched in the biomonitor than expected from their average abundance in the MV igneous and limestone rocks. Therefore, those elements
15
are likely to derive from industrial (Ni, V and Zn) and, tentatively, agricultural sources (K and P). Sodium, in contrast, was enriched only with respect to limestone; whereas Ca and Cu were enriched with respect to igneous rocks. The rest of elements in Fig. 5, Ba, Cr, Mg, Mn, Sr and Ti, probably originated from regional crustal/soil sources. The nat-ural emission of some elements can be enhanced by activities like mining. This could
20
be the Ca and Cr cases at MV since their highest concentrations in the biomonitor occurred at sites close to limestone mining areas.
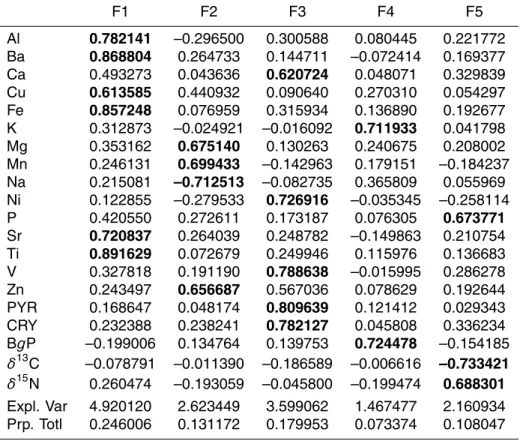
Tables 7 and 8 show a factor analysis solution for the 50×20 (sites x pollutants)
standardized data matrix. Five factors or potential sources with eigenvalues>1.0 ac-counted for 74% the data variance. Most of this variability (39.5%) was associated with
25
ACPD
9, 5809–5852, 2009Distribution and sources of bioaccumulative air
pollutants
A. Zambrano Garc´ıa et al.
Title Page
Abstract Introduction
Conclusions References
Tables Figures
◭ ◮
◭ ◮
Back Close
Full Screen / Esc
Printer-friendly Version
Interactive Discussion dust in N to S direction. This factor could be more related to soil formed mainly by
igneous parental material because its main elements are much richer in these rocks than in limestone. According to regional geochemical data (Lozano and Bernal, 2005; Verma-Surendra, 2001), Al, Ba, Cu, Fe and Ti are, respectively, 106, 48, 3, 1, 201 and 340 times more concentrated in the igneous rocks than in limestone.
5
Factor 2 (F2) accounted for 11.3% of the variance. It was loaded by Mg, Mn and Zn and may be related to soil sources. Interestingly, and contrasting with these elements, Na loaded negatively on this factor. This factor may thus distinguish inputs from natural (Mg, Mn and Zn) and saline agriculture soils. Sodium is the main cation in the MV irrigation wastewater (Cervantes-Medel and Armienta, 2004; Jimenez and Ch ´avez,
10
2004). Siebe (1998) attributed this to Na transport by the wastewater from saline areas near Mexico City. Consistently, the biomonitor had the highest Na concentrations (4000 to 5000 mg kg−1) within or near the MV agriculture areas (Fig. 8).
Factor 3 (F3) accounted for 9.8% of the variance. This factor was significantly loaded by PYR, V, CRY, Ni, Ca and, to some extent, Zn. It is clearly an industrial factor
15
with pollutants derived from fossil fuel combustion and cement production (Ca). The presence of Ca on this factor is explained by the regional spatial correlation between the main fixed fossil fuel combustion sources and the main cement plants in the S-SE of MV. The negative loading ofδ13C within this factor confirmed its association with petroleum combustion. This is illustrated in Fig. 4 by comparing theδ13C variation with
20
the Ni:V ratio, another reliable indicator of petroleum combustion emissions. Figure 9 shows how the elements with mainly crustal origin (Al, Ba, Cu Fe, Sr and Ti) and the industrial pollutants (Ca, CRY, Ni, PYR, V and Zn) separate between the F1 and F3.
Factor 4 (F4) had 8.1% of the variance associated with it. It was loaded by K and benzo(g,h,i)perylene, tentatively deriving from biomass burning, which may include
25
(Cervantes-ACPD
9, 5809–5852, 2009Distribution and sources of bioaccumulative air
pollutants
A. Zambrano Garc´ıa et al.
Title Page
Abstract Introduction
Conclusions References
Tables Figures
◭ ◮
◭ ◮
Back Close
Full Screen / Esc
Printer-friendly Version
Interactive Discussion Medel and Armienta, 2004; Jimenez and Ch ´avez, 2004) and P (Ortega-Larrocea et al.,
2001). Phosphorus may also derive from the use of agricultural pesticides, which often contain this element.
Although FA does not extract pure factor/sources, it acceptably distinguished contri-butions from the most relevant generic sources of particulate matter into the MV air.
5
The element variability appeared mainly associated with natural/soil sources and agri-culture activities (F1+F2+F4+F5, 64% of the total variance explained), whereas the PAH, especially CHR and PYR, and the elements Ca, Ni, V and Zn characterized the industrial fossil fuel combustion emissions: electricity generation, petroleum refining and cement production. Increasing the number of sampling sites may have allowed
10
us to account for contributions of specific emission sources to the load of atmospheric bioaccumulative pollutants in the study region.
4 Conclusions
This study produced previously unknown information on the regional levels, sources and dispersion of airborne metals and PAH at MV. The results allowed us the following
15
conclusions. The site to site variability of most metals and PAHs inT. recurvataat MV reflected a differential long-term exposure to them. In general, most metals and some PAH had higher concentrations at this region than reported for similar biomonitors in other countries. The chemical correlation between the biomonitor and the regional rocks and the results from factor analysis and the spatial distribution indicated that
nat-20
ural sources had a higher relative importance than agricultural and industrial ones on the variability of the studied pollutants. Tillandsia recurvatawas confirmed as a good biomonitor for bioaccumulation of air pollutants. In addition, its relatively high “back-ground” δ13C and low δ15N compared to most plants make this epiphyte a sensitive monitor for C and N sources. It may be thus useful to use it as a common natural
recep-25
ACPD
9, 5809–5852, 2009Distribution and sources of bioaccumulative air
pollutants
A. Zambrano Garc´ıa et al.
Title Page
Abstract Introduction
Conclusions References
Tables Figures
◭ ◮
◭ ◮
Back Close
Full Screen / Esc
Printer-friendly Version
Interactive Discussion Acknowledgements. This study was funded by the Mexican Oil Company (PEMEX, project
F.21393) and the Mexican Petroleum Institute (D.00391), and conducted under the MILAGRO 2006 Mexico field campaign. We thank I. Garc´ı a Torres and J. Rojas for assistance in the sample preparation process, and Dr. M. Mor ´an Pineda, executive of the IMP Gas Spectroscopy and Environmental Studies Laboratory, for logistical support.
5
References
Aboal, J. R., Real, C., Fern ´andez, J. A., and Carballeira, A.: Mapping the results of extensive surveys: the case of atmospheric biomonitoring and terrestrial mosses, Sci. Total Environ., 356, 256–274, 2006.
Benzig, D. H., Arditti, J., Nyman, L. P., Temple, P. J., and Adams, J. P.: Effects of ozone and
10
sulfur dioxide on four bromeliads, Environ. Exp. Bot., 32(1), 25–29, 1992.
Bairwise, A. J. G.: Role of nickel and vanadium in petroleum classification, Energ. Fuels, 4, 647–652, 1990.
Branquinho, C., Gaio-Oliveira, G., Augusto, S., Pinho, P., M ´aguas, C., and Correia, O.: Biomon-itoring spatial and temporal impact of atmospheric dust from a cement industry, Environ.
15
Pollut., 151(2), 292–299, 2008.
Brenninkmeijer, C. A. M., Janssen, C., Kaiser, J., R ¨ockmann, T., Rhee, T. S., and As-sonov, S. S.: Isotope effects in the chemistry of atmospheric trace compounds, Chem. Rev., 103, 5125–5161, 2003.
Brighina, L., Papini, A., Mosti, S., Cornia, A., Bocchini, P., and Galleti, G.: The use of tropical
20
bromeliads (Tillandsia spp.) for monitoring atmospheric pollution in the town of Florence, Italy, Rev. Biol. Trop., 50(2), 577–584, 2002.
Bukata, A. R. and Kyser, T. K.: Carbon and nitrogen isotope variations in tree-rings as records of perturbations in regional carbon and nitrogen cycles, Environ. Sci. Technol., 41, 1331– 1338, 2007.
25
Cabrera Ru´ız, R. B. E., Gordillo Mart´ınez, A. J., and Cer ´on Beltr ´an, A.: Inventario de contami-naci ´on emitida a suelo, agua y aire en 14 municipios del Estado de Hidalgo, M ´exico, Revista Internacional de Contaminaci ´on Ambiental 19(4), 171–181, 2003.
ter-ACPD
9, 5809–5852, 2009Distribution and sources of bioaccumulative air
pollutants
A. Zambrano Garc´ıa et al.
Title Page
Abstract Introduction
Conclusions References
Tables Figures
◭ ◮
◭ ◮
Back Close
Full Screen / Esc
Printer-friendly Version
Interactive Discussion
moel ´ectrica en M ´exico. http://www.semarnat.gob.mx/informacionambiental/Publicacion/ext. pdf, 2004.
Cervantes-Medel, A. and Armienta, M. A.: Influence of faulting on groundwater quality in Valle del Mezquital, Mexico. Geof´ısica Internacional, 43(3), 477–493, 2004.
Cifuentes, E., Blumenthal, U., Ru´ız Palacios, G., Bennett, S., and Peasey, A.: Epidemiological
5
panorama for the agricultural use of wastewater: The Mezquital Valley, Mexico, Salud P ´ublica M ´exico, 36, 3–9, 1994.
Cole, M. L., Valiela, I., Kroeger, K. D., Tomansky, G. L., Cebrian, J., Wigand, C., McKinney, R. A., Grady, S. P., and Carvalho da Silva, M. H.: Assessment of aδ15N isotopic method to indicate anthropogenic eutrophication in aquatic ecosystems, J. Environ. Qual., 33, 124–132, 2004.
10
Conti, M. E. and Cecchetti, G.: Biological monitoring: lichens as bioindicators of air pollution assessment – a review, Environ. Pollut., 114, 471–492, 2001.
Coplen, T. B.: Discontinuance of SMOW and PDB, Nature, 375, p. 285, 1995.
Crayn, D. M., Winter, K., and Smith, J. A. C.: Multiple origins of crassulacean acid metabolism and the epiphytic habit in the Neotropical familyBromeliacea, PNAS, 101(10), 3703–3708,
15
2004.
De Sousa Pereira, M., Heitmann, D., Reifenh ¨auser, W., Ornellas Meire, R., Silva Santos, L., Torres, J. P. M., Malm, O., and K ¨orner, W.: Persistent organic pollutants in atmospheric deposition and biomonitoring withTillandsia usneoides (L.) in an industrialized area in Rio de Janeiro state, southeast Brazil – Part II: PCB and PAH, Chemosphere, 67, 1736–1745,
20
2007.
Downs, T. J., Cifuentes-Garc´ıa, E., and Buffet, I. M.: Risk screening for exposure to groundwater pollution in a wastewater irrigation district of the Mexico City region, Environ. Health Persp, 107(7), 553–561, 1999.
EPA.: Method 6010C. Inductively Coupled Plasma-Atomic Emission Spectrometry, Revision 3,
25
30 pp., 2000.
Figuereido, A. M., Nogueira, C. A., Saiki, M., Milian, F. M., and Domingos, N.: Assessment of atmospheric metallic pollution in the metropolitan region of S ˜ao Paulo, Brazil, employing
Tillandsia usneoidesL. as biomonitor, Environ. Pollut., 145(1), 279–292, 2007.
Friedel, J. K., Langer, T., Siebe, C, and Stahr, K.: Effects of long-term waste water irrigation
30
on soil organic matter, soil microbial biomass and its activities in central Mexico, Biol. Fertil. Soils, 31(5), 414–421, 2000.
ACPD
9, 5809–5852, 2009Distribution and sources of bioaccumulative air
pollutants
A. Zambrano Garc´ıa et al.
Title Page
Abstract Introduction
Conclusions References
Tables Figures
◭ ◮
◭ ◮
Back Close
Full Screen / Esc
Printer-friendly Version
Interactive Discussion
Total contents of cadmium, copper, manganese and zinc in agricultural soils irrigated with wastewater from Hidalgo, Mexico, Revista Internacional de Contaminaci ´on Ambiental, 8(1), 37–46, 1992.
Gerdol, R., Bragazza, L., Marchesini, R., Medici, A., Pedrini, P., Benedetti, S., Bovolenta, A., and Coppi, S.: Use of moss (Tortula muralisHedw.) for monitoring organic and inorganic air
5
pollution in urban and rural sites in Northern Italy, Atmos. Environ., 36, 4069–4075, 2002. Goldstein, A. H. and Shaw, S. L.: Isotopes of volatile organic compounds: an emerging
ap-proach for studying atmospheric budgets and chemistry, Chem. Rev., 103, 5025–5048, 2003.
Gonz ´alez-M ´endez, B., Siebe, C., Fiedel, S., Hern ´andez, J. M., and Ru´ız-Su ´arez, L. G.: N2O
10
emissions from soil irrigated with untreated wastewater in central Mexico, J. Soil Sci. Plant Nutr., 8(3), p. 185, 2008.
Hern ´andez-Silva, G., Flores-Delgadillo, L., Maples-Vermeersch, M., Solorio-Mungu´ıa, J. G., Alcal ´a-Mart´ınez, J. R.: Riesgo de acumulaci ´on de Cd, Pb, Cr y Co en tres series de suelos del DR03, Estado de Hidalgo, M ´exico, Revista Mexicana de Ciencias Geol ´ogicas, II(1), 53–
15
61, 1994.
Hietz, P., and Wanek, W.: Size-dependent variation of carbon and nitrogen isotope abundances in epiphytic bromeliads, Plant Biol., 5, 137–142, 2003.
Hietz, P., Wanek, W., and Popp, M.: Stable isotopic composition of carbon and nitrogen and nitrogen content in vascular epiphytes along an altitudinal transect, Plant, Cell and Environ.,
20
22, 1435–1443, 1999.
Huerta, L., Contreras-Valadez, R., Palacios-Mayorga, S., Miranda, J., and Calva-Vasquez, G.: Total element composition of soils contaminated with wastewater irrigation by combining IBA techniques, Nucl. Instrum. Meth. Phys. Res. B, 189, 158–162, 2002.
Husk, G. J., Weishampel, J. F., and Schlesinger.: Mineral dynamics in Spanish moss,Tillandsia
25
usneoides L. (Bromeliacea), from Central Florida, USA, Sci. Total Environ., 321, 165–172, 2004.
Hwang, H. M., Wade, T. L., and Sericano, J. L.: Concentrations and source characterization of polycyclic aromatic hydrocarbons in pine needles from Korea, Mexico, and United States, Atmos. Environ., 37, 2259–2267, 2003.
30
ACPD
9, 5809–5852, 2009Distribution and sources of bioaccumulative air
pollutants
A. Zambrano Garc´ıa et al.
Title Page
Abstract Introduction
Conclusions References
Tables Figures
◭ ◮
◭ ◮
Back Close
Full Screen / Esc
Printer-friendly Version
Interactive Discussion
Jung, K., Gebauer, G., Gehre, M., Hoffmann, D., Weißflog, L., and Sch ¨urmann, G.: Anthro-pogenic impacts on natural nitrogen isotope variations inPinus sylvestrisstands in an indus-trially polluted area, Environ. Pollut., 97(1–2), 175–181, 1997.
Kelly, S. D., Stein, C., and Jickells, T. D.: Carbon and nitrogen isotopic analysis of atmospheric organic matter, Atmos. Environ., 39, 6007–6011, 2005.
5
Liu, X. Y., Xiao, H. Y., Liu, C. Q., Li, Y. Y., and Xiao, H. W.: Stable carbon and nitrogen isotopes of the mossHaplocladium microphyllumin an urban and a background area (SW China): the role of environmental conditions and atmospheric nitrogen deposition, Atmos. Environ., 42, 5413–5423, 2008.
Lozano, R. and Bernal, J. P.: Characterization of a new set of eight geochemical reference
ma-10
terials for XRF major and trace element analysis, Revista Mexicana de Ciencias Geol ´ogicas, 22(3), 329–344, 2005.
Lucho-Constantino, C. A., ´Alvarez-Su ´arez, M., Beltr ´an-Hern ´andez, R. I., Prieto-Garc´ıa, F., and Poggi-Varaldo, H. M.: A multivariate analysis of the accumulation and fractionation of major and trace elements in agricultural soils in Hidalgo State, Mexico irrigated with raw
wastewa-15
ter, Environ. Int., 31(3), 313–323, 2005.
Malm, O., de Freitas Fonseca, M., Hissnauer Miguel, P., Rodr´ıguez Bastos, W., and Neves Pinto, F.: Use of epiphyte plants as biomonitors to map atmospheric mercury in a gold trade center city. Amazon, Brazil, Sci. Total Environ., 213(1–3), 57–64, 1998.
Mariotti, A.: Natural N-15 abundance measurements and atmospheric nitrogen Standard
cali-20
bration, Nature, 311, 685–687, 1974.
Martin, C. E.: Physiological ecology of theBromeliaceae, Bot. Rev., 60(1), 1–82, 1994. Norra, S., Handley, L. L., Berner, Z., and St ¨uben, D.:13C and15N natural abundances of urban
soils and herbaceous vegetation in Karlsruhe, Germany, Eur. J. Soil Sci., 56(5), 607–620, 2005.
25
Ortega-Larrocea, M. P., Siebe, C., B ´ecard, G., M ´endez, I., Webster, R.: Impact of a century of wastewater irrigation on the abundance of arbuscular mycorrhizal spores in the soil of the Mezquital Valley of Mexico, Appl. Soil Ecol., 16(2), 149–157, 2001.
Pardo, L. H., McNulty, S. G., Bogs, J. L., and Duke, S.: Regional patterns in foliar15N across a gradient of nitrogen deposition in the northeastern US, Environ. Pollut., 149, 293–302,
30
2007.
Phy-ACPD
9, 5809–5852, 2009Distribution and sources of bioaccumulative air
pollutants
A. Zambrano Garc´ıa et al.
Title Page
Abstract Introduction
Conclusions References
Tables Figures
◭ ◮
◭ ◮
Back Close
Full Screen / Esc
Printer-friendly Version
Interactive Discussion
tol., 147(2), 317–326, 2002.
Pichlmayer, F., Sch ¨oner, W., Seibert, P., Stichler, W., Wagenbach, D.: Stable isotope analysis for characterization of pollutants at high elevation alpine sites, Atmos. Environ., 32(23), 4075– 4085, 1998.
Pierce, S., Winter, K., and Griffiths, H.: Carbon isotope ratio and the extent of daily CAM use
5
byBromeliaceae, New Phytol., 156, 75–83, 2002.
Pignata, M. L., Gudi ˜no, G. L., Wannaz, E. D., Pl ´a, R. R., Gonz ´alez, C. M., Carreras, H. A., and Orellana, L.: Atmospheric quality and distribution of heavy metals in Argentina employing
Tillandsia capillarisas a biomonitor, Environ. Pollut., 129, 59–68, 2002.
Pirintsos, S. A., and Loppi, S.: Biomonitoring atmospheric pollution: the challenge of times in
10
environmental policy on air quality, Environ. Pollut., 151(2), 269–271, 2008.
Puente, M. E., and Bashan, Y.: The desert epiphyteTillandsia recurvataharbours the nitrogen-fixing bacteriumPseudomonas stutzeri, Can. J. Bot., 72, 406–408, 1994.
Pyatt, F. B., Grattan, J. P., Lacy, D., Pyatt, A. J., and Seward, M. R. D.: Comparative eff ec-tiveness of Tillandsia usneoides L. and Parmotrema praesorediosum (Nyl.) Hale as
bio-15
indicators of atmospheric pollution in Louisiana (USA), Water, Air, and Soil Pollut., 111, 317– 326, 1999.
Schmitt, A. K., Martin, C. E., and L ¨uttge, U. E.: Gas exchange and water vapor uptake in the atmospheric bromeliadTillandsia recurvataL, Botan. Acta, 102, 80–84, 1989.
Schrimpff, E.: Air pollution patters in two cities of Colombia according to trace substances
20
contents of an epiphyteTillandsia recurvata, Water Air Soil Pollut., 21(1–4), 279–316, 1984. Segala, E. A., Ba ˆesso, B. M., and Domingos, M.: Structural analysis ofTillandsia usneoidesL.
exposed to air pollutants in S ˜ao Paulo city-Brazil, Water Air Soil Pollut., 189, 61–68, 2008. SEMARNAT-INE.: Inventario Nacional de Emisiones de M ´exico, 1999, Secretar´ıa del Medio
Ambiente y Recursos Naturales/Instituto Nacional de Ecolog´ıa, M ´exico, D. F., 409 pp., 2006.
25
Siebe, C.: Acumulaci ´on y disponibilidad de metales pesados en suelos regados con aguas residuales en el distrito de riego 03, Tula, Hidalgo, M ´exico, Revista Internacional de Con-taminaci ´on Ambiental, 10(1), 15–21, 1994.
Siebe, C.: Nutrient inputs to soils and their uptake by alfalfa through long-term irrigation with untreated sewage effluent in Mexico, Soil Use Manage., 14, 119–122, 1998.
30
Siebe, C. and Cifuentes, E.: Environmental impact of wastewater irrigation in central Mexico: an overview, J. Environ. Health Res., 5, 161–173, 1995.
Tula-ACPD
9, 5809–5852, 2009Distribution and sources of bioaccumulative air
pollutants
A. Zambrano Garc´ıa et al.
Title Page
Abstract Introduction
Conclusions References
Tables Figures
◭ ◮
◭ ◮
Back Close
Full Screen / Esc
Printer-friendly Version
Interactive Discussion
Polotitl ´an, Estados de Hidalgo, M ´exico y Quer ´etaro, M ´exico, Revista Mexicana de Ciencias Geol ´ogicas, 14(1), 50–77, 1997.
Skinner, R. A., Ineson, P., Jones, H., Sleep, D., Leith, I. D., and Sheppard, L. J.: Heathland vegetation as a bio-monitor for nitrogen deposition and source attribution usingδ15N values, Atmos. Environ., 40, 498–507, 2006.
5
Sloof, J. E.: Lichens as quantitative biomonitors for atmospheric trace element deposition, using transplants, Atmos. Environ., 29(1), 11–20, 1995.
SMA.: Gesti ´on Ambiental del Aire en el Distrito Federal: Avances y Propuestas, 2000–2006, Secretar´ıa del Medio Ambiente, Gobierno del Distrito Federal, M ´exico, 2006.
Smodiˇs, B., Pignata, M. L., Saiki, M., Cort ´es, E., Bangfa, N., Markert, B., Nyarko, B.,
Arunacha-10
lam, J., Garty, J., Vutchkov, N., Wolterbeek, H. Th., Steinnes, E., Freitas, M. C., Lucaciu, A., and Frontasyeva, M.: Validation and application of plants as biomonitors of trace atmospheric pollution- a co-ordinated effort in 14 countries, J. Atmos. Chem., 49, 3–13, 2004.
Solga, A., Burkhardt, J., Zechmeister, H. G., and Frahm, J. P.: Nitrogen content,15N abun-dance and biomass of the two pleurocarpous mossesPleurozium schreberi (Brid.) Mitt. and
15
Scleropodium purum(Hedw.) Limpr. in relation to atmospheric nitrogen deposition, Environ. Pollut., 134, 465–473, 2005.
Solga, A., Eichert, T., and Frahm, J. P.: Historical alteration in the nitrogen concentration and
15
N natural abundance of mosses in Germany: indication for regionally varying changes in atmospheric nitrogen deposition within the last 140 years, Atmos. Environ., 40, 8044–8055,
20
2006.
St. Clair, S. B., St. Clair, L. L., Mangelson, N. F., and Weber, D. J.: Influence of growth form on the accumulation of airborne copper by lichens, Atmos. Environ., 36, 5637–5644, 2002. Surendra, P. V.: Geochemical and Sr-Nd-Pb isotopic evidence for a combined assimilation and
fraccional crystallisation process for volcanic rocks from the Huichapan caldera, Hidalgo,
25
Mexico, Lithos, 56(2–3), 141–164, 2001.
V ´azquez-Alarc ´on, A., Justin-Cajuste, L., Siebe-Grabach, C., Alc ´antar-Gonz ´alez, G., and de la Isla de Bauer, M. L.: Cadmio, niquel y plomo en agua residual, suelo y cultivos en el Valle del Mezquital, Hidalgo, M ´exico, Agrociencia, 35, 267–274, 2001.
Wannaz, E. D. and Pignata, M. L.: Calibration of four species ofTillandsiaas biomonitors, J.
30
Atmos. Chem., 53(3), 185–209, 2006a.
ACPD
9, 5809–5852, 2009Distribution and sources of bioaccumulative air
pollutants
A. Zambrano Garc´ıa et al.
Title Page
Abstract Introduction
Conclusions References
Tables Figures
◭ ◮
◭ ◮
Back Close
Full Screen / Esc
Printer-friendly Version
Interactive Discussion
Environ., 361, 267–278, 2006b.
Wigand, C., McKinney, R. A., Cole, M. L., Thursby, G. B., and Cummings, J.: Varying stable ni-trogen isotope ratios of different coastal marsh plants and their relationships with wastewater nitrogen and land use in New England, USA, Environ. Monit. Assess., 131, 71–81, 2007. Wolterbeek, H. T.: Biomonitoring of trace element air pollution: principles, possibilities and
5
perspectives, Environ. Pollut., 120, 11–21, 2002.
ACPD
9, 5809–5852, 2009Distribution and sources of bioaccumulative air
pollutants
A. Zambrano Garc´ıa et al.
Title Page
Abstract Introduction
Conclusions References
Tables Figures
◭ ◮
◭ ◮
Back Close
Full Screen / Esc
Printer-friendly Version
Interactive Discussion
Table 1.Target PAH and HPLC analytical parameters.
PAH FLDλex-λ a
em RT
b
QLc (nm) (min) (µg ml−1)
Naphthalene, NAP 275–350 4.29 0.03 Acenaphthylene, ACY 275–350 4.95 0.03 Acenaphthene, ACE 275–350 6.75 0.01 Fluorene, FLN 275–350 7.30 0.01 Phenanthrene, PHE 275–350 8.59 0.01 Anthracene, ANT 275–450 10.45 0.01 Fluoranthene, FLT 275–450 11.94 0.01 Pyrene, PYR 275–410 13.14 0.03 Benzo(a)anthracene, BaA 275–410 17.29 0.03 Chrysene, CHR 275–410 18.47 0.01 Benzo(b)fluoranthene, BbF 275–410 21.32 0.01 Benzo(k)fluoranthene, BbF 275–410 23.02 0.03 Benzo(a)pyrene, BaP 275–410 24.28 0.03 Benzo(g,h,i)perylene, BgP 275–410 27.56 0.01 Indeno(1,2,3-cd)pyrene, IcdP 275–495 29.01 0.03
a
Fluorescence detector excitation (ex) and emission (em) wave length;
b
retention time;
c
ACPD
9, 5809–5852, 2009Distribution and sources of bioaccumulative air
pollutants
A. Zambrano Garc´ıa et al.
Title Page
Abstract Introduction
Conclusions References
Tables Figures
◭ ◮
◭ ◮
Back Close
Full Screen / Esc
Printer-friendly Version
Interactive Discussion
Table 2.Regional summary of elements inT. recurvataat Mezquital Valley (mg/kg).
Element N n Mean Median Range CV (%) S/N p(r) p(log)
Al 150 50 4155 3969 290–11 900 41.1 4.5 >.05 Ba 150 50 38.1 33.2 8.9–131 51.0 4.1
Ca 149 50 12 556 10 190 2883–46 780 55.2 7.3 >.05 Cd 150 50 2.2 1.9 0.9–6.5 42.7 2.1 >.05 Cr 139 49 6.1 4.5 0.8–40.4 96.3 6.1
Cu 150 50 7.0 5.9 2.0–48.4 71.6 3.5 >.05 Fe 149 50 1579 1444 401–4368 41.1 3.5
K 150 50 7568 7559 1398–16,380 33.3 2.5 >.05
Li 150 50 18.1 17.0 6.0–34.0 24.8 3.2 >.05 Mg 150 50 2906 2815 868–6285 33.8 2.7 >.05 Mn 149 50 80.3 75.2 14.2–327.4 39.4 4.3 >.05 Mo 145 47 4.0 4.0 0.3–28.6 76.6 5.5
Na 149 50 3236 3046 424–10,280 57.6 6.1 >.05
Ni 123 50 15.9 14.0 1.6–44.2 60.4 4.5 >.05 P 150 50 501 486 163–1642 45.1 3.8 >.05 Pb 86 31 33.1 28.6 1.4–226 92.0 3.6
Sb 25 9 4.0 2.9 0.2–25.4 124.3 3.6
Sr 148 50 30.5 28.4 1.9–83.2 44.8 2.8 >.05 Ti 150 50 196 177 58.0–532 42.8 2.8
V 150 50 43.4 29.7 6.5–220 86.8 5.5 >.05 Zn 150 50 41.9 36.4 3.7–192 57.0 4.0
ACPD
9, 5809–5852, 2009Distribution and sources of bioaccumulative air
pollutants
A. Zambrano Garc´ıa et al.
Title Page
Abstract Introduction
Conclusions References
Tables Figures
◭ ◮
◭ ◮
Back Close
Full Screen / Esc
Printer-friendly Version
Interactive Discussion
Table 3. Regional mean element concentration (mg kg−1
) inT. recurvata at Mezquital Valley (MV) andTillandsiafrom other countries (OC). Values in parentheses are the MV:OC ratio.
Element MV Argentinaa Argentinab Brazilc Colombiad Colombiae USf
Al 4155 1112 (3.7)
Ba 38.1 36.8 (1)
Ca 12 556 3312 (3.8) 4160 (3.0)
Cd 2.2 0.4 (5.3) 0.82 (2.6)
Cr 6.1 2.2 (2.8)
Cu 7.0 0.9 (7.8) 0.9 (7.0) 19.3 (0.4) 52.7 (0.1) 30.5 (0.2) 7.1 (1.0) Fe 1579 223 (7.1) 257 (6.1) 1144 (1.4) 575 (2.7)
K 7568 5890 (1.3) 2550 (3.0)
Mg 2906 2025 (1.4) 414 (7.0)
Mn 80.3 22.6 (3.6) 22.3 (3.6) 174 (0.5) 52.8 (1.5) Na 3,236 1923 (1.7)
Ni 15.9 0.2 (79.4) 0.2 (79.4) 11.9 (1.3) 52.8 (0.3) Pb 33.1 0.5 (66.2) 0.5 (66.2) 40.6 (0.8) 26.3 (1.3)
Sb 4.0 0.5 (8.0)
V 43.4 1.0 (43.4) 1.1 (39.5) 2.7 (16.1)
Zn 41.9 4.0 (10.5) 3.8 (11.0) 111 (0.4) 119 (0.4) 379 (0.1) 73.5 (0.6)
a
Wannaz et al. (2006a),T. capillaris;
b
Wannaz et al. (2006b),T. permutata;
c
Figuereido et al. (2007),T. usneoides, average value for the two-months transplanting period presenting the maximum concentration, excluding the control site,
d,e
Schrimpff(1984), Cali and Medell´ın cities, respectively;
f