A
r
ti
c
le
*e-mail: [email protected]
The Ti-Influence on the Tourmaline Color
Warde A. da Fonseca-Zang,*,a Joachim W. Zanga and Wolfgang Hofmeisterb
aÁrea de Química, Centro Federal de Educação Tecnológica de Goiás, Rua 75, n. 46, Setor Central,
74055-110 Goiânia-GO, Brazil
bGeomaterialwissenschaften, Johannes Gutenberg-Universität Mainz, 55099 Mainz, Germany
Titânio em turmalinas pretas foi analisado por espectrofotometria entre 12500 e 27000 cm-1
(800-370 nm) em um microscópio MPV-5P, Leitz (Alemanha), e analisado quimicamente em uma micro-sonda eletrônica Camebax Microbeam, Cameca (France) (WDS-mode). Quatorze turmalinas orientadas com faces paralelas ao eixo trigonal, cortadas e polidas até espessuras finas mostraram, em espectros polarizados, duas bandas largas de absorbância a aproximadamente 14000 cm-1 (715 nm) e 24000 cm-1 (417 nm). Medidas de espessura das amostras foram usadas no
cálculo de coeficientes de absorção α (cm-1). Para a banda em torno de 24000 cm-1 (417 nm), foi
observada uma correlação linear entre αe a concentração em massa de TiO2 (%). Outra regressão foi observada entre αe o produto da concentração em massa de TiO2 (%) e FeO (%). Cátions localizados em grupos de octaedros Y e Z conectados através dos seus lados podem contribuir para as transferências de carga Ti3+-Ti4+, Fe2+-Ti4+, Ti3+-Ti4+-Fe3+.
Titanium was examined in different black tourmalines by spectrophotometric analyses in the region between 12500 and 27000 cm-1 (800-370 nm) using a microscope spectrophotometer
MPV-5P, Leitz (Germany), and chemically analyzed on an electron microprobe Camebax Microbeam, Cameca (France) in WDS Mode. Fourteen tourmaline samples with their face oriented parallel to the principal axis, cut and polished down to thin sections, showed polarized spectra of two broad absorption bands at approximately 14000 cm-1 (715 nm) and 24000 cm-1 (417 nm). Precision
thickness measurements were used to calculate the absorption coefficientsα. For the absorption around 24000 cm-1, a linear correlation was observed between αand the TiO
2 content (mass %).
Another linear regression was observed betweenαand the product ofTiO2 and FeO (%) contents. Cations located in the Y- and Z-octahedrons of the structure that are connected over edges might contribute to intervalence charge transfer transitions (IVCT) between Ti3+-Ti4+, Fe2+-Ti4+ and
Ti3+-Ti4+-Fe3+.
Keywords: titanium, IVCT effect, tourmaline
Introduction
Standard electron microprobe analysis can determine most of the significant elements in tourmalines, except Li, O, H and B. The general formula of the tourmaline group can be described as indicated in the general formula (1):
[9]X [6]Y 3
[6]Z
6 (O, OH)3 (OH, F) ( [3]BO
3)3 [ [4]Si
6O18] (1),
where: X = Na, Ca, K, Bi, vacancies and others; Y = Al, Li, Mg, FeII, FeIII, MnII, MnIII, Cr, V, Cu and others; Z =
Al, FeIII, Cr, V, Mg, FeII, TiIV and others; B = B; Si = Si,
Al and B.
Substitutions in tourmaline occur mainly at the octahedral Y and Z-sites, where Al is replaced by TM cations, mainly FeII, FeIII, MnII, MnIII, Cr, V, Cu and TiIV.
The cation TiIV is located mainly in the octahedral sites.1,2
The most common tourmaline end-member components are schorl, dravite, elbaite, buergerite, uvite, liddicoatite, olenite, chromdravite, feruvite, hidroxiferuvite and povondraite. At the nine-folded coordinated X-site in natural species, vacancies up to 0.75 per formula unit (pfu) have been described.3,4 In synthesized tourmalines
the X-site has been described with up to 1.0 X-vacancy pfu.5,6 The tetrahedral Si-site in the trigonal Si
assumed to be mainly occupied by Si and Al, if the number of Si is under 6.0 pfu. A statistical data analysis from 785 tourmalines shows distribution with a maximum of 5.95 (2) Si pfu.2 Chemical data from 256 complete analyses of
natural tourmalines show a maximum distribution at 2.993 (0.054) Bpfu.1
The color and pleochroism in tourmalines are caused by the transition metal (TM) ions in the Y- and Z- octahedra of the crystal structure, either as major constituents or trace amounts.7 When linear polarized light is transmitted
through a trigonal tourmaline sample, cut parallel to the three fold c axis, different spectral absorption profiles may be expected, denoted as perpendicular to c, ω (E⊥c),
and as parallel to c, ε (E||c). In general the common cause of color is the light absorption in discrete near ultraviolet visible and near-infrared regions through electronic processes, including crystal field transitions within the individual TM cations, intervalence charge transfer transitions (IVCT) between adjacent TM ions or transitions involving TM ions and surrounding anions. Intervalence charge transfer transitions (IVCT) are photochemical oxidation-reduction effects observed in the ultraviolet region, leading to very intense broad absorption bands with absorption coefficients α= 100-10000 cm-1.
A shift of these absorption bands to lower energy regions can be expected when neighboring ions exist in different oxidation states in a crystal structure.
In the tourmaline structure, oxygen atoms frequently occur at the vertices of distorted octahedra and TM cation-oxygen distances are not identical within a coordination site. The oxygen ions as coordinating ligands in the octahedra might be substituted by OH or F . Lower symmetry
octahedral environments formed by either distortion of the coordination site or different distribution of the ligands in the octahedra lead to further resolution of the 3d orbital energy levels and cause additional electronic configurations of different energies and symmetry. Schoenfliess symbols are assigned to spectroscopic terms, regular octahedrons belong to the point group Oh, while tetragonally distorted and trigonally distorted octahedra are represented by D4h and C3v, respectively. In each configuration, the Z axis is the tetrahedral axis and corresponds to the axis of the elongation or compression of the octahedron.
Curve-resolved spectra yielded two sets of paired bands.8 The first set at 14500 cm-1 and 9500 cm-1 is assigned
to FeII in the Z octahedral site. The second set of bands
at 13200 cm-1 and 7900 cm-1 is attributed to FeII in the Y
octahedral site. In some black and pink tourmaline crystals, broad and high absorption bands located at 18400 cm-1 and
22700 cm-1 and at 19200 cm-1 have been associated with
MnIII ions.9 The band at 18900 cm-1 is assigned to FeII-FeIII
intervalence charge transfer effects within the Y- or Z-sites and between adjacent Y- and Z-sites.10
An absorption band at 24100 cm-1 has been explained
with FeII-TiIV interactions for green and brown tourmalines
with high Fe contents.11,12 On Earth, the most stable
oxidation states of Ti, Fe and Mn in minerals occurring in near-surface environment are TiIV, MnII, MnIII, MnIV,
FeII and FeIII. Titanium in oxidation state TiIII is observed
in lunar minerals and glass phases as well as in synthetic materials.7
Spectrophotometric measurements within the energy region between 12500 and 27000 cm-1 (800- 370 nm) were
made in this work for evaluating the influence of titanium on the tourmaline color.
Experimental
For this work 14 samples of macroscopic black tourmalines from the Brazilian State of Minas Gerais and from Namibia were specially prepared as oriented section cuts, involving orientation of the crystals on a polariscope with an adapted conoscope (Schneider, Germany). The section samples were cut mainly parallel to the crystallographic c-axis using a diamond steel disc (Eigner, Germany) and polished into thin-sections of millimeters or micrometer thickness, using a copper disc (Eigner, Germany) to reach a sufficient energy transmission to measure the absorption spectra. The sections of the tourmalines were additionally polished with a diamond polishing powder paste on both sides (Saint Petersburg, Russia). The thickness of the sections was measured with a micrometer screw.
The chemical analyses of the 14 samples were carried out on a Cameca Camebax electron microprobe in WDS mode (France). The excitation voltage was 15 kV and the beam current 20 nA; the beam was defocused to 10µm scan. The calibration standards were Si, K - orthoclase, Al - corundum, V, Cu - pure elements standards, Cr - chromite, Fe - hematite, Mn and Ti - alloy of Mn and Ti, Ca - wollastonite, Na - albite and F - lithium fluorite. The data was corrected with a modified ZAF procedure (PAP). The contents of B2O3, Li2O and H2O were calculated on the basis of 31 anions O2−, OH− and F− (results in Table 1).
The microscope Leitz MPV-5P is restricted to spectral measurements in this energy region due to its glass optics. About 100 scans were averaged for every measurement. The spectra of most of the samples were taken in one point. The background calibration for the spectral measurements was done with a colorless tourmaline sample 28Nig (chemical composition in Table 1), which had been prepared in the same way as the other samples.
Two spectral profiles may be distinguished in trigonal tourmalines, ω (E⊥c) and ε (E||c), where E represents the
direction of polarization of the electric field vector of the incident light on the plane of the section. Sections cut parallel to the c axis (parallel sections) show optical interference features characteristic of uniaxial crystals and those cut perpendicular to c (called 001 sections) show a centered uniaxial cross (axial spectrum).
On the abscissa of the spectra the energy is represented as wavenumber (cm-1). On the ordinate the calculated
values of the absorption coefficientα are understood as inequation (1),
α= log(I0/I)/d (1)
using the sample thickness d [cm] beside the intensities of the light before (I0)and after passing through the sample (I) for the calculation.7
Curve fitting of the spectra
The spectroscopic data from the Leitz spectrophotometer was stored as ASCII files. Microcal Origin 6.0 software was applied for plotting and fitting the spectral curves. After the background correction with the absorption spectra of the colorless tourmaline sample 28Nig, each spectrum was normalized to its absorption coefficients α. The absorption curves were fitted on the complete measuring range for the underlying multiple Gaussian absorption peaks.
Results and Discussion
The chemical composition of the analyzed samples (this work) is shown in Table 1, classified after the content of TiO2 (mass %).
The chemical results presented in Table 1 indicate that there are different species of the tourmaline solid-solution-series represented, ranging from Al- and Li-rich elbaite to Fe-rich schorl. The electron microprobe analyses further point to contents of transition metals Fe, Mn and Ti, assumed to be located mainly in the octahedral Y and Z sites. All these samples were black or dark colored. The color described in Table 1 is observed only in thin sections. The data shown in Table 1 is classified after increasing the TiO2 mass % content.
Table 1. Chemical composition of the tourmaline samples classified after increasing TiO2 (mass %) contents. Electron microprobe analyses, B2O3, Li2O
and H2O have been calculated stoichiometrically. Total iron content was calculated as FeO. V2O3 and Cr2O3 were analyzed but no contents above detection
limits were observed
No. Sample/color SiO2 TiO2 B2O3 Al2O3 FeO MnO MgO CaO Na2O K2O Li2O F H2O+ O=F SUM
1 28Nig-colorless 38.18 0.00 11.10 42.62 0.18 0.47 0.00 0.39 1.85 0.02 1.70 1.50 2.63 0.63 100.00
2 48MG-green 38.07 0.01 10.84 38.36 1.99 2.36 0.04 0.38 2.25 0.00 2.60 1.98 1.94 0.83 100.00
3 26MG-green 36.50 0.02 11.13 40.15 1.57 0.52 0.00 0.39 2.10 0.05 2.60 1.04 4.37 0.44 100.00
4 55Na-green 36.66 0.03 10.65 36.84 7.11 0.63 0.09 0.15 2.42 0.02 2.00 1.26 2.67 0.53 100.00
5 SD4-light green-blue 38.02 0.03 10.55 36.91 7.67 0.37 0.08 0.06 2.71 0.05 1.06 1.41 1.68 0.59 100.00
6 SD5-light green-blue 37.24 0.03 10.55 36.79 8.36 0.58 0.04 0.07 2.57 0.03 0.90 1.46 2.01 0.62 100.00
7 SD12-green 37.41 0.04 10.90 42.23 1.25 0.89 0.25 0.88 2.05 0.01 1.19 0.90 2.38 0.38 100.00
8 SD3-green 38.45 0.04 10.78 38.91 3.88 0.65 0.25 0.60 2.38 0.03 1.42 0.77 2.16 0.32 100.00
9 SD7-light green 37.61 0.07 10.55 36.45 8.61 0.12 0.31 0.07 2.58 0.03 0.95 0.60 2.30 0.25 100.00
10 SD10-light green core 38.06 0.12 10.67 37.39 6.27 0.56 0.46 0.14 2.53 0.02 1.14 0.62 2.29 0.26 100.00
11 SD14-light brown 38.55 0.31 10.65 37.52 5.60 0.56 0.56 0.15 2.59 0.00 1.17 1.07 1.74 0.45 100.00
12 SD13-light brown 38.16 0.33 10.65 37.19 5.98 0.71 0.30 0.15 2.68 0.03 1.22 1.21 1.88 0.51 100.00
13 SD11-dark brown 38.27 0.44 10.62 37.39 6.13 0.67 0.37 0.12 2.64 0.03 1.05 0.86 1.75 0.36 100.00
14 SD6-dark brown 37.93 0.57 10.62 37.68 6.07 0.56 0.70 0.12 2.54 0.01 0.87 0.86 1.83 0.36 100.00
15 SD8-dark brown 37.88 0.70 10.50 35.89 8.13 0.05 1.48 0.05 2.53 0.02 0.59 0.98 1.57 0.41 100.00
Optical properties
The optical spectra are described taking into consideration the crystallographic direction of certain absorbed wavelengths under different intensities of the absorption coefficient (α). In this work both polarized spectra ω (E⊥c) and ε (E||c) were taken for most of
the samples, except for the thin section samples 55Na green,SD11, SD13 and SD14, prepared for the ω(E⊥c)
spectrum.
In Figures 1A and 1B the polarized spectra (region 12500-27000 cm-1) for fourteen samples are plotted. Two
main absorption bands around 14000 cm-1 (714 nm) and
24000 cm-1 (417 nm) were observed for all samples. For
both spectra the intensity of the 24000 cm-1 band, expressed
as absorption coefficient α, increases gradually with the TiO2 contents for the samples and the strongest absorption was observed in the dark brown sample SD8 with the highest content of 0.70% TiO2.
The spectra of the samples in Figures 1A and 1B show different absorption intensities of the two bands around 14000 cm-1 and 24000 cm-1. In Figure 1A, for the brown
samples SD6, SD8, SD11, SD13 and SD14, a strong dominance of the intensity at 24000 cm-1 was observed; its
values exceeded those at 14000 cm-1. In Figure 1B, SD6 and
SD8 exhibit brown color for E||c and a strong dominance of the intensity at 24000 cm-1 was also observed. For the
other samples, the intensities at 24000 cm-1 were similar
or smaller than those at 14000 cm-1,causing a green color
impression.
The spectra in Figure 1A show, for some samples, an additional absorption band around 18000 cm-1. Absorption
bands located at 18400 cm-1 and 22700 cm-1 and at
19200 cm-1 are associated with MnIII ions.9 At 18900 cm-1
they have been assigned also to FeII-FeIII intervalence
charge transfer effects within and between the Y- or Z-sites.10 A pink tourmaline of Minas Gerais showed a
line around 19500 m-1, which after a detailed analysis was
also attributed to MnIII.14 The Tanabe-Sugano diagram
shows, for d5 quartet or doublet excited states for MnII in
non spin allowed transitions, two large, weak absorption bands around ν1=17000 cm-1, attributed to 6A
1g→ 4T
1g,
and ν2=22500 cm-1 to 6A 1g→
4T
2g, and a very thin peak
at ν3=24.088 cm-1, attributed to 6A 1g →
4A 1g,
4T Eg.
7 The
weak absorption bands at 22500 cm-1 and at 24088 cm-1,
associated to MnII, might be covered by the high absorption
around 24000 cm-1.
The crystallographic absorption dependence for the spectraω(E⊥c) and ε (E||c) is possibly caused by the lower
symmetry of the octahedral sites. For the Y octahedron a coordination of 5+1 anions is expected, i.e. five atoms show similar Me-O distance and one is significantly different, where the Y-O(3) distance is elongated and O(3) may be OH or O. Since the ligand O(3) is coordinated by the Y and Z sites and an elongation of Z tetrahedral axis of the sites results in the lower symmetry D4h, the occurrence of TM cations in the Y-sites could lead to crystallographic dependencies of absorption spectra in polarized light.
The band around 14000 cm-1
In crystal field spectra of most FeII-bearing minerals,
where the FeII is situated in distorted octahedra, two or
more separated peaks are generally observed, due to the resolution of the 5T
2g and 5E
g crystal field states into
additional levels. The splitting of upper-level eg orbital might be obtained from the spectra. Two sets of paired bands could be expected for FeII in the Y and Z sites of
the tourmaline. One set is located at 14500 cm-1 and 9500
cm-1 for FeII in the Z-site (point group C
1; mean distance
Figure 1. (A) Polarized optical absorption spectra E⊥c of fourteen
tourmaline samples, showing a tendency of correlation of absorption coefficients around 24000 cm-1 with corresponding TiO
2 contents. (B)
Polarized optical absorption spectra E//c of fourteen tourmaline samples, showing a tendency of correlation between absorption coefficients around 24000 cm-1 with corresponding TiO
Al-O = 192.9 pm) and the second set of bands is located at 13200 cm-1 and 7900 cm-1, which is attributed to FeII in the
Y-site (point group Cm; mean distance Fe-O = 202.5 pm).8
Results of this work within the energy region between 12500 and 27000 cm-1 show an absorption band at 14000
cm-1 for the analyzed samples of the two spectrum profiles
distinguished in trigonal tourmaline ω (E⊥c) andε (E||c).
Spin-allowed crystal field (CF) transitions within individual cations FeII located mainly in theY-site should contribute
to absorption in lower regions than those with FeII located
in the Z-site. The observed band around 14000 cm-1 is
located between the expected positions at 13200 cm-1 for
the Y-site and at 14500 cm-1 for the Z-site.8 FeII ions may be
located in two different octahedral sites of the tourmaline structure. Intensification mechanisms assigned to charge transfer between FeII-FeIII in Y- and Z-sites might be
considered as well.
The band around 24000 cm-1
The observed broad band at 24000 cm-1 was investigated
in more detail in this work, since this absorption has been related earlier to the FeII-TiIV IVCT interactions located in
edge-shared Y- and Z-sites.11,12
Within the (001) plane, the Y and Z-sites are edge connected over the common O(3)-O(6) octahedral border. The Y-sites form a brucite like unit of O(1)-O(2) edge-shared octahedra.1,2 The observed intensity for the broad absorption
band at around 24000 cm-1 was initially associated in this
work with the TiO2 contents of the analyzed samples (see Table 2 and Figure 1). Considering that the polarized spectrum ω (E⊥c) might result from interactions of the
electric vector of the incident light within the (001) plane, electron transfer transitions might occur between adjacent cations of titanium with different oxidation states in the octahedral sites, leading to an intense absorption band in spectrum.13
Revisions of single crystal structure data from 23 tourmalines show a tendency of increasing Y-Y distances between the cations in the Y octahedral cluster, compared to Y-Z distances of the edge connected octahedral sites for the solid solution series from elbaite (Al tourmaline) to dravite-uvite (Mg tourmaline).2 The chemical data of the
analyzed samples (Table 1) show species of elbaite and elbaite-schorl, and consequently interactions between Y cations are more favorable and may contribute to lower charge transfer energies than those between cations in Y and Z-sites.
The bandwidth at 24000 cm-1 in the spectra ω (E⊥c)
is approximately two times larger than that of the band at 14000 cm-1. Large widths at half peak-height are considered
to be a diagnostic property of IVCT transitionsbetween two ions in adjacent edged shared octahedra.7
Further statistical analyses using chemical and spectro-photometric data
The cations in Y and Z sites may influence the observed absorption values (α) at 24000 cm-1. The chemical data
for the fourteen samples and the absorption coefficients in Table 1 were used for the correlation in Figure 2.
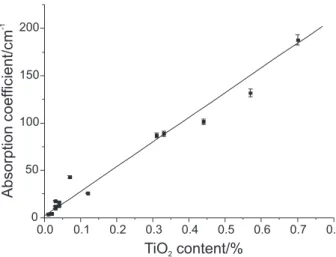
A correlation of the contents of TiO2 (in mass percent) with the absorption coefficient is shown in Figure 2. A correlation between the absorption coefficient and the
Figure 2. Correlation between TiO2 content (mass%) and the observed absorption coefficient α (cm-1) for E⊥c at around 24000 cm-1 for fourteen
tourmaline samples.
Linear regression: Y =1.76 (0.90) + 260.84 (25.08)X with R=0.9487 (0.0001).
Figure 3. Correlation between the product of FeO and TiO2 contents (mass%) and the observed absorption coefficient α (cm-1) at around
24000 cm-1 for the tourmaline samples.
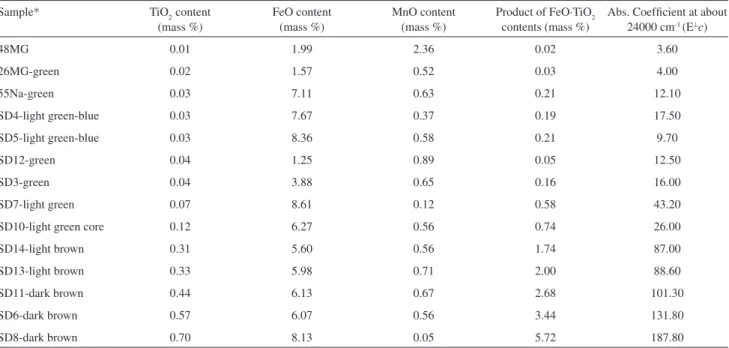
Table 2. Values of the absorbance coefficients at about 24000 cm-1 found in polarized spectra E⊥cwith the contents (mass%) of FeO, TiO
2, MnO. Values
assigned after increasing TiO2 contents
Sample* TiO2 content
(mass %)
FeO content (mass %)
MnO content (mass %)
Product of FeO·TiO2 contents (mass %)
Abs. Coefficient at about 24000 cm-1 (E⊥c)
48MG 0.01 1.99 2.36 0.02 3.60
26MG-green 0.02 1.57 0.52 0.03 4.00
55Na-green 0.03 7.11 0.63 0.21 12.10
SD4-light green-blue 0.03 7.67 0.37 0.19 17.50
SD5-light green-blue 0.03 8.36 0.58 0.21 9.70
SD12-green 0.04 1.25 0.89 0.05 12.50
SD3-green 0.04 3.88 0.65 0.16 16.00
SD7-light green 0.07 8.61 0.12 0.58 43.20
SD10-light green core 0.12 6.27 0.56 0.74 26.00
SD14-light brown 0.31 5.60 0.56 1.74 87.00
SD13-light brown 0.33 5.98 0.71 2.00 88.60
SD11-dark brown 0.44 6.13 0.67 2.68 101.30
SD6-dark brown 0.57 6.07 0.56 3.44 131.80
SD8-dark brown 0.70 8.13 0.05 5.72 187.80
product of the oxide content (%) of the probable IVCT between Fe and Ti is presented in Figure 3. The data of the intensities at around 24000 cm-1 used in the correlations in
Figure 2 and Figure 3 are shown in Table 2.
The intensity of spin-allowed IVCT transitions depends more on the populations of the cation pairs in adjacent sites rather than on concentrations of individual cations, considering the error in the absorption intensities (3%).15
The correlation illustrated in Figure 2 with R=0.9487 (0.0001) shows a direct influence of the content of TiO2 in mass percent on the intensity of the band around 24000 cm-1. The linear function (Figure 2) Y =1.76 (0.90) +
260.84 (25.08)Xleads to very weak absorption for a null concentration of TiO2.
No direct correlations between the content of FeO alone (without TiO2)and the absorption coefficient were found. After this data a possible indication for two groups of green and green-brown tourmalines was observed.
A similar regression was observed in Figure 3 as Y=3.35 (0.79) + 39.72 (4.49)X with R=0.9311 (0.0001), and that demonstrates an influence of Ti and Fe, represented through TiO2 x FeO (mass %) contents, on the intensity of the band at 24000 cm-1. These results point to possible interactions in
the Y and Z octahedral sites between Ti-cations as TiIII-TiIV
or between Fe and Ti cations as FeII-TiIV or TiIII-TiIV-FeIII.
To check a possible influence of Mn on the band at 24000 cm-1, a similar correlation was applied. A relation
with R=0.62 (0.02) was found for the product of the contents on TiO2·FeO·MnO (%).
Conclusions
Two broad absorption maxima around 14000 cm-1
(714 nm) and 24000 cm-1 (416 nm) were observed in all
analyzed tourmaline samples. Brown color is observed when the absorption at about 24000 cm-1 becomes much
more intense than the other band at around 14000 cm-1.
Blue colors are the result of only one principal absorption band at around 14000 cm-1. Green color is associated with
both absorption bands.
Titanium contents would compromise the blue and green colors due to the intensification of the absorption band at around 24000 cm-1.
Statistical analyses point to the direct correlation of the TiO2 contents with the absorption coefficients at 24000 cm-1 (regression coefficient R=0.9487
(0.0001)). Another regression shows that the product of the TiO 2 and FeO contents influences the absorption coefficients of this band with R=0.9311 (0.0001). No direct correlation between MnO contents and the absorption coefficient at 24000 cm-1 was observed. The
Ti and Fe cations are assigned to Y-octahedral clusters (Y3). The Z-octahedrons (Z6) may be occupied by TiIV
ions and also Fe cations in minor contents. Both edge connected octahedral sites (Y and Z) could contribute to the electronic transitions between Ti cations alone or between Ti and Fe. The IVCT-transitions might be described as TiIII-TiIV and FeII-TiIV or TiIII-TiIV-FeIII,
Acknowledgments
The authors are indebted to the National Councel of Technological and Scientific Developmnet, CNPq (Conselho Nacional de Desenvolvimento Científico e Tecnológico).
Our special thanks are dedicated to the referees of this article, who contributed with valuable suggestions to improve the quality of the present work.
References
1. Zang, J. W.; PhD Thesis, Fachbereich Geowissenschaften, Universität Mainz, Germany, 1994.
2. da Fons eca, W. A . B . ; PhD Thesis, Fachbereich Geowissenschaften, Universität Mainz, Germany, 1997. 3. Macdonald, D. J.; Hawthorne, F. C.; Grice, J. D.; Am. Mineral.
1993, 78, 1299.
4. Selvay, J. B.; Novak, M.; Hawthorne, F. C.; Černý, P.; Ottoloni, L.; Kyser, T. K.; Am. Mineral.1998, 83, 896.
5. Kahlenberg, V.; Veličkov, B.; Eur. J. Mineral.2000, 12, 947. 6. Wodara, U.; Schreyer, W.; Eur. J. Mineral. 2001, 13, 521. 7. Burns, G. R.; Mineralogical Applications of Crystal Field
Theory, 2nd ed., University Press: Cambridge, 1993.
8. Faye, G. H.; Manning; P. G.; Gosselin, J. R.; Tremblay, R. J.;
Can. Mineral.1974, 12, 370.
9. Manning, P. G.; Can.Mineral. 1973, 11, 971.
10. Faye, G. H.; Manning, P. G.; Nickel, E. H.; Am. Mineral.1968,
53, 1174.
11. Rossman, G. R.; Mattson, S. M.; Am. Mineral.1986, 71, 599. 12. Mattson, S. M.; Rossman, G. R.; Phys. Chem. Miner.1988, 16,
78.
13. Loeffer, B. M; Burns, R. G.; Tossel, J. A.; Geochim. Cosmochim.
Acta Suppl.1975, 6, 2663.
14. Camargo, M. B.; Isotani, S.; Am. Mineral. 1988, 73, 172. 15. Isotani, S.; Watari, K.; Mizukami, A.; Bonventi Junior, W.; Ito,
A. S.; Phys. B2006, 391, 322.