Raman, infrared and near-infrared spectroscopic characterization
of the herderite–hydroxylherderite mineral series
Ray L. Frost
a,⇑, Ricardo Scholz
b, Andrés López
a, Yunfei Xi
a, Camila de Siqueira Queiroz
b,
Fernanda M. Belotti
c, Mauro Cândido Filho
daSchool of Chemistry, Physics and Mechanical Engineering, Science and Engineering Faculty, Queensland University of Technology, GPO Box 2434, Brisbane, Queensland 4001, Australia bGeology Department, School of Mines, Federal University of Ouro Preto, Campus Morro do Cruzeiro, Ouro Preto, MG 35400-00, Brazil
cFederal University of Itajubá, Campus Itabira, Itabira, MG, Brazil
dMining Engineering Department, School of Mines, Federal University of Ouro Preto, Campus Morro do Cruzeiro, Ouro Preto, MG 35400-00, Brazil
h i g h l i g h t s
We have studied herderite–
hydroxylherderite series from Brazil.
CaBePO4(F,OH) was investigated by
an electron microprobe.
The minerals occur as secondary
products in granitic pegmatites.
We studied the minerals using
vibrational spectroscopy.
Hydrogen bond distances were
calculated.
g r a p h i c a l
a b s t r a c t
a r t i c l e
i n f o
Article history:
Received 10 June 2013
Received in revised form 27 August 2013 Accepted 2 September 2013
Available online 13 September 2013
Keywords:
Raman spectroscopy Herderite
Hydroxylherderite Phosphate Beryllium Pegmatite
a b s t r a c t
Natural single-crystal specimens of the herderite–hydroxylherderite series from Brazil, with general for-mula CaBePO4(F,OH), were investigated by electron microprobe, Raman, infrared and near-infrared
spec-troscopies. The minerals occur as secondary products in granitic pegmatites. Herderite and hydroxylherderite minerals show extensive solid solution formation. The Raman spectra of hydroxylher-derite are characterized by bands at around 985 and 998 cm1, assigned tom
1symmetric stretching mode
of the HOPO3
3 and PO34units. Raman bands at around 1085, 1128 and 1138 cm1are attributed to both the HOP and PO antisymmetric stretching vibrations. The set of Raman bands observed at 563, 568, 577, 598, 616 and 633 cm1are assigned to them
4out of plane bending modes of the PO4and H2PO4units. The
OH Raman stretching vibrations of hydroxylherderite were observed ranging from 3626 cm1 to
3609 cm1. The infrared stretching vibrations of hydroxylherderites were observed between
3606 cm1and 3599 cm1. By using a Libowitzky type function, hydrogen bond distances based upon
the OH stretching bands were calculated. Characteristic NIR bands at around 6961 and 7054 cm1were
assigned to the first overtone of the fundamental, whilst NIR bands at 10,194 and 10,329 cm1are
assigned to the second overtone of the fundamental OH stretching vibration. Insight into the structure of the herderite–hydroxylherderite series is assessed by vibrational spectroscopy.
Ó2013 Elsevier B.V. All rights reserved.
Introduction
Beryllium is a typical chemical element found in granitic pegmatites, especially in the structure of silicates such as beryl [Be3Al2(Si6O18)], phenakite (Be2SiO4), euclase [(BeAl(SiO4)(OH)]
1386-1425/$ - see front matterÓ2013 Elsevier B.V. All rights reserved. http://dx.doi.org/10.1016/j.saa.2013.09.021
⇑Corresponding author. Tel.: +61 7 3138 2407; fax: +61 7 3138 1804.
E-mail address:[email protected](R.L. Frost).
Contents lists available atScienceDirect
Spectrochimica Acta Part A: Molecular and
Biomolecular Spectroscopy
and bertrandite [Be4(Si2O7)(OH)2], and the oxide chrysoberyl
(BeAl2O4). Beryllium metal is an important element in industry
with different applications in metallurgy especially in the produc-tion of copper, aluminum and magnesium alloys; however, the use is limited due to the high price and toxicity. Beryllium has also importance for the defence and aerospace industry, due to its stiff-ness, light weight and dimensional stability over a wide tempera-ture range. Despite the importance for industry, the major field of use of beryllium minerals is in the gemstones and jewelry market, mainly, emerald and aquamarine[1].
Be phosphates are relatively rare in nature and are related to a range of temperature and pressure during the pegmatite evolution
[2], occurring from the magmatic process[3,4]to the hydrothermal and supergene[5,6]. Cˇerny´[7]and Cˇerná et al.[8]describes beryl-lium phosphates as secondary product of late alteration of beryl. The most common Be phosphates are hydroxylherderite, morae-site, beryllonite and the members of the roscherite group[7–10]. Herderite and hydroxylherderite are two rare gemstones and also shows importance in the mineral collectors market [11–13]. Herderite was first described from samples associated with the Sn-bearing pegmatites at Ehrenfriedersdorf in the Erzgebirge of Germany [14], and hydroxylherderite was first described from the mineral District of Paris, Maine, USA by Penfield[15]as hy-dro-herderite. Later, Palache et al.[16]were responsible to
estab-lish the herderite–hydroxylherderite series. Byrappa and
Pushcharovsky [17] have observed the structural similarity be-tween hydroxylherderite and datolite. Chrystallographic studies were carried out by Lager and Gibbs[18]in hydroxylherderite from Golconda pegmatite, in Brazil and Harlow and Hawthorn[19]have solved the crystal structure of herderite from Mogok, Myanmar.
According to Lager and Gibbs [18], hydroxylherderite crystal-lizes in the monoclinic system, P21/a space group, with
a= 9.789(2) Å, b= 7.661(1) Å, c= 4.804(1) Å and b= 90.02(1)°. Hydroxylherderite consists of sheets of corner-sharing PO4 and
BeO3OH tetrahedra linked along thecaxis by sheets of edge-sharing
Ca-containing polyhedral. Each tetrahedral sheet contains alternat-ing PO4and BeO3OH polyhedral which form a network of four- and
eight-membered centro-symetric rings extending parallel to (00 1). Herderite, as described by Harlow and Hawthorn[19] crys-tallizes in monoclinic crystal system, space group P21/a, with a= 9.7446(4) Å, b= 7.6769(3) Å, c= 4.7633(2) Å, b= 90.667(1)°, V= 356.31(4) Å3, and Z= 4. The authors cited that as effect of
increasing of herderite content, generally occurs a contraction of the structure, with a decrease ina,c, andVand the increase inb. The relation FAOH in herderite and hydroxylherderite were also
studied in different ways. In a systematic optical and chemical characterization, Leavens et al.[20]have described the dependence of the refractive index with the F/OH ratios and have established the increase of refractive index to the decrease of F content.
In the infrared spectroscopic characterization of the amblygo-nite–montebrasite mineral series, Fransolet and Tarte[21] estab-lished a correlation between OH wavenumbers (
m
OHin the regionbetween 3400–3350 cm1 and d
OH in the 840–800 cm1 region)
and the fluorine content. With the application of Raman spectros-copy, Rondeau et al.[22]have observed correlation between the F content with the position of 3 characteristic Raman peaks and the full width at medium height (FWMH) of the peak around 3370 cm1.
Farmer [23] divided the vibrational spectra of phosphates according to the presence, or absence of water and hydroxyl units in the minerals. In aqueous systems, Raman spectra of phosphate oxyanions show a symmetric stretching mode (
m
1) at 938 cm1,the antisymmetric stretching mode (
m
3) at 1017 cm1, thesym-metric bending mode (
m
2) at 420 cm1 and them
4 mode at567 cm1 [24–28]. The value for the
m
1 symmetric stretching
vibration of PO4 units as determined by infrared spectroscopy
was given as 930 cm1(augelite), 940 cm1(wavellite), 970 cm1
(rockbridgeite), 995 cm1 (dufrenite) and 965 cm1 (beraunite).
The position of the symmetric stretching vibration is mineral dependent and a function of the cation and crystal structure. The fact that the symmetric stretching mode is observed in the infrared spectrum affirms a reduction in symmetry of the PO4units.
The value for the
m
2symmetric bending vibration of PO4units asdetermined by infrared spectroscopy was given as 438 cm1
(augel-ite), 452 cm1(wavellite), 440 and 415 cm1 (rockbridgeite), 455,
435 and 415 cm1 (dufrenite) and 470 and 450 cm1(beraunite).
The observation of multiple bending modes provides an indication of symmetry reduction of the PO4units. This symmetry reduction
is also observed through the
m
3antisymmetric stretching vibrations.Augelite [28]shows infrared bands at 1205, 1155, 1079 and 1015 cm1; wavellite at 1145, 1102, 1062 and 1025 cm1;
rock-bridgeite at 1145, 1060 and 1030 cm1; dufrenite at 1135, 1070
and 1032 cm1; and beraunite at 1150, 1100, 1076 and 1035 cm1.
Published data concerning the spectroscopic characterization of beryllium phosphates are very rare in the literature. In the charac-terization of fluid inclusions in quartz from granitic pegmatites, Rickers et al. [29] describes Raman bands in herderite at 584, 595, 983, 1005 cm1; however, the authors gave no assignment
of the bands. In recent studies, in reference to the datas published by Rickers et al.[29], Frezzoti et al.[30]described Raman vibra-tions related to (PO4)3- anion in herderite at 584 cm1 (
m
4),983 cm1(
m
1) and 1005 (
m
3) cm1.The objectives of this work are to understand the structure of herderite–hydroxylherderite minerals with the application of the vibrational spectroscopic methods infrared and Raman spectros-copy and to establish a relation between the F/OH ratios and the position of the vibrations bands of OHanion.
Experimental
Occurrence, sample description and preparation
For the development of this work, three natural single crystal specimens of the hydroxylherderite series were chosen. The sam-ples were collected from different pegmatites and incorporated into the collection of the Geology Department of the Federal Uni-versity of Ouro Preto, Minas Gerais, Brazil.
Sample SAA-073 was collected from the Morro Redondo mine, which belongs to the Araçuai pegmatite district, located near Cor-onel Murta, north of Minas Gerais. It corresponds to a bluish 3.0 cm single crystal and was found in association with muscovite and albite in a miarolitic cavity. Sample SAA-074 was collected from Jove Lauriano mine, located in the Conselheiro Pena pegma-tite district, municipality of Divino das Laranjeiras, east of Minas Gerais. It corresponds to a single crystal up to 2 cm with yellow-ish color. The crystal was found in association with muscovite and albite in a miarolitic cavity. Samples SAA-075 and SAA-076 were also collected from pegmatites in the municipality of Divino das Laranjeiras. SAA-075 corresponds to an aggregate of 0.4 cm colorless single crystals and was found in association with muscovite, albite and fluorapatite in a miarolitic cavity. SAA-076 was collected from the Almerindo mine[31]. It corresponds to a yellowish single crystal, up to 2 cm in length and was found in association with muscovite, albite, fluorapatite and brazilianite in a miarolitic cavity. Sample SAA-093 was collected from a muscovite and topaz pegmatite in Medina, north from Minas Ger-ais. The single crystal shows bluish color, and occurs in associa-tion with muscovite.
cavities of granitic pegmatites, in different mineral associations. The samples were collected from five different Brazilian pegmatites. Four samples are related to lithium bearing pegma-tites: SAA-073 (Morro Redondo – lepidolite and elbaite), SAA-074 (Jove Lauriano – montebrasite type and minor spodumene), SAA-075 (Osvaldo Perini – montebrasite type), SAA-076 (Almerindo – triphylite type) and one sample was collected from a muscovite-topaz rich pegmatite (Medina – SAA-093). Samples SAA-073, SAA-074 and SAA-075 are labeled as a, b, c in the figures. The crystals were hand selected and phase analyzed by X-ray powder diffraction for simple identification. Fragments of each sample were prepared in different ways to be submitted to chem-ical analysis by Electron microprobe, Raman and infrared spectroscopy.
Electron microprobe analysis (EMP)
Chemical characterization was carried via EMP. Each sample se-lected for this study was analyzed with the performance of five spots per crystal. The chemical analysis was carried out with a Jeol JXA8900R spectrometer from the Physics Department of the Fed-eral University of Minas Gerais, Belo Horizonte. For each selected element was used the following standards: Ca–Apatite, PACa2P2O7,
F–Fluorite, Mn–Rhodonite, Fe–Magnetite, AlAAl2O3and MgAMgO.
Be and H2O were calculated by stoichiometry. The epoxy
embed-ded hydroxylherderite samples were coated with a thin layer of evaporated carbon. The electron probe microanalysis in the WDS (wavelength dispersive spectrometer) mode was obtained at 15 kV accelerating voltage and beam current of 10 nA. Chemical formula was calculated on the basis of five oxygen atoms (O, F, OH).
Raman microprobe spectroscopy
Crystals of herderite/hydroxylherderite were placed on a pol-ished metal surface on the stage of an Olympus BHSM microscope, which is equipped with 10, 20, and 50objectives. The
micro-scope is part of a Renishaw 1000 Raman micromicro-scope system, which also includes a monochromator, a filter system and a CCD detector (1024 pixels). The Raman spectra were excited by a Spectra-Physics model 127 HeANe laser producing highly polarized light at 633 nm
and collected at a nominal resolution of 2 cm1and a precision of
±1 cm1in the range between 200 and 4000 cm1. Repeated
acqui-sitions on the crystals using the highest magnification (50) were accumulated to improve the signal to noise ratio of the spectra. The spectra were collected over night. Raman Spectra were calibrated using the 520.5 cm1line of a silicon wafer. The Raman spectrum
of at least 10 crystals was collected to ensure the consistency of the spectra.
Infrared spectroscopy
Infrared spectra were obtained using a Nicolet Nexus 870 FTIR spectrometer with a smart endurance single bounce diamond ATR cell. Spectra over the 4000–525 cm1 range were obtained
by the co-addition of 128 scans with a resolution of 4 cm1and a
mirror velocity of 0.6329 cm/s. Spectra were co-added to improve the signal to noise ratio.
Near-infrared spectroscopy
NIR spectra were collected on a Nicolet Nexus FT-IR spectrom-eter with a Nicolet Near-IR Fibreport accessory (Madison, Wiscon-sin). The reason for using a fibre optic probe is the ease of operation and the fact that the probe can be brought to the mineral and can be used at some distance from the spectrometer. A white light
source was used, with a quartz beam splitter and TEC NIR InGaAs detector. Spectra were obtained from 13,000 to 4000 cm1(0.77–
2.50
l
m) by the co-addition of 256 scans at a spectral resolution of 8 cm1. A mirror velocity of 1.266 m s1was used. The spectrawere transformed using the Kubelka–Munk algorithm to provide spectra for comparison with published absorption spectra.
Spectral manipulation such as baseline correction/adjustment and smoothing were performed using the Spectracalc software package GRAMS (Galactic Industries Corporation, NH, USA). Band component analysis was undertaken using the Jandel ‘Peakfit’ soft-ware package that enabled the type of fitting function to be se-lected and allows specific parameters to be fixed or varied accordingly. Band fitting was done using a Lorentzian–Gaussian cross-product function with the minimum number of component bands used for the fitting process. The Lorentzian–Gaussian ratio was maintained at values greater than 0.7 and fitting was under-taken until reproducible results were obtained with squared corre-lations ofr2greater than 0.995.
Results and discussion
Chemical characterization
The chemical composition of hydroxylherderite–herderite sam-ples are presented inTable 1. For all analyzed samples the phos-phorous content was slightly higher and Ca content slightly lower than expected for ideal herderite/hydroxylherderite compo-sition (ideal herderite: [P2O5] 43.53 wt.%; [CaO] 34.39 wt.%;
hydroxylherderite: [P2O5] 44.06 wt.%; [CaO] 34.82 wt.%). Low iron
and manganese impurity contents were found in all four samples, and calcium impurities were found in samples 073 and SAA-074.
Total formula calculations were performed considering BeO and H2O content calculated by stoichiometry for all samples.
The H2O concentration in wt.% was calculated for the ideal
for-mula of CaBePO4(FxOH1x) using the fluorine concentration mea-sured by EMP. The results indicate clearly that samples SAA-073, SAA-074 and SAA-075 belong to hydroxylherderite with high OH content. Only sample SAA-076 shows lower OH content, belongs to an intermediate member in the herderite–hydroxylherderite series.
Vibrational spectroscopy background
In aqueous systems, the Raman spectra of phosphate oxyanions show a symmetric stretching mode (
m
1) at 938 cm1, anantisym-metric stretching mode (
m
3) at 1017 cm1, a symmetric bendingmode (
m
2) at 420 cm1 and am
4 bending mode at 567 cm1[25,27,32]. S.D. Ross in Farmer listed some well-known minerals containing phosphate which were either hydrated or hydroxylated or both[23]. The vibrational spectrum of the dihydrogen phos-phate anion has been reported by Farmer[23]. The PO2symmetric
stretching mode occurs at 1072 cm1 and the POH symmetric
stretching mode at878 cm1. The POH antisymmetric stretching
mode was found at 947 cm1 and the P(OH)
2 bending mode at
380 cm1. The band at 1150 cm1was assigned to the PO 2
anti-symmetric stretching mode. The position of these bands will shift according to the crystal structure of the mineral.
The vibrational spectra of phosphate minerals have been pub-lished by Farmer’s treatise Chapter 17[23]. The Table 17.III in Ref.[23]reports the band positions of a wide range of phosphates and arsenates. The band positions for the monohydrogen phos-phate anion of disodium hydrogen phosphos-phate dihydrate is given as
m
1 at 820 and 866 cm1,m
2 at around 460 cm1,m
3 as 953,993, 1055, 1070, 1120 and 1135 cm1,
m
4 at 520, 539, 558,
575 cm1. The POH unit has vibrations associated with the OH
specie. The stretching vibration of the POH units was tabulated
as 2430 and 2870 cm1, and bending modes at 766 and
1256 cm1. Water stretching vibrations were found at 3050 and
3350 cm1. The position of the bands for the disodium hydrogen
phosphate is very dependent on the waters of hydration. There have been several Raman spectroscopic studies of the monosodium dihydrogen phosphate chemicals[33–37].
Raman and infrared spectroscopy
The Raman spectrum of hydroxylherderite is illustrated in
Fig. 1. Clearly there are large parts of the spectrum where no inten-sity is observed. Therefore, the spectra are subdivided into sections according to the types of molecular vibrations being observed. The infrared spectrum of hydroxylherderite is shown inFig. 2. As with the Raman spectrum, no intensity is observed in large parts of the spectrum and as a consequence, the spectrum may be subdivided into sections according to the types of vibrations being observed.
The Raman spectra of the three samples shown (samples SAA073, SAA075 and SAA076) in this spectral region are very similar, although some variation in band position is observed.
The Raman band at 998 cm1of hydroxylherderite is assigned
to the
m
1symmetric stretching mode of the PO34 units. The bandis observed at 1000 cm1for sample b and 1006 cm1for sample
c. The Raman spectrum of herderite displays a band at 975 cm1.
Raman spectra of herderite were found very difficult to obtain be-cause of fluorescence. The band at 985 cm1for hydroxylherderite
is attributed to the HOPO3
3 units. Galy[35]first studied the
polar-ized Raman spectra of the H2PO4 anion. Choi et al. reported the
polarization spectra of NaH2PO4 crystals. Casciani and Condrate
[38] published spectra on brushite and monetite together with synthetic anhydrous monocalcium phosphate (Ca(H2PO4)2),
mono-calcium dihydrogen phosphate hydrate (Ca(H2PO4)2H2O) and
oct-acalcium phosphate (Ca8H2(PO4)65H2O). These authors
determined band assignments for Ca(H2PO4) and reported bands
at 1012 and 1085 cm1 as POH and PO stretching vibrations,
respectively. The two Raman bands at 1128 and 1138 cm1 are
attributed to both the HOP and PO antisymmetric stretching
Table 1
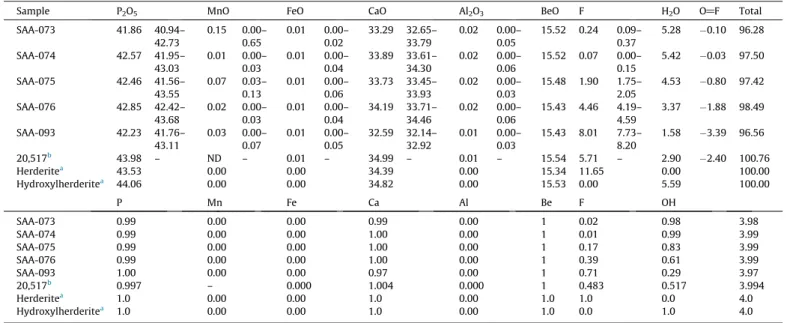
Electron microprobe analysis of hydroxylherderite-herderite samples in wt.%. The result was taken as the mean value from five spots. H2O and BeO were calculated by stoichiometry.
Sample P2O5 MnO FeO CaO Al2O3 BeO F H2O O@F Total
SAA-073 41.86 40.94–
42.73
0.15 0.00– 0.65
0.01 0.00– 0.02
33.29 32.65– 33.79
0.02 0.00– 0.05
15.52 0.24 0.09– 0.37
5.28 0.10 96.28
SAA-074 42.57 41.95–
43.03
0.01 0.00– 0.03
0.01 0.00– 0.04
33.89 33.61– 34.30
0.02 0.00– 0.06
15.52 0.07 0.00– 0.15
5.42 0.03 97.50
SAA-075 42.46 41.56–
43.55
0.07 0.03– 0.13
0.01 0.00– 0.06
33.73 33.45– 33.93
0.02 0.00– 0.03
15.48 1.90 1.75– 2.05
4.53 0.80 97.42
SAA-076 42.85 42.42–
43.68
0.02 0.00– 0.03
0.01 0.00– 0.04
34.19 33.71– 34.46
0.02 0.00– 0.06
15.43 4.46 4.19– 4.59
3.37 1.88 98.49
SAA-093 42.23 41.76–
43.11
0.03 0.00– 0.07
0.01 0.00– 0.05
32.59 32.14– 32.92
0.01 0.00– 0.03
15.43 8.01 7.73– 8.20
1.58 3.39 96.56
20,517b 43.98 – ND – 0.01 – 34.99 – 0.01 – 15.54 5.71 – 2.90 2.40 100.76
Herderitea 43.53 0.00 0.00 34.39 0.00 15.34 11.65 0.00 100.00
Hydroxylherderitea 44.06 0.00 0.00 34.82 0.00 15.53 0.00 5.59 100.00
P Mn Fe Ca Al Be F OH
SAA-073 0.99 0.00 0.00 0.99 0.00 1 0.02 0.98 3.98
SAA-074 0.99 0.00 0.00 1.00 0.00 1 0.01 0.99 3.99
SAA-075 0.99 0.00 0.00 1.00 0.00 1 0.17 0.83 3.99
SAA-076 0.99 0.00 0.00 1.00 0.00 1 0.39 0.61 3.99
SAA-093 1.00 0.00 0.00 0.97 0.00 1 0.71 0.29 3.97
20,517b 0.997 – 0.000 1.004 0.000 1 0.483 0.517 3.994
Herderitea 1.0 0.00 0.00 1.0 0.00 1.0 1.0 0.0 4.0
Hydroxylherderitea 1.0 0.00 0.00 1.0 0.00 1.0 0.0 1.0 4.0
a Calculated on the basis of ideal formula of herderite–(CaBe(PO
4)(F) and hydroxylherderite–(CaBe(PO4)(OH). b According to Harlow and Hawthorne[19].
Fig. 1.Raman spectra of hydroxylherderite in the 100–4000 cm1region.
vibrations. Casciani and Condrate[38]tabulated Raman bands at 1132 and 1155 cm1and assigned these bands to P
AO symmetric
and the PAO antisymmetric stretching vibrations. It is proposed
that the proton on the hydroxyl units is very liable and can oscil-late between the OH units and the phosphate units. In this way the hydrogen phosphate units are formed. Raman bands in the 883–908 cm1are assigned to hydroxyl deformation modes. The
position and number of bands in this part of the spectrum is a func-tion of the degree of fluorine substitufunc-tion. In sample a, it is sug-gested that the amount of hydroxyl units is low, when compared with samples b and c where distinct OH deformation modes are observed.
The infrared spectrum of hydroxylherderite (Fig. 2) shows very intense bands at 1012 cm1assigned to the
m
1symmetricstretch-ing mode of the PO3
4 units. The infrared spectrum of herderite
shows an intense band at 1005 cm1and is attributed to this
vibra-tion. The infrared bands at around 1100 cm1are assigned to the
m
3antisymmetric stretching mode of the PO3
4 units. The infrared
bands of herderite at 1079, 1099, 1121 and 1149 cm1are assigned
to this vibrational mode.
Some variation in peak position and intensity is observed in the Raman spectra of the three hydroxylherderite samples. The set of Raman bands of hydroxylherderite observed at 563, 568, 577,
598, 616 and 633 cm1 (sample a), 568, 579, 597, 616 and
534 cm1and 578, 586, 597 and 614 cm1(sample c) are assigned
to the
m
4out of plane bending modes of the PO4and H2PO4units.The Raman bands in this part of the spectral region for herderite were swamped by fluorescence. The Raman spectrum of NaH2PO4
shows Raman bands at 526, 546 and 618 cm1. The observation of
multiple bands in this spectral region supports the concept of sym-metry reduction of both the phosphate and hydrogen phosphate units. The Raman bands at 425 and 446 cm1 together with the
bands at 516 and 527 cm1 (sample a), 426, 447, 516 and
528 cm1(sample b) and 427, 449, 493, 529 and 533 cm1(sample
c) are attributed to the
m
2PO4and H2PO4bending modes. TheRa-man spectrum of NaH2PO4shows two Raman bands at 460 and
482 cm1. The observation of multiple Raman bands for the
hydroxylherderite mineral supports the concept of symmetry reduction.
A number of bands are observed in the 300–350 cm1region.
Raman bands are found at 308, 327, 346 and 354 cm1(sample
a), 307, 328, 343 and 352 cm1 (sample b) and 303, 325, 339,
349 and 355 cm1are attributed to BeO and CaO stretching
vibra-tions. Some varaition in band position and intensity is observed. This is expected as these bands are due to external or often called lattice vibrations. Strong Raman bands are found at 145, 168, 184, 199, 232, 254 and 270 cm1(sample a), 168, 184, 198, 230, 254 and
170 cm1(sample b), 168, 183, 196, 254 and 272 cm1(sample c).
The Raman spectrum of the OH stretching region may be ob-served inFig. 1.
This spectral region is where the OH stretching vibrations are observed. In this spectral region, considerable variation in intensity is observed. For sample a, a single intense Raman band at
3623 cm1 is observed with a low intensity shoulder at
3622 cm1. Another low intensity band is observed at 3570 cm1.
This latter band shows greater intensity for sample b. For this sam-ple a very intense band at 3624 cm1 is found, now with a low
intensity shoulder at 3627 cm1. A low intensity band at
3609 cm1is also found. The band at 3570 cm1for
hydroxylher-derite samples a and b now is split into two bands at 3568 and 3578 cm1for sample c and shows much greater intensity. The
Ra-man spectrum of herderite displays an intense sharp band at 3625 cm1with a low intensity shoulder on the low wavenumber
side of the main peak. It is significant that there are two OH stretching vibrations; thus, indicating that there are two non-equivalent OH units.
The infrared spectrum of sample a shows a very intense band at
3605 cm1 with low wavenumber shoulders at 3569 and
3597 cm1(Fig. 2). The infrared spectrum is in good harmony with
the Raman spectrum of this sample. The infrared spectrum for sample b displays an intense band at 3605 cm1 with shoulders
at 3570 and 3599 cm1. These bands are attributed to the OH
stretching vibration. Two peaks of around equal intensity for herderite are observed at 3567 and 3575 cm1. The observation
of multiple bands supports the concept that the OH units are not equivalent. The OH peaks are superimposed upon a broad feature centered around 3640 cm1 and attributed to adsorbed water.
For sample c, two intense infrared peaks are observed at 3566 and 3605 cm1 with a shoulder band at 3600 cm1. Again, the
OH stretching peaks are superimposed upon a broad low intensity feature centered around 3311 cm1. There is good correlation
be-tween the infrared and Raman spectra. The observation of two OH stretching vibrations gives credence to the non-equivalence of the OH units in the herderite–hydroxylherderite structure. Such information is not available using other techniques such as X-ray diffraction.
Studies have shown a strong correlation between OH stretching frequencies and both O O bond distances and H O hydrogen bond distances[39–42]. Libowitzky showed that a regression func-tion can be employed relating the hydroxyl stretching wavenum-bers with regression coefficients better than 0.96 using infrared
spectroscopy [43]. The function is described as:
m
1-=ð3592304Þ 1090d:1321ðOOÞcm
1. Thus OH
O hydrogen bond dis-tances may be calculated using the Libowitzky empirical function. Hydrogen bond distances may be obtained by using the OH stretching wavenumbers as given inFig. 1. The values for the OH stretching vibrations listed above provide hydrogen bond dis-tances of 2.9497 Å (3531 cm1), 3.0785 Å (3569 cm1), 3.1070 Å
(3597 cm1), 3.1560 Å (3605 cm1). By using the position of the
Raman OH stretching wavenumbers as given inFig. 2, hydrogen bond distances may be estimated. Here, hydrogen bond distances are calculated as 3.0231 Å (3557 cm1), 3.0729 Å (3568 cm1),
3.1441 Å (3578 cm1), 3.1561 Å (3609 cm1), 3.2530 Å
(3626 cm1). It is observed that the hydrogen bond distances
cal-culated from the infrared spectra are in a similar range as calcu-lated from the Raman spectrum.
The large hydrogen bond distances which are present in hydrox-ylherderite can also be seen in other mixed anion minerals such as peisleyite and perhamite[44,45]where the distances ranging be-tween 3.052(5) and 2.683(6) Å. Such hydrogen bond distances are typical of secondary minerals. A range of hydrogen bond distances are observed from reasonably strong to weak hydrogen bonding. This range of hydrogen bonding contributes to the stability of the mineral. Two types of OH units can be identified in the structure of hydroxylherderite. Structural data (X-ray diffraction) do not give us such information (Lager and Gibbs[18], Harlow and Hawthorn
[19]). Importantly, for all of the members of the herderite–hydrox-ylherderite series, two OH stretching vibrations are observed. This shows that there are two non-equivalent OH units in the mineral structure. The duplication of the hydroxyl stretching vibrations is also observed in the NIR spectra (see below).
The hydrogen bond distances previously established can be used to predict the hydroxyl stretching wavenumbers. The spec-trum of hydroxylherderite may be divided into two groups of OH
stretching wavenumbers; namely 3500–3600 cm1 and 3600–
3650 cm1. This distinction suggests that the strength of the
hydrogen bonds as measured by the hydrogen bond distances can also be divided into two groups according to the H-bond dis-tances. An arbitrary cut-off point may be 3.40 Å based upon the wavenumber 3590 cm1. Thus the first bands listed above may
relatively strong hydrogen bonds. It should be noted that the infra-red band at 1635 cm1is assigned to the water HOH bending mode
(figure not shown). For normal hydrogen-bonded water this band occurs at around 1620 cm1. Thus the position of this band also
indicates relatively weak hydrogen bonding in the mineral hydroxylherderite.
Near Infrared spectroscopy (NIR)
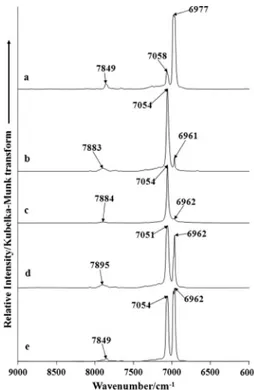
The near infrared spectra of (a) herderite, (b) hydroxylherde-rite-SAA073, intensity has been multiplied a factor of 2, (c) hydrox-ylherderite-SAA074, intensity has been multiplied a factor of 4, (d) hydroxylherderite-SAA075, intensity has been multiplied a factor of 2, and (e) hydroxylherderite-SAA076, intensity has been multi-plied a factor of 5 are shown inFig. 3. This figure shows obvious differences in the spectra of the five minerals of the herderite– hydroxylherderite series. Near-infrared spectroscopy is often referred to as proton spectroscopy. The reason is that the near infrared spectrum, in the main, contains the combination and over-tones bands of the hydroxyl bands of the mid-infrared spectral range. Thus, any units which contain protons such as hydroxyl, amine, and CH will show bands in the NIR spectral region.
The spectra may be conveniently divided into sections. The NIR spectral region between 4000 and 6000 cm1region is the region
where combination bands of the OH vibrations in the mid-infrared spectral region. The region between 6000 and 8000 cm1displays
the bands which are the combination and overtone bands of the hydroxyl stretching bands from the mid-IR. The spectra in this spectral range are illustrated inFig. 4. The spectral region between 10,000 and 12,000 cm1display bands which are due to the second
overtone of OH stretching vibration of the mid-infrared spectrum. The spectra are reported inFig. 5.
The NIR spectrum of herderite shows two bands at 6977 and 7058 cm1. The infrared spectrum of herderite displays two bands
at 3567 and 3575 cm1assigned to the OH stretching vibrations.
The bands at 6977 and 7058 cm1are attributed to the first
over-tone of the OH stretching fundamental. These bands are assigned to 2
m
OH. An additional band of lower intensity is observed at7849 cm1. This band is due to the combination of the stretching
and deformation modes in the mid-infrared spectrum (2
m
OH+dOH)i.e. the band is due to the first overtone of the OH stretching fun-damental and the OH deformation mode.
The NIR spectrum of hydroxylherderite (spectra b to e) displays two bands at around 6961 and 7054 cm1. The position of the
bands remains constant but the intensity of the bands varies and appears to be a function of the fluorine content in the mineral as
Fig. 3.Near-infrared spectrum of herderite–hydroxylherderite in the 4000– 12,000 cm1region (samples SAA-073, 074, 075, 076 and 093).
Fig. 4.Near-infrared spectrum of herderite–hydroxylherderite in the 6000– 9000 cm1region (samples SAA-073, 074, 075, 076 and 093).
reported inTable 2. The higher the fluorine content the greater the intensity of the 6962 cm1band. A low intensity NIR band is
ob-served at around 7883 cm1. The position of this band appears to
vary with the fluorine content. The position of the band (7849 cm1) is the same for the high fluorine content
hydroxylher-derite and herhydroxylher-derite.
This spectral region is where the second overtone of the hydro-xyl stretching fundamental that is 3
m
OH. The mineral herderitedis-plays two bands at 10,186 and 10,217 cm1with a very weak band
at 10,321 cm1(spectrum a). The two hydroxylherderite minerals
with very low F content shows an intense band at 10,329 cm1
with a very low intensity band at 10,190 cm1. For the two higher
F content hydroxylherderite minerals two intense bands are ob-served at 10,194 and 10,329 cm1. The hydroxylherderite
(spec-trum e) has an additional band at 10,221 cm1. This band is also
observed as a shoulder band in spectrum (d). It should be kept in mind that there are no quantum mechanical restrictions on the al-lowed vibrations on NIR spectroscopy. The combination of infrared and Raman bands is allowed. What is quite clear is that NIR spec-troscopy shows differences in the spectra of the minerals and this is related to the F content of the minerals.
Conclusions
The samples associated to montebrasite and lepidolite rich peg-matites show lower fluorine values (SAA-073 – 0.24%; SAA-074 – 0.07%; SAA-075 – 1.90%) and the sample associated to triphylite rich pegmatite shows intermediate fluorine content (SAA-076 – 4.46%), while the analyzed sample from a muscovite and topaz rich pegmatite shows high fluorine (SAA-093 – 8.01%). This relationship may be explained in relation with the degree of differentiation of the pegmatite magma, where lithium rich pegmatites shows lower content of fluorine with predominance of hydroxylherderite in the hydrothermal system and the muscovite topaz rich pegmatite shows higher fluorine content with predominance of the F rich member herderite.
In the vibrational spectroscopic study, the Raman spectra of hydroxylherderite are characterized by bands at around 985 and 998 cm1, assigned to
m
1symmetric stretching mode of the PO34
units. Raman bands at around 1085, 1128 and 1138 cm1 are
attributed to both the HOP and PO antisymmetric stretching vibra-tions. The set of Raman bands observed at 563, 568, 577, 598, 616 and 633 cm1are assigned to the
m
4out of plane bending modes of
the PO4units. The OH Raman stretching vibrations of
hydroxylher-derite were observed ranging from 3626 cm1to 3609 cm1. The
infrared stretching vibrations of hydroxylherderites were observed between 3606 cm1 and 3599 cm1. The significance of two
stretching vibrations in the OH stretching region, proves that there are two non-equivalent OH units in the structure of the herderite– hydroxylherderite series.
By using a Libowitzky type function, hydrogen bond distances based upon the infrared and Raman OH stretching band wavenum-bers were calculated. By using the infrared OH stretching vibra-tions for sample SAA-073 the calculated hydrogen bond distances are: 2.9497 Å (3531 cm1), 3.0785 Å (3569 cm1), 3.1070 Å
(3597 cm1), 3.1560 Å (3605 cm1). In agreement with the infrared
data, the Raman OH stretching vibrations for sample SAA-076 shows similar values of calculated hydrogen bond distances, given as 3.0231 Å (3557 cm1), 3.0729 Å (3568 cm1), 3.1441 Å
(3578 cm1), 3.1561 Å (3609 cm1), 3.2530 Å (3626 cm1).
Near infrared spectroscopy was used to characterize the herde-rite–hydroxylherderite minerals. Characteristic NIR bands at around 6961 and 7054 cm1 were assigned to the first overtone
of the fundamental, whilst NIR bands at 10,194 and 10,329 cm1
are assigned to the second overtone of the fundamental OH stretching vibration.
The position and intensity of the infrared and near-infrared OH stretching bands show variations with fluorine content of the herderite–hydroxylherderite mineral series, in a similar correlation to that published data for amblygonite–montebrasite series
[21,22]. The IR
m
OHbands for samples SAA-073 (He0.01Hy0.99) andSAA-093 (He0.71Hy0.29) are 3605, 3597 cm1and 3575, 3567 cm1
respectively, and shows an increase of the position with increase of F content. The same correlation can be observed in the same samples in NIR 3
m
OH bands. IR dOH bands where assigned at776 cm1 and 788 cm1and NIR 2
m
OH bands where observed at
7054, 6961 cm1 and 7058, 6977 cm1 respectively, and shows
an inverse correlation with decrease of position with increase of F content.
Acknowledgements
The financial and infra-structure support of the Discipline of Nanotechnology and Molecular Science, Science and Engineering Faculty of the Queensland University of Technology, is gratefully acknowledged. The Australian Research Council (ARC) is thanked for funding the instrumentation. R. Scholz thanks to CNPq – Conse-lho Nacional de Desenvolvimento Científico e Tecnológico (Grant No. 306287/2012-9). M. Cândido Filho thanks to CNPq/PIBIC/UFOP.
References
[1]H.G. Dill, Earth Sci. Rev. 100 (2010) 1–420.
[2]D.M. Burt, Met. Assoc. Acid Magmat. 1 (1974) 262–266.
[3]K. Rickers, R. Thomas, W.W. Heinrich, Min. Dep. 41 (2006) 229–245. [4]R. Thomas, J.D. Webster, P. Davidson, Cont. Min. Pet. 161 (2011) 483–495. [5]P.B. Moore, Min. Rec. 4 (1973) 103–130.
[6]D.M. Burt, Econ. Geol. 70 (1975) 1279–1292. [7]P. Cˇerny´, Rev. Min. Geochem. 50 (2002) 405–444.
[8]I. Cˇerná, P. Cˇerny´, J.B. Selway, R. Chapman, Can. Min. 40 (2002) 1339–1345. [9]D. Atencio, J.M.V. Coutinho, L.A.D. Menezes, Axis 1 (2005) 1–18.
[10]D. Atencio, P.A. Matioli, J.B. Smith, N.V. Chukanov, J.M.V. Coutinho, R.K. Rastsvetaeva, S. Möckel, Amer. Min. 93 (2008) 1–6.
Table 2
Variations of infrared, Raman and NIR OH bands and measured fluorine and calculated H2O contents in wt.%.
SAA-073 SAA-074 SAA-075 SAA-076 SAA-093 20,517a
wt.% (F) 0.24 0.07 1.90 4.46 8.01 5.71
N°atoms (F) 0.02 0.01 0.17 0.39 0.71 0.483
wt.% (H2O) 5.28 5.42 4.53 3.37 1.58 2.90
N°atoms (OH) 0.98 0.99 0.83 0.61 0.29 0.517
F/(OH + F) 0.02 0.01 0.17 0.39 0.71 0.483
IRmOH(cm1) 3605, 3597 3605, 3599 3605, 3600, 3566 3606 3575, 3567 –
IRdOH(cm1) 776 773 776 776 788 –
Raman 3623 3623 3624, 3609 3626, 3609, 360 – 3625.8
NIR 2mOH 7054, 6961 7054, 6962 7051, 6962 7054, 6962 7058, 6977 –
NIR 3mOH 10,329, 10,190 10,329, 10,182 10,329,10,194 10,325, 10,194 10,321, 10,186 –
aAccording to Harlow and Hawthorne[19]and Harlow (personal communication).
[11]P.J. Dunn, W. Wight, J. Gem. 15 (1976) 27–28.
[12]P.J. Dunn, C.W. Wolfe, P.B. Leavens, W.E. Wilson, Min. Rec. 10 (1979) 5–11.
[13]R.C. Kammerling, K. Scarratt, G. Bosshart, E.A. Jobbins, R.E. Kane, E.J. Gübelin, A.A. Levinson, J. Gem. 24 (1994) 3–40.
[14]W. Haidinger, Phil. Mag. Annals Phil. (London) New Series 4 (1828) 1–3. [15]S.L. Penfield, Amer. J. Sci. 147 (1894) 329–339.
[16]C. Palache, H. Berman, C. Frondel, Dana‘s System of Mineralogy, seventh ed., Wiley, New York, 1951.
[17]K. Byrappa, D.Y. Pushcharovsky, Prog. Cryst. Growth Char. Mat. 24 (1992) 269– 359.
[18]G.A. Lager, G.V. Gibbs, Amer. Min. 59 (1974) 919–925. [19]G.E. Harlow, F.C. Hawthorne, Amer. Min. 93 (2008) 1545–1549. [20]P.B. Leavens, P.J. Dunn, R.V. Gaines, Amer. Min. 63 (1978) 913–917. [21]A.M. Fransolet, P. Tarte, Amer. Min. 62 (1977) 559–564.
[22]B. Rondeau, E. Fritsch, P. Lefevre, M. Guiraud, A.-M. Fransolet, Y. Lulzac, Can. Min. 44 (2006) 1109–1117.
[23] V.C. Farmer, Mineralogical Society Monograph 4: The Infrared Spectra of Minerals, London, 1974.
[24]R.L. Frost, K.L. Erickson, Spectrochim. Acta 61A (2004) 45–50.
[25]R.L. Frost, W. Martens, P.A. Williams, J.T. Kloprogge, Min. Mag. 66 (2002) 1063– 1073.
[26]R.L. Frost, W. Martens, P.A. Williams, J.T. Kloprogge, J. Raman Spectrosc. 34 (2003) 751–759.
[27]R.L. Frost, W.N. Martens, T. Kloprogge, P.A. Williams, Neues Jahrb. Min. (2002) 481–496.
[28]R.L. Frost, M.L. Weier, J. Mol. Struct. 697 (2004) 207–211.
[29]K. Rickers, R. Thomas, W. Heinrich, Min. Dep. 41 (2006) 229–245. [30] M.L. Frezzoti, F. Tecce, A. Casagli, J. Geochem. Explor. 112 (2012) 1–20. [31]U. Kolitsch, D. Atencio, N.V. Chukanov, N.V. Zubkova, L.A.D.M. Filho, J.M.V.
Coutinho, W.D. Birch, J. Schlüter, D. Pohl, A.R. Kampf, I.M. Steele, G. Favreau, L. Nasdala, S. Möckel, G. Giester, D.Y. Pushcharovsky, Min. Mag. 74 (2010) 469– 486.
[32]R.L. Frost, P.A. Williams, W. Martens, J.T. Kloprogge, P. Leverett, J. Raman Spectrosc. 33 (2002) 260–263.
[33]C.E. Bamberger, W.R. Busing, G.M. Begun, R.G. Haire, L.C. Ellingboe, J. Solid State Chem. 57 (1985) 248–259.
[34]B.K. Choi, M.N. Lee, J.J. Kim, J. Raman Spectrosc. 20 (1989) 11–15. [35]A. Galy, J. Phys. Radium 12 (1951) 827.
[36] H. Poulet, N. Toupry-Krauzman, Proc. Int. Conf. Raman, Spectrosc., 6th, vol. 2, 1978, pp. 364–365.
[37]N. Toupry-Krauzman, H. Poulet, M. Le Postollec, J. Raman Spectrosc. 8 (1979) 115–121.
[38] F.S. Casciani, R.A. Condrate, Sr., Proc. – Inter. Cong. Phosphorus Compounds, 2nd, 1980, pp. 175–190.
[39]J. Emsley, Chem. Soc. Rev. 9 (1980) 91–124. [40] H. Lutz, Struct. Bond. 82 (1995) 85–103. [41]W. Mikenda, J. Mol. Struct. 147 (1986) 1–15. [42]A. Novak, Struct. Bond. 18 (1974) 177–216.
[43]E. Libowitsky, Monatsch. Chem. 130 (1999) 1047–1049.
[44]R.L. Frost, S.J. Mills, M.L. Weier, Peisleyite an unusual mixed anion mineral-a vibrational spectroscopic study, Spectrochim. Acta, Part A: Mol. Biomol. Spectrosc. 61A (2004) 177–184.