Article
0103 - 5053 $6.00+0.00*e-mail: [email protected]
Exopolymeric Substances (EPS) Produced by Petroleum Microbial Consortia
Georgiana F. da Cruz,a Célio F. F. Angolini,a Eugênio V. dos Santos Neto,b
Watson Loha and Anita J. Marsaioli*,a
aChemistry Institute, University of Campinas, PO Box 6154, 13083-970 Campinas-SP, Brazil
bPETROBRAS R&D Center, Cidade Universitária, Q-7, 21949-900 Rio de Janeiro-RJ, Brazil
Durante o monitoramento de ensaios de biodegradação com consórcios microbianos recuperados de amostras de petróleo do campo Pampo Sul, Bacia de Campos, RJ, observou-se a produção de substâncias exopoliméricas (EPS) a qual ocorria independentemente do processo de biodegradação. Para potencializar essa produção utilizou-se um meio mineral enriquecido com glicose e 9,10-di-hidrofenantreno, n-nonadecano, ácido nonadecanóico, petróleo levemente biodegradado (P1) e petróleo severamente biodegradado (P2) como fontes de carbono. A análise dos EPS por infravermelho e espectrometria de massas com ionização por electrospray (MS-ESI) revelou uma mistura de isoformas de surfactina, que reduziu a tensão supericial da água e do meio Zinder de 72,4 e 55,7 para 28,6 mN m−1. Além disso, demonstraram capacidade de formar emulsões
de diferentes óleos em água, com resultados até melhores que de surfactantes comerciais, como Tween 80. A produção dos EPS não foi inibida por nenhum dos substratos testados.
Microbial consortia recuperated of crude oil samples from the Pampo Sul ield, Campos Basin, RJ, produced biosurfactants in mineral media containing glucose and 9,10-dihydrophenantrene,
n-nonadecane, nonadecanoic acid, slightly biodegraded crude oil (P1) or heavily biodegraded crude oil (P2) as carbon sources. The production of exopolimeric substances (EPS) and petroleum biodegradation do not necessarily occur simultaneously. The EPS analyses by infrared and eletronspray ionization mass spectrometry (ESI-MS) revealed a mixture of surfactine isoforms. The biosurfactants reduced the surface tension of water and Zinder medium from 72.4 and 55.7 to 28.6 mN m−1. Additionally, this surfactant emulsiied different oils in water with performances
similar to or better than of a conventional surfactant, Tween 80.
Keywords: biosurfactant, MS-ESI, surface tension, emulsiication index, hydrocarbon biodegradation
Introduction
Petroleum hydrocarbon biodegradation is a complex process that depends on the oil and reservoir compositions as well as on particular conditions favoring microorganism growth in a lipophilic environment.1 However, the low bioavailability of hydrophobic organic compounds (HCOs) to microorganism could be a limiting step during the biodegradation process. Consequently, in order to enhance the solubility of these hydrophobic compounds and their bioavailability, many bacteria produce exopolimeric substances (EPS), usually biosurfactants2 to increase the aqueous dispersion of poorly soluble compounds by many
orders of magnitude3-5 facilitating their biodegradation. However, the petroleum biodegrading and surfactant producing species are not always the same.
The classes of biosurfactants include glycolipids, lipopetides, fatty acids, phospholipids, neutral lipids and lipopolysaccharides.6 Their advantages, such as high biodegradability, low toxicity and low cost, are undoubtedly environmentally friendly and make them good candidates for enhanced oil recovery and bioremediation as well as other industrial applications.7,8 Biosurfactants with proven potential for bioremediation include rhamnolipids produced by Pseudomonasaeruginosa and surfactins from Bacillus subtilis.9
and anthracene,9 but few studies have used complex mixtures such as crude oils.12-14
Knowing that oil biodegradation is more effective with a microbial consortium than with pure strains,15 which is related to microbial oil surface modiication by exuding biosurfactants, the present study evaluated the structure and surface active properties of the biosurfactants produced by microbial consortia recovered from two oil samples with different biodegradation levels (sample 1, level 1-2 and sample 2, level 5-6 according Peters & Moldowan biodegradation scale)16 from Pampo Sul ield, Campos Basin, Rio de Janeiro, Brazil. Its goal was also to establish a relationship between microbial biosurfactant production and biodegradation.
Experimental
Sampling
Oil samples generated by the same source rock facies with similar levels of thermal maturity and signiicantly different levels of biodegradation were obtained from two selected oil-producing wells in the Pampo ield, Campos Basin, Macaé, RJ, Brazil. Sample 1 was collected at 2405-2588 m with reservoir temperature = 82 °C and has biodegradation level equivalent to 1-2. Sample 2 was collected at 1988-2222 m with reservoir temperature = 71 °C and has biodegradation level equivalent to 5-6. A sample of formation water was also obtained from a separation tank. Strict sampling procedures prevented external contaminations.
Samples were collected in triplicate using 500 mL sterilized Schott bottles, which were completely illed with the samples in order to prevent oxygen inlux. The samples were kept on ice during transportation to the laboratory, and stored at room temperature for further enrichment and microbial consortia recovery.
Aerobic consortia enrichment
The oil and formation water samples (10% of the medium volume, v/v) were inoculated in nutrient broth (NB Difco), nutrient broth (NB Difco) plus 3% NaCl, marine broth (MB Difco) and Zinder17 mineral salt medium.18 Organic substrates (stock solutions of 0.2% glucose, 0.3% sodium acetate, 0.22% sodium lactate, 0.06% methanol and 2% yeast extract) were added to the Zinder mineral medium at a final concentration of 0.1% (v/v). Also, a vitamin solution (2 mg biotin; 2 mg folic acid; 5 mg thyamin hydrocloride; 5 mg nicotinic acid; 5 mg calcium panthotenate; 10 mg pyridoxine hydrocloride; 0.1 mg vitamin B12 and 5 mg lipoic acid, per liter of distilled
water) was added at 0.1% (v/v) to stimulate the microbial growth. 0.1% (v/v) sodium bicarbonate solution was added to maintain the pH of the Zinder medium at 7.2. The microorganisms were cultivated at 30 and 55 °C in a rotary shaker at 150 rpm for 20 days.
Production of the biosurfactant and biomass
Production of biosurfactant was carried out as described by Quesada et al.19 The consortia were inoculated (48 h at 30 °C) in glass tubes containing 10 mL of Zinder mineral salt medium,17 a vitamin solution (described above) at 0.1% (v/v) to stimulate microbial growth, 10% (v/v) sodium bicarbonate solution was also added to maintain the pH of the Zinder medium. This mid-exponential phase culture was then inoculated into a 1 L lask containing 400 mL of Zinder medium, 10% sodium bicarbonate solution, 0.1% vitamins solution with 1 mL of 8% glucose and supplemented with 1 mL containg 8% of the substrates: (1) 9,10-dihydrophenantrene, (2) n-nonadecane, (3) nonadecanoic acid and (4) mixture of (1), (2) and (3); (5) 30 mg of slightly biodegraded crude oil, P1 or (6) heavily biodegraded crude oil, P2. This mixture was incubated at 30 °C for 4 days (for 1, 2, 3 and mixture) and 10 days (for P1 and P2).
The culture medium was centrifuged (5000 × g, 10 °C, 30 min) and the supernatants obtained were precipitated with three volumes of cold ethanol. The biosurfactant was dissolved in Milli-Q water, submitted to dialysis against Milli-Q water, lyophilized and weighed. Yields of EPS were expressed in milligrams of freeze-dried polymer per
grams of cell.
Chemical composition
Carbohydrates, protein and uronic acids were determined by colorimetric assays,20-22 using glucose (25.0, 12.5, 6.25 and 3.125 mg mL−1), bovine serum albumin (BSA) (2.0, 1.0, 0.5 and 0.25 mg mL−1) and galacturonic acid (2.0, 1.0, 0.5 and 0.25 mg mL−1), as the standards for the calibration curves.
Surface tension and emulsiication index
The surface tension of the culture medium was determined using a KSV tensiometer, model sigma 701, using the Du-Nuoy ring method at 25 ºC, and applying the instrument correction mode. Milli-Q Water and the Zinder medium were used as controls.
(toluene, octadecane and diesel) to 2 mL of the different EPS aqueous solutions in glass tubes and vortexing the mixture at high speed for 2 min (modiied from Cooper and Goldenberg).23 The value of E was expressed (after 24 h) as the percentage of the total height occupied by the emulsion. Tween 80 (Sigma-Aldrich) was used as control chemical surfactant.
Chemical characterization
The infrared spectra were acquired with a Bomem MB Model B-100 spectrophotometer with 4 cm−1 of resolution and 1660 FTIR. A Thermo Scientiic LTQ Orbitrap XL was employed for the electrospray ionization and tandem mass spectrum analyses (ESI-MS/MS). The surfactin standard (WakoChem) and the EPS samples were analysed by direct insertion, with a syringe low of 10 µL min−1 and nitrogen low of 5 µL min−1. The capillary was maintained at 275 °C and 34 V. The spray voltage was 3 kV. A water:methanol mixture (1:1, v/v) was used to dissolve the samples and 0.1% of formic acid solution was added to the samples to reach inal concentration of 1 pg mL−1. The positive mode of analysis was used for scanning m/z 50-2000.
Biodegradation of petroleum compounds
Assays to correlate biosurfactant production and petroleum biodegradation used 9,10-dihydrophenanthrene (1, Acros), n-nonadecane (2, Aldrich), nonadecanoic acid (3, Acros), P1 and a mixture of (1), (2) and (3). The assays were monitored after 1 day and after 4 days (for compounds 1, 2, 3 and mixture) and after 10 days (for P1) by withdrawing 1 mL of the culture medium and extracting with ethyl acetate (3 × 1000 µL, for 1, 2, 3 and mixture) or dichloromethane for P1 (3 × 1000 µL). The organic layers were combined, dried over anhydrous sodium sulfate and evaporated under reduced pressure. The extracts from the P1 assay were separated into three fractions: F1 (saturated hydrocarbons), F2 (aromatic hydrocarbons) and F3 (resins and asphaltenes) using silica gel column chromatography, eluting with hexane, hexane/toluene (1:1, v/v) and
chloroform/methanol (95:5, v/v), respectively. F1 fractions were analyzed by GC-MS.
GC-MS analysis
The GC conditions for 1, 2, 3 and their mixture were: split injection (50:1), carrier gas: He at 1 mL min-1, injector temperature: 240 °C, temperature program: 50 °C for 5 min, increasing at 10 °C min−1 to 290 °C, then held for 5 min. The GC conditions for F1 were: split injection (20:1); injector temperature 300 °C, temperature program: 80 °C for 2 min increasing at 4 ºC min−1 to 270 °C and at 10 °C min−1 to 300 °C, holding for 25 min. The capillary column was a MDN5S (30 m × 0.25 mm × 0.25 µm). The data were obtained in SCAN and SIM mode, operating at 70 eV.
Results and Discussion
The biosurfactants are surface active components w i t h e m u l s i f y i n g p r o p e r t i e s w h i c h e n h a n c e petroleum biodegradation, causing commercial value depreciation. Thus the production of biosurfactants by the petroleum microorganism consortia growing on 9,10-dihydrophenanthrene (1) or n-nonadecane (2) or nonadecanoic acid (3) or a mixture of 1, 2 and 3 was evaluated (Table 1).Compounds 1, 2 and 3 were selected as carbon sources, each representing different compound classes present in petroleum: n-alkanes, aromatics and acids.
Microbial growth in the presence of 1, 2 and 3 was spectrophotometrically monitored (460 nm), (Figures 1 and 2), and the consortia evaluated had excellent growth, optical density (OD) 0.81-1.00, after 72 h with all carbon sources except with petroleum P2, OD of 0.41-0.60.24 Higher biomass was obtained with the bacterial consortium Co1 when the carbon source was P1, however this trend was different with P2 as carbon source where the higher biomass was obtained with the bacterial consortium Co2. Consequently biomass was dependent on both the carbon source and the microorganism or consortium involved.
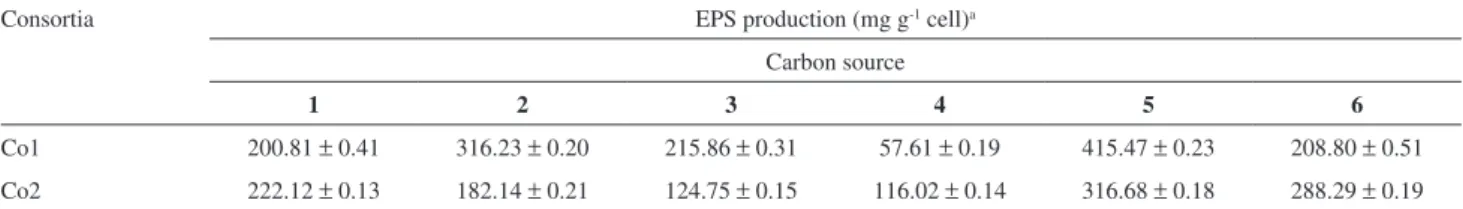
Table 1. EPS production by aerobic consortia from Brazilian petroleum
Consortia EPS production (mg g-1 cell)a
Carbon source
1 2 3 4 5 6
Co1 200.81 ± 0.41 316.23 ± 0.20 215.86 ± 0.31 57.61 ± 0.19 415.47 ± 0.23 208.80 ± 0.51
Co2 222.12 ± 0.13 182.14 ± 0.21 124.75 ± 0.15 116.02 ± 0.14 316.68 ± 0.18 288.29 ± 0.19
aValues are the average of at least three determinations (n = 3). 1 = 9,10-Dihydrophenantrene; 2 = n-nonadecane; 3 = nonadecanoic acid; 4 = mixture of
The EPS production was observed in all assays although the produced amount depended on the carbon source and microbial consortium (Table 1), as previously reported in the literature.7,14 The best carbon source for EPS production was P1 with microbial consortium 1 (Co1, 415.47 mg of EPS g−1 of cell) and with microbial consortium 2 (Co2, 316.68 g of EPS g−1 of cell). Both results were obtained after 10 days of incubation.
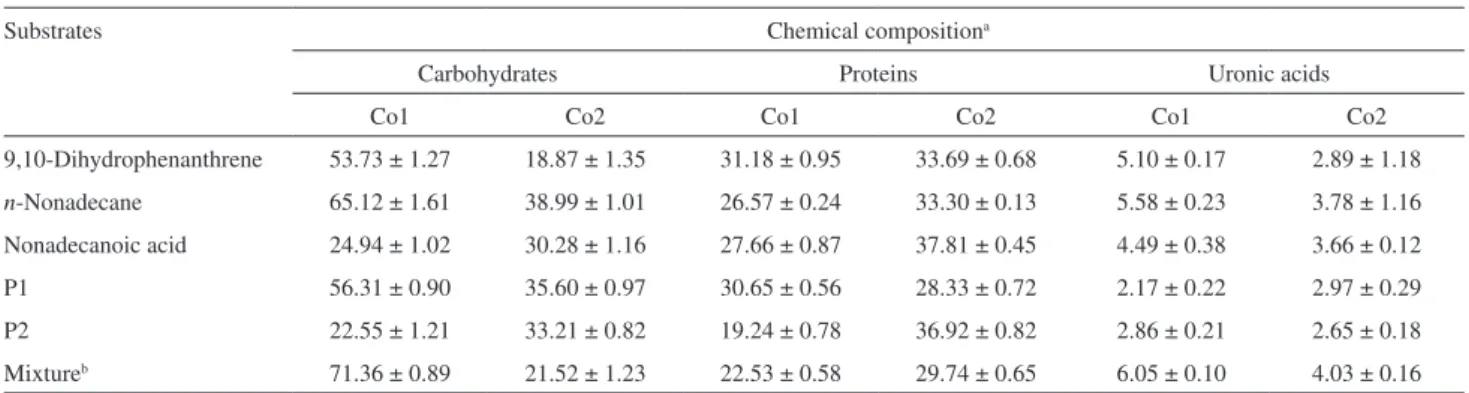
The crude EPS produced by these consortia were characterized by colorimetric analyses to determine the
percent contents of protein, carbohydrate and uronic acid (Table 2). The composition of the exopolimeric substances depends on the carbon source and on the microorganisms. For example, the EPS produced by consortium 1 (Co1) had higher carbohydrate content when growing on the mixture of 1, 2 and 3 (71.36 mg mL−1). However this situation was different with Co2, which produced EPS with high carbohydrate content when growing on n-nonadecane. In general, the EPS produced by Co1 had higher carbohydrate and uronic acid contents while the EPS produced by Co2 had higher protein content.
Banat7 and Sutherland25 have reported that EPS chemical composition is strongly inluenced by the microorganisms, environment and growing conditions, and that the EPS chemical characteristics produced by microorganisms in pure cultures and in consortia are different. To our knowledge no general rule has yet been established for the production and composition of EPS.
The infrared spectroscopic analysis of the crude EPS produced by the aerobic consortium revealed the presence of OH, NH, CH2/CH and carbonyl group absorption bands at 3498, 3422, 2928-2861 and 1650 cm−1 respectively. These absorption bands are characteristic of biosurfactants belonging to the class of lipoproteins like surfactin, iturin, fengycin, liquenisin, mycosubtilin and bacillomycin, usually produced by Bacillus. These are known for their antimicrobial activity.26,27 These compounds are characterized by the presence of a polypeptide macrocycle linked to a fatty acid.26
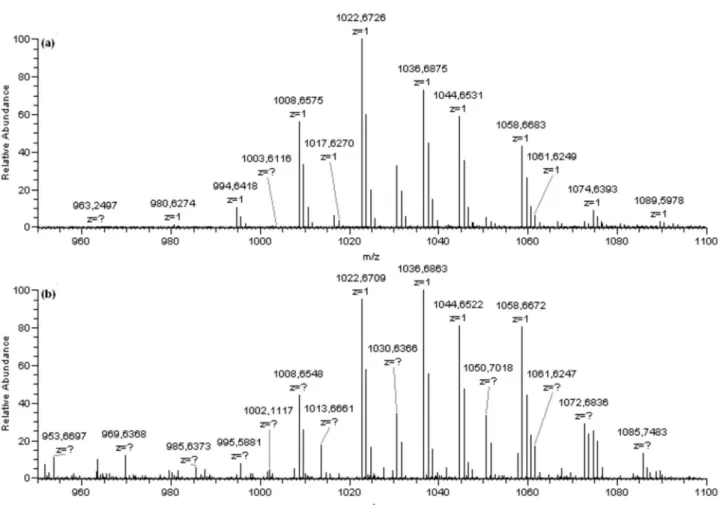
The high resolution mass spectrum by direct insertion with electrospray ionization (ESI-MS) revealed the presence of protonated species of surfactin isoforms (Figure 3), as well as surfactins linked to sodium (m/z 1044 and 1058) and to potassium (m/z 1074).
Ongoing experiments focus on the production of larger amounts of surfactin in order to characterize the isoforms by 1D and 2D NMR spectra.
Figure 2. Growth curve of consortia Co2 with different substrates.
Figure 1. Growth curve of consortia Co1 with different substrates
Table 2. Chemical composition of EPS synthesized by aerobic consortia growing in medium with glucose and supplemented with substrates
Substrates Chemical compositiona
Carbohydrates Proteins Uronic acids
Co1 Co2 Co1 Co2 Co1 Co2
9,10-Dihydrophenanthrene 53.73 ± 1.27 18.87 ± 1.35 31.18± 0.95 33.69 ± 0.68 5.10 ± 0.17 2.89 ± 1.18
n-Nonadecane 65.12 ± 1.61 38.99± 1.01 26.57 ± 0.24 33.30 ± 0.13 5.58 ± 0.23 3.78 ± 1.16
Nonadecanoic acid 24.94 ± 1.02 30.28 ± 1.16 27.66 ± 0.87 37.81± 0.45 4.49 ± 0.38 3.66 ± 0.12
P1 56.31 ± 0.90 35.60 ± 0.97 30.65 ± 0.56 28.33 ± 0.72 2.17 ± 0.22 2.97 ± 0.29
P2 22.55 ± 1.21 33.21 ± 0.82 19.24 ± 0.78 36.92 ± 0.82 2.86 ± 0.21 2.65 ± 0.18
Mixtureb 71.36± 0.89 21.52 ± 1.23 22.53 ± 0.58 29.74 ± 0.65 6.05± 0.10 4.03± 0.16
The interfacial activity of these biosurfactants was assessed by determining their emulsiication indexes (E) with different solvents and surface tension of their solutions (ST) were measured using air/water and air/Zinder medium as controls (Figures 4 and 5).
Consortium Co1 produced 415.47 mg of EPS g-1 of cells using P1 as substrate and reduced water ST and Zinder medium ST from 72.4 and 55.7 mN m-1, respectively, to 28.6 mN m-1. With P2 as the sole carbon source this consortium produced 208.80 mg EPS g-1 of cells and was slightly less
surface active, reducing the water and Zinder medium ST to 30.1 mN m-1. Analogous results were also obtained with Co2 using either P1, P2 or 9,10-dihydrophenanthrene as carbon source. The EPS production was 316.68, 288.29 and 222.12 mg EPS g-1 of cells and the water and Zinder medium ST were 30.4, 31.2 e 33.7 mN m-1, respectively. From these results it was concluded that Co1 produced EPS in higher yield than Co2, with greater surface activity and was more sensitive to the carbon source. It is well known that different microorganisms and different consortia of
Figure 3. Mass spectrum of (a) commercial surfactin standard and (b) biosurfactant produced from aerobic consortia after 5 days of incubation.
Figure 5. Surface tension (ST) of consortia Co2 with different substrates.
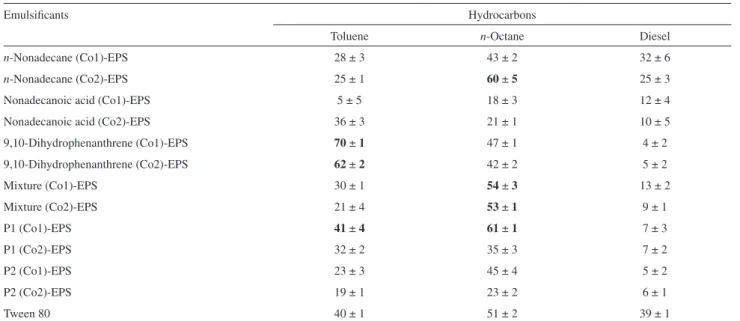
Table 3. Emulsiication index (E24%) of EPS produced from Co1 and Co2 using toluene, n-octane and diesel
Emulsiicants Hydrocarbons
Toluene n-Octane Diesel
n-Nonadecane (Co1)-EPS 28 ± 3 43 ± 2 32 ± 6
n-Nonadecane (Co2)-EPS 25 ± 1 60 ± 5 25 ± 3
Nonadecanoic acid (Co1)-EPS 5 ± 5 18 ± 3 12 ± 4
Nonadecanoic acid (Co2)-EPS 36 ± 3 21 ± 1 10 ± 5
9,10-Dihydrophenanthrene (Co1)-EPS 70 ± 1 47 ± 1 4 ± 2
9,10-Dihydrophenanthrene (Co2)-EPS 62 ± 2 42 ± 2 5 ± 2
Mixture (Co1)-EPS 30 ± 1 54 ± 3 13 ± 2
Mixture (Co2)-EPS 21 ± 4 53 ± 1 9 ± 1
P1 (Co1)-EPS 41 ± 4 61 ± 1 7 ± 3
P1 (Co2)-EPS 32 ± 2 35 ± 3 7 ± 2
P2 (Co1)-EPS 23 ± 3 45 ± 4 5 ± 2
P2 (Co2)-EPS 19 ± 1 23 ± 2 6 ± 1
Tween 80 40 ± 1 51 ± 2 39 ± 1
Bold values: Emulsiier activity similar to or better than that of Tween 80 (reference surfactant).
Table 4. Rate of biodegradation by consortia of each substract
Consortia Biodegradation (%)
Substrates
9,10-Dihydrophenanthrene n-Nonadecane Nonadecanoic acid Mixturea P1
Co1 53 ± 1.21 98± 0.12 51 ± 0.05 72 ± 1.20 42 ± 1.75
Co2 51 ± 0.10 63 ± 0.82 54 ± 1.02 96± 0.16 35 ± 1.98
microorganisms produce surfactants with distinct physic-chemical characteristics.8 Interestingly, in comparison with Tween 80, these biosurfactants display good emulsifying properties with an aromatic and with an aliphatic solvent, but not with a mixture of them such as diesel oil. This may be ascribed to the presence of other natural surfactants in diesel samples, which may compete with the biosurfactants.
The emulsifying eficiency of these biosurfactants was also evaluated by their emulsiication index (E-24 h)23 revealing that the highest E value (E = 70%) was achieved with toluene and using 9,10-dihydrophenanthrene as carbon source for the production of surfactant. Compared to Tween 80, the surfactants produced with Co2 and n-nonadecane, and Co1 and Co2 with 9,10-dihydrophenanthrene displayed better performances (ranging from 41 to 70%,as can be seenTable 3).
Interest in biosurfactants has increased in recent years and our results certainly indicate that further investigation is needed to fully characterize the structures of the surfactants produced and to evaluate their range of possible industrial applications including enhanced oil recovery, bioremediation of water-insoluble pollutants and health-care.8
Finally, in the comparison of EPS production and biodegradation the results using petroleum (P1 and P2) as carbon source were not considered because crude oil has micro-constituents that are important to the petroleum isolated microorganisms survival that are not present in commercial culture media. Therefore the EPS production and biodegradation of 1, 2, 3 and 4 by microorganisms present in consortia Co1 and Co2 showed that Co1 produced more EPS with 2 (n-nonadecane, Table 1) and this was the substrate most eficiently biodegraded by Co1 (Table 4). However, this trend is not observed with Co2 which showed a good EPS production with 1
(9,10-dihydrophenanthrene, Table 1) and best degraded 2
(Table 4).Consequently the eficiency of EPS production (Table 1) and of biodegradation (Table 4) of the carbon source are not necessarily similar.
Conclusion
reduction, confirming their interfacial activity and enabling their use for emulsifying purposes. We consider that the eficiency of biodegradation and production of biosurfactant are not necessarily consistent. These results indicate better consortium eficiency, when compared to isolated microorganism biodegradation and bioremediation processes. To the best of our knowledge no general rule has yet been established for the production and composition of EPS.
Acknowledgments
This work is part of the multidisciplinary project BIOPETRO supported by FINEP and PETROBRAS. G. F. da Cruz and C. F. F. Angolini were supported by grants from CAPES (Coordenação de Aperfeiçoamento de Pessoal de Nível Superior). We thank PETROBRAS for the authorization to publish this work. We also thank Prof. Carol Collins for helpful suggestions in style and grammar.
References
1. Providenti, M. A., Flemming, C. A., Lee, H., Trevors, J. T.;
FEMS Microbiol. Ecol. 1995, 17, 15.
2. Koch, A. K., Kappeli, O., Fiechter, A., Reiser, J.; J. Bacteriol.
1991, 173, 4212.
3. Barkay, T.; Navon-Venezia, S.; Ron, E. Z.; Rosenberg, E.; Appl. Environ. Microbiol. 1999, 65, 2697.
4. Kanga, S. A.; Bonner, J. S.; Page, C. A.; Mills, M. A.; Autenrieth, R. L.; Environ. Sci. Technol. 1997, 31, 556.
5. Zhang, Y. M.; Miller, R. M.; Appl. Environ. Microbiol.1994,
60, 2101.
6. Rosenberg, E.; Crit. Rev. Biotechnol. 1986, 3, 109. 7. Banat, I. M.; Bioresour. Technol. 1995, 51, 1.
8. Banat, I. M.; Makkar, R. S.; Cameotra, S. S.; Appl. Microbiol. Biotechnol. 2000, 53, 495.
9. Kumar, M.; León, V.; De Sisto Materano, A.; Ilzins, O. A.; World J. Microbiol. Biotechnol. 2007, 23, 211.
10. Martínez-Checa, F.; Toledo, F. L.; El Mabrouki, K.; Quesada, E.; Calvo, C.; Bioresour. Technol. 2007, 98, 3130.
11. Zhang, Y. M.; Maier, W. J.; Miller, R. M.; Environ. Sci. Technol.
1997,31, 2211.
12. Foght, J. M.; Gutnick, D. L.; Westlake, D. W. S.; Appl. Environ. Microbiol. 1989, 55, 36
13. Queiroga, C. L.; Nascimento, L. R.; Serra, G. E.; Braz. J. Microbiol. 2003, 34, 321.
14. Abalos, A.; Viñas, M.; Sabaté, J.; Manresa, M. A.; Solanas, A. M.; Biodegradation, 2004, 15, 249.
15. Sugiura, K.; Ishihara, M.; Shimauchi, T.; Environ. Sci. Technol.
1997, 31, 45.
16. Peters, K.; Moldowan, M.; The Biomarkers Guide. Interpreting Molecular Fossils in Petroleum and Ancient Sediments.
Prentice-Hall: Englewood Cliffs, New Jersey,1993.
17. Zinder, S. H.; Cardwell, S. C.; Anguish, T.; Lee, M.; Koch, M.;
Appl. Environ. Microbiol.1984, 47, 796.
18. Da Cruz, G. F.; Santos Neto, E. V.; Marsaioli, A. J.; Org. Geochem. 2008, 39, 1204.
19. Quesada, E.; Béjar, V.; Calvo, C.; Experientia 1993,49, 1037. 20. Dubois, M.; Guilles, K. A.; Hamilton, J. K.; Rebers, P. A.; Smith,
F.; Anal. Chem. 1956, 28, 350.
21. Bradford, M. M.; Anal. Biochem. 1976, 72, 248.
22. Blumenkrantz, N.; Asboe-Hansen, G.; Anal. Biochem. 1973,
54, 484.
23. Cooper, D. G.; Goldenberg, B. G.; Appl. Environ. Microbiol.
1987, 53, 224.
24. Rahman, K. S. M.; Rahman, T. J.; Kourkoutoas, Y.; Petsas, I.; Marchant, R.; Banat, I. M.; Bioresour.Technol.2003, 90, 159. 25. Sutherland, I. W.; Bioresour. Technol. 2001, 98, 3130. 26. Maier, R. M.; Adv. Appl. Microbiol.2003, 52, 101. 27. Steller, S.; Valter, J.; J. Chromatogr., B2000, 737, 267.
Received: October 19, 2009
Web Release Date: April 15, 2010