online | memorias.ioc.fiocruz.br
Dynamics of the 2006/2007 dengue outbreak in Brazil
Giovanini E Coelho, Marcelo Nascimento Burattini1/+, Maria da Glória Teixeira2, Francisco Antonio Bezerra Coutinho1, Eduardo Massad/1,3
Programa Nacional de Controle da Dengue, Ministério da Saúde, Brasília, Brasil 1Faculdade de Medicina, Universidade de São Paulo, R.
Teodoro Sampaio 115, 05405-000 São Paulo, SP, Brasil 2Instituto de Saúde Coletiva, Universidade Federal da Bahia, Salvador, BA, Brasil 3London School of Hygiene and Tropical Medicine, London, UK
We analyzed dengue incidence in the period between October 2006-July 2007 of 146 cities around the country were Larval Index Rapid Assay (LIRA) surveillance was carried out in October 2006. Of these, we chosen 61 cities that had 500 or more cases reported during this period. We calculated the incidence coefficient, the force of infec-tion (λ) and the basic reproduction number (R0) of dengue in those 61 cities and correlated those variables with the LIRA. We concluded that λ and R0 are more associated with the number of cases than LIRA. In addition, the average R0 for the 2006/2007 dengue season was almost as high as that calculated for the 2001/2002 season, the worst in Brazilian history.
Key words: dengue - larval index - basic reproduction number - force of infection
Dengue fever (DF), a Flaviridae infection transmit-ted by peridomestic Aedes aegypti (Gubler & Kuno 1997) re-appeared as a major urban epidemic in Brazil in 1986 (Marques et al. 1994, Massad et al. 2001, Luz et al. 2003) and is currently the most important arthropod-borne viral disease in Brazil (Luz et al. 2003). By the year 2000, all 26 states had reported DF cases. In the pe-riod 1986-2007, DF caused 4,559,812 officially reported cases (MS 2007a) with 493 deaths (MS 2007b).
The worst year in history was 2002, with the intro-duction of DEN-3, when 794,219 cases were reported. In the following years, DEN-3 spread itself throughout the country, causing several important outbreaks (MS 2007c). In 2006, 345,922 dengue cases were reported, with 682 dengue hemorrhagic fever (DHF) cases causing 76 deaths (MS 2007c). From January to July 2007, 438,949 classical DF cases were reported, with 926 cases of DHF, causing 98 deaths (MS 2007c). In this year DEN-3 virus caused 81% of the cases.
An important observation related to dengue trans-mission is that, in some subtropical areas like Brazil, the density of mosquitoes (Forattini et al. 1993a, b, 1995) and the number of DF cases starts to increase in number at the beginning of the rainy season (October) with the cases of dengue peaking more than three months later (Coutinho et al. 2006).
Long-term control of dengue and condition for out-break occurrence has relied mainly on larval index (LI), that is, the proportion of houses with breeding places harboring aedes larvae which, paradoxically, has not
Financial support: CNPq, FAPESP, LIM01 HC-FMUSP + Corresponding author: [email protected]
Received 28 February 2008 Accepted 21 July 2008
demonstrated a good correlation with the number of DF cases (Gubler & Kuno 1997, Burattini et al. 2007). One of the few studies that indirectly show some correla-tion between the house index and the number of dengue cases is the work by Cunha et al. (1997), in which it is suggested, although it is not demonstrated, a relationship between low number of cases and low house index in a community of Rio de Janeiro. In Brazil, an alternative approach to the so-called container indexes (German et al. 1980, Bang et al. 1981) for larval surveillance was proposed in order to optimize the logistics of its opera-tion. It consists of random sampling a relatively small number of dwellings in which surveillance of aedes-positive breeding places is carried out simultaneously in several cities around the country. This strategy has been called Larval Index Rapid Assay (LIRA).
In this paper we analyze the period October 2006-July 2007 of 146 Brazilian cities that carried out LIRA surveillance in October 2006. Of these, we choose those 61 cities that experienced 500 or more dengue cases in the period. We calculate the incidence coefficient (IC), the force of infection (λ) and the basic reproduction num-ber (R0) of dengue in those 61 cities and cross-correlate those variables along with the LIRA, in order to estimate which parameter related to the intensity of transmission is the best predictor of the number of cases.
MATERIALS AND METHODS
LIRA - Consisted in the simultaneous visit of dwell-ings randomly chosen of 146 cities representing all the Brazilian regions (MS 2005). LIRA is a random sam-pling technique in which the sample unit corresponds to 9,000 to 12,000 dwellings, from which a maximum of 450 houses are randomly selected for inspection. The LIs obtained are the proportion of houses with A. ae-gypti larvae and the Breteau index. It is being used in Brazil since 2003.
more reported cases and experienced a dengue outbreak in the period. By outbreak we understand the sudden ex-ponential rise in the number of cases in the beginning of the transmission season. The list of those 61 cities can be seen in Table.
The calculation of R0 can be carried out from the ini-tial exponenini-tial growing phase of the number of cases as detailed in Massad et al. (2001). However, we show in the appendix a summary of the derivation of R0 and λ.
From equations (5) and (6) of the appendix (Supple-mentary data) we obtain the relationship between R0 and
λ for each one of the 61 cities, such as:
R0= 1 + ––––––––––––λ2 + λ(μγ μ + γ)
In this equation, λ is the growing rate of the number of dengue cases in the initial exponential phase, the inci-dence rate or λ of the disease in this phase. By fitting the proportion of new cases to an exponential curve, we can estimate R0. The values of the parameters were µ = 0.156 weeks-1 and γ = 1 week-1 (Massad et al. 2001).
Statistical analysis - We fitted exponential curves by the method of the Minimum Squares to the number of cases in each week starting in October 2006 for each one of the 61 chosen cities. As mentioned above, the grow-ing rate of the number of cases in the initial exponential phase, λ corresponds to the incidence rate or λ of the disease in this phase (equation 4 of the appendix).
The IC per 100,000 inhabitants, λ and R0 of dengue in those 61 cities were correlated with their respective LIRA. As a first approximation to estimate the corre-lations between the variables, we carried out a linear regression analysis that correlated the LIRA versus λ; LIRA versus R0; LIRA versus IC; λ versus the IC; and R0 versus IC. The strength of the above correlations was estimated by the calculation of the Pearson’s correlation coefficients. Of course other functional associations be-tween the variables could serve the same purpose. How-ever, we chosen a linear regression because the correla-tions found were poor for all tested function and so we chosen the linear for simplicity. All the statistical analy-ses were carried out with the software SPSS 15.0.
RESULTS
Table shows the 61 cities analyzed with the respec-tive values of the LIRA, λ, R0, the population size, IC and the goodness of fit of the exponential model.
In Fig. 1 we show an example of a city (Paranavaí) that resulted in a particularly accurate fitting of dengue cases. Note the exponential shape of the fitted curve and the re-sulting incidence of 0.32 per capita new cases per week.
In Figs 2 and 3 we show the correlation between LIRA and λ and LIRA and the R0, respectively. Note that LIRA significantly correlates with both λ and R0.
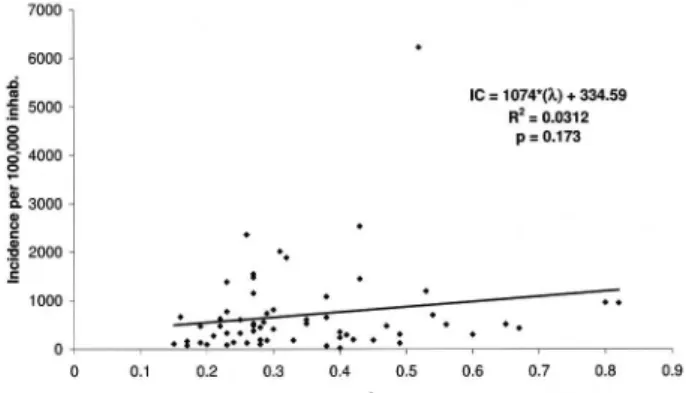
Finally, we tested the relation between LIRA, λ and R0 with dengue IC per 100,000 inhabitants for each city analyzed. Results are shown in Figs 4-6, respectively. It is noteworthy that LIRA correlates with both λ and R0 but none of them correlated with IC. Note also the
pres-Fig. 1: example of the exponential fitting for the number of dengue cases for the city of Paranavaí.
Fig. 2: correlation between LIRA and λ for the 61 cities analyzed.
Fig. 3: correlation between LIRA and R0 for the 61 cities analyzed.
TABLE
Results of the analysis with the 61 chosen Brazilian cities
City LIRA λ r p R0 dengue cases incidence
Uberlândia 0.44 0.15 0.810 < 0.001 2.26 682 110.83
Parnamirim 0.36 0.16 0.875 < 0.001 2.35 1.175 664.19
Duque de Caxias 1.79 0.17 0.798 < 0.001 2.45 664 76.58
Belford Roxo 2.85 0.17 0.934 < 0.001 2.45 834 167.73
Nova Iguaçu 1.96 0.19 0.901 < 0.001 2.64 1.154 134.48
Serra 3.58 0.19 0.673 0.007 2.64 1.908 470.61
Juiz de Fora 0.31 0.2 0.949 < 0.001 2.74 509 98.45
Vitória 3.49 0.21 0.962 < 0.001 2.84 888 276.79
Sabará 1.34 0.22 0.765 < 0.001 2.94 654 476.88
Rio Verde 1.90 0.22 0.963 < 0.001 2.94 872 626.44
Londrina 0.54 0.23 0.957 < 0.001 3.04 3.891 773.50
Brasília 1.37 0.23 0.919 < 0.001 3.04 2.157 88.62
Belém 1.63 0.23 0.821 < 0.001 3.04 4.812 331.70
Araguaína 2.06 0.23 0.970 < 0.001 3.04 1.838 1385.42
Manaus 1.65 0.24 0.973 < 0.001 3.15 2.504 144.57
Teresina 0.32 0.25 0.898 < 0.001 3.25 4.957 608.18
Belo Horizonte 1.78 0.25 0.977 < 0.001 3.25 8.037 331.52
São José do Rio Preto 1.66 0.26 0.979 < 0.001 3.36 10.012 2360.69
Vila Velha 2.67 0.26 0.856 0.002 3.36 541 130.57
Maracanaú 0.93 0.27 0.983 < 0.001 3.47 751 377.50
Araçatuba 1.25 0.27 0.981 < 0.001 3.47 2.117 1153.90
Cambé 1.34 0.27 0.924 < 0.001 3.47 1.484 1478.26
Campos dos Goytacazes 2.18 0.27 0.818 < 0.001 3.47 2.103 485.58
Itaboraí 2.23 0.27 0.932 < 0.001 3.47 1.200 530.87
Niterói 2.30 0.27 0.887 < 0.001 3.47 7.423 1548.82
Contagem 1.10 0.28 0.979 < 0.001 3.58 619 100.94
Ribeirão das Neves 1.68 0.28 0.989 < 0.001 3.58 648 193.74
Barretos 2.86 0.28 0.969 < 0.001 3.58 501 450.76
Angra dos Reis 2.00 0.285 0.826 < 0.001 3.63 827 559.18
Aparecida de Goiânia 0.68 0.29 0.927 < 0.001 3.69 3.475 738.21
Betim 1.40 0.29 0.971 < 0.001 3.69 763 180.74
Parnaíba 0.92 0.3 0.965 < 0.001 3.80 1.183 813.64
Cabo Frio 2.72 0.3 0.941 < 0.001 3.80 708 412.95
Sobral 0.79 0.31 0.924 < 0.001 3.91 3.603 2013.79
Paranavaí 3.97 0.32 0.968 < 0.001 4.03 1.502 1883.46
São Luís 2.17 0.33 0.962 < 0.001 4.14 1.874 184.13
Resende 1.40 0.35 0.940 < 0.001 4.38 743 608.92
Goiânia 3.14 0.35 0.948 < 0.001 4.38 6.503 524.58
Guarulhos 0.65 0.38 0.919 0.002 4.74 864 65.70
Fortaleza 1.10 0.38 0.918 0.002 4.74 16.083 654.17
Macaé 2.01 0.38 0.906 < 0.001 4.74 1.784 1081.18
São Paulo 0.23 0.4 0.932 < 0.001 4.99 2.743 24.70
Rio de Janeiro 6.20 0.4 0.890 0.003 4.99 21.821 353.16
Governador Valadares 6.25 0.4 0.818 0.015 4.99 624 238.84
Montes Claros 4.22 0.41 0.970 < 0.001 5.12 1.052 296.05
Santos 0.89 0.42 0.673 0.03 5.24 830 198.36
Maringá 1.51 0.43 0.866 < 0.001 5.37 8.356 2533.66
Foz do Iguaçu 9.85 0.43 0.981 < 0.001 5.37 4.592 1449.71
Cascavel 1.09 0.45 0.872 < 0.001 5.63 543 187.29
Magé 2.72 0.47 0.918 < 0.001 5.90 1.149 475.37
Osasco 1.47 0.49 0.922 < 0.001 6.17 893 123.28
São Gonçalo 2.00 0.49 0.966 < 0.001 6.17 3.006 304.93
Campo Grande 1.71 0.52 0.980 < 0.001 6.59 48.574 6222.71
Macapá 1.06 0.53 0.580 0.04 6.73 4.544 1191.98
Piracicaba 1.85 0.54 0.937 < 0.001 6.87 2.608 700.94
Ribeirão Preto 3.92 0.56 0.964 < 0.001 7.16 2.867 504.83
Juazeiro do Norte 1.79 0.6 0.928 < 0.001 7.75 737 300.89
Coronel Fabriciano 7.42 0.65 0.947 < 0.001 8.53 543 512.40
Marília 1.13 0.67 0.929 < 0.001 8.84 978 428.69
Cáceres 6.86 0.8 0.908 0.008 11.03 877 956.23
Fig. 6: correlation between R0 and IC per 100,000 inhabitants for the
61 cities analyzed.
ence of an outlier in Figs. However, its presence does not change significantly the correlation between the variables analyzed, and so we decided to keep it in the analysis.
DISCUSSION
The 2006/2007 dengue season in Brazil was the most severe in number of cases since the 2001/2002 season. This is reflected by the values of R0 available so far. If we compare the average values of R0 for the years of 1991 (2.03, Marques et al. 1994), 2001 (6.29, Massad et al. 2001) and 2007 (4.51, Burattini et al. 2007) we con-clude that 2007 is closer to 2001 values than to 1991 as far as dengue intensity of transmission is concerned. We should stress here that the entire estimated LIRA used in this analysis refer to whole town averages, although den-gue, as many of the vector-borne infections, have hetero-geneous spatial distribution over the affected areas. This would theoretically underestimate the incidence, λ and R0 estimates (Coutinho et al. 1999). However, our model is based on known cases and our equations system is scale-invariant, that is, it could be expressed in terms of proportions or absolute numbers in an approximately ho-mogeneous area where the cases are happening. More-over, dengue control measures as proposed by the Bra-zilian National Program of Dengue Control, in spite of being aimed to cover whole towns, should prioritize the focuses where transmission is likely to occur.
Fig. 5: correlation between λ and IC per 100,000 inhabitants for the 61 cities analyzed.
The regression analysis indicates that, despite the low values obtained for the correlation coefficients, they are significant for the associations between LIRA and λ and LIRA and R0. Since LIRA is an entomologically derived variable and λ and R0 were estimated from human cases, it is noteworthy that there are weak, although significant correlations between them. To the best of our knowledge, this has not been demonstrated before. The correlations found between the entomological indexes and the estima-tors of the intensity of transmission are due to the fact that all indexes used are based on larval stages. These have to develop into the further stages until the adult mosquitoes that, in turn, have to bite infected individuals and the new susceptibles. It is, therefore, expected that the large num-ber of unknown parameters governing each step of that chain, would vary from place to place and from moment to moment and, therefore, would weakened those correla-tion. In spite of this, LIRA could be used as a proxy for the velocity of the following dengue epidemic growth. In addition, those regions with the higher R0 are those likely to experience major impact of future outbreaks, especial-ly when a new serotype starts to circulate.
However, when we try to calculate the association of these parameters with the incidence of dengue, none demonstrated to be significantly correlated with it. Nev-ertheless, when we compare the significance of the as-sociation between LIRA and incidence rate of dengue with the associations between λ and R0 and the incidence rate we observe that both λ and R0 are more correlated with incidence than LIRA. If we consider the large num-ber of variables associated with dengue transmission we should expect a poor association between each of the parameters analyzed and the incidence of the infection. However, in view of the p-values found for each of them, we may conclude that both λ and R0 are better predictors of the total number of cases than the LI currently used. This is probably so because λ and R0 are also related to human dengue epidemiological factors, such as previous dengue outbreaks and herd immunity effects, in addition to the entomological parameters.
We would like to emphasize the importance of the in-tensity of transmission parameters proposed in this work, namely λ and R0, both of which are more closely associ-ated with the total number of cases than the LIs, although far from being reliable predictors of incidence. However, they are clear indicators of the intensity of outbreaks and relatively easy to calculate in the particular situation in which the number of cases start to increase after a rela-tively long period with very small number of cases.
As mentioned above, the current predominant strain in Brazil is DEN-3. It would be interesting to include a comment on potential differences in the outcomes now that DEN-2 started to predominate in several states of the country. Certainly, the fact that a great cohort of suscep-tibles to DEN-2 is available would increase all the estima-tors of intensity of transmission analyzed in this study.
thropic and epidemiological vector role of Aedes scapularis in South-Eastern Brazil. Rev Saúde Pública 29: 199-207.
Germain M, Francy DB, Monath TP, Ferrara L, Bryan J, Salaun J-J, Heme G, Renaudet J, Adam C, Digoutte J-P 1980. Yellow fever
in The Gambia, 1978-1979; entomological aspects and epidemio
-logical correlations. Am J Trop Med Hyg 29: 929-940.
Gubler DJ, Kuno G 1997. Dengue and Dengue Hemorrhagic Fever. CABI publishing, Wallingford, 478 pp.
Luz PM, Codeço PT, Massad E, Struchiner CJ 2003. Uncertainties regarding dengue modeling in Rio de Janeiro, Brazil. Mem Inst Oswaldo Cruz 98: 871-878.
Marques CA, Forattini OP, Massad E 1994. The basic reproduction number for dengue fever in São Paulo state, Brazil: 1990-1991 epidemics. Trans R Soc Trop Med Hyg 88: 58-59.
Massad E, Coutinho FAB, Burattini MN, Lopez LF 2001. The risk of yellow fever in a dengue infested area. Trans R Soc Trop Med Hyg 95: 370-374.
MS-Ministério da Saúde 2005. Diagnóstico rápido nos municípios para vigilância entomológica de Aedes aegypti no Brasil – LIRAa, metologia para avaliação dos índices de Breteau e pre-dial (portuguese).Secretaria de Vigilância em Saúde, Programa Nacional de Controle da Dengue, Brasília, Brazil.
MS-Ministério da Saúde 2007a. Graphic showing the historical se-ries of reported dengue cases between 1980 and 2005. [cited 2007 Oct 13] Available from: http://portal.saude.gov.br/portal/arqui-vos/pdf/Graficos_DNC_dengue_verde.pdf.
MS-Ministério da Saúde 2007b. Graphic showing the historical series of mortality due to dengue cases between 1980 and 2005 [cited 2007 Oct 13]. Available from: http://portal.saude.gov.br/portal/ arquivos/pdf/Graficos_DNC_dengue_vermelho.pdf.
MS-Ministério da Saúde 2007c. Epidemiological Bulletin reporting the 2007 dengue outbreak in Brazil. [cited 2007 Oct 13]. Avail-able from: http://portal.saude.gov.br/portal/arquivos/pdf/den-gue_0210.pdf.
known for other LIs. However, the relation between LIRA and the rate of growth of dengue epidemic demonstrated herein is a new result and it is one of the most important results of this paper, since the results of LIRA obtained almost two months before the beginning of dengue out-breaks could serve as a guide for early intervention.
REFERENCES
Bang YH, Bown DN, Onwubiko AO 1981. Prevalence of larvae of potential yellow fever vectors in domestic water containers in south-east Nigeria. Bull WHO 59: 107-114.
Burattini MN, Chen M, Chow A, Coutinho FAB, Goh KT, Lopez LF, Ma S, Massad E 2007. Modelling the control strategies against dengue in Singapore. Epidemiol Infect 136: 309-319.
Coutinho FAB, Burattini MN, Lopez LF, Massad E2006. Threshold conditions for a non-autonomous epidemic system describing the population dynamics of dengue. Bull Math Biol 68:2263-2282. Coutinho FAB, Lopez LF, Massad E, Burattini MN, Struchiner CJ,
Azevedo-Neto RS 1999. Modelling heterogeneities in individual frailties in epidemic models. Math and Comput Modell 30: 97-115. Cunha V, Maspero RC, Miagostovich MP 1997. Dengue infection in
Paracambi, state of Rio de Janeiro, 1990-1995. Rev Soc Bras Med Trop 30: 379-383.
Forattini OP, Kakitani I, Massad E, Marucci D 1993a. Studies on mosquitoes (Diptera: Culicidae) and anthropic environment. 2. Immature stages research at a rice irrigation system location in South-Eastern Brazil. Rev Saúde Pública 27: 227-236.
Forattini OP, Kakitani I, Massad E, Marucci D 1993b. Studies on mosquitoes (Diptera: Culicidae) and anthropic environment. 4. Survey of resisting adults and synanthropic behaviour in South-Eastern Brazil. Rev Saúde Pública 27: 398-411.
Synan-online | memorias.ioc.fiocruz.br
Appendix - Let SH and IH be the number of suscep-tible and infectious individuals in a human population. Let also Smand Im be number of susceptible and infec-tious individuals, respectively, in a mosquito population. We can write (Massad et al. 2001):
(1)
In the first equation of system (1) a is the average num-ber of bites a mosquito inflicts in the human population, so that aNm is the total number of bites per unit of time and
b is the fraction of those bites that are actually infective for humans. Humans recover from infection with rate γ. Finally, only a fraction SH/NH of the infective bites is in susceptible individuals, resulting in new infections.
In the second equation of system (1) the extrinsic incu-bation period is represented by τ. Therefore, aSm(t-τ) is the
number of bites per unit time given by susceptible mos-quitoes in the instant(t-τ). A fraction IH/NH of those bites is in infected humans, producing infected mosquitoes, a fraction exp(-μτ) of which survives the extrinsic incuba -tion period τ to become infective for the rest of their lives. Mosquitoes are assumed to die by natural causes at a rate μ.
Dividing the first equation of system (1) by NH (total human population) and the second by Nm (total mosquito population) we have:
(2)
—— = maidiH mbSH-γiH
dt
—— = dim exp(-μλ)aSm(t-τ )iH-μim dt
—— = aNdIH m ––– b ––– -γIH dt
Im Nm
SH NH
—— = dIm exp(-μλ)aSm(t-τ )––– -μIm dt
IH NH
where m = Nm/NH and the lower case letters represent proportions.
At the beginning of an outbreak, we can assume that SH@ 1 and Sm(t-τ) @ 1 to get the linearized system
(3)
—— = maidiH mb-γiH
dt
—— = dim exp(-μλ)aiH-μim dt
whose general solution is
(4)
i
H = cH exp(λt)
im = cm exp(λt)
Taking the derivative of equations (4) and substitut -ing the result in equations (3) we get:
(5)
λ = –– [-(μ + λ) ± √((μ + γ)1 2- 4μγ+4ma2 b exp(-μτ))] 2
Remembering that R0 is
(6)
R0= ––––––––––––ma 2bexp(μ λ)
γ μ
Therefore, from equations (5) and (6) we obtain (Massad et al. 2001):
(7)
R0= 1 + –––––––––––– λ2 + λ(μ + γ)