Soraia Patrícia Caetano da Silva
Licenciatura em Biologia Molecular e Genética
Osteoclastogenesis, inflammatory cytokines and
biomarkers of bone metabolism in psoriatic arthritis
Dissertação para obtenção do Grau de Mestre em Bioquímica para a Saúde
Orientador: Elsa Vieira de Sousa, MD, JEFonseca’s Lab, Instituto de Medicina
Molecular, Faculdade de Medicina da Universidade de Lisboa Co-orientador: António Sebastião Rodrigues, PhD,
Faculdade de Ciências Médicas da Universidade Nova de Lisboa
Faculdade de Ciências Médicas da Universidade Nova de Lisboa
Osteoclastogenesis, inflammatory cytokines and biomarkers of bone metabolism in
psoriatic arthritis
Copyright © Soraia Patrícia Caetano da Silva
AGRADECIMENTOS
Quero em primeiro lugar agradecer ao Professor João Eurico Fonseca por me ter aceite na Unidade de Investigação em Reumatologia e à minha orientadora Elsa Sousa, por me ter mostrado como a área da reumatologia pode ser tão intrigante e interessante, integrando-me num projeto multidisciplinar.
Ao João Rodrigues, por se ter prontamente disponibilizado a ceder-me as células MG-63 e esclarecer as minhas dúvidas sobre o estabelecimento desta cultura.
À Irina Alho, por não só me ter disponibilizado as células hFOB 1.19, mas também pelo acompanhamento todo ao longo do estabelecimento da cultura de osteoblastos. Obrigada pelas conversas, palavras de incentivo e todo o apoio que me deste ao longo destes meses de altos e baixos.
Agradeço também ao Biobanco-IMM pelas amostras de controlos saudáveis cedidas neste estudo e por algumas colheitas de sangue de doentes. Às meninas do serviço de histologia e ao Vitor Proa que sempre responderam às minhas questões e me ajudaram no trabalho histológico. Aos funcionários do biotério de roedores, em especial à Joana Marques, Dolores Bonaparte, Iolanda Moreira e Carlos Silva, por toda a experiência que partilharam comigo sobre ratinhos e ratos.
À Susana Lopes da Silva, um sincero obrigada, pela disponibilidade de realizar todas as colheitas de sangue, mesmo quando eram em cima da hora e pela simpatia.
Aos meus colegas de laboratório Ana Lopes, Bruno Vidal e Rita Cascão, pelo esclarecimento de dúvidas e ajuda no trabalho prático do dia-a-dia.
Um agradecimento muito especial à Diana Fernandes por toda a ajuda, conselhos e truques que me deu desde o primeiro dia que cheguei à unidade.
Às meninas de mestrado que estiveram comigo durante toda a tese que partilharam comigo as angústias, os problemas e também as vitórias do trabalho laboratorial. Em especial à Ana Pereira que muito me ensinou sobre ratinhos e que todos os dias trazia uma boa disposição contagiante, obrigada pela cumplicidade e espírito de equipa. À Natacha Leonardo e à Renata Casimiro, pelo companheirismo e momentos de descontração partilhados.
Não posso deixar de agradecer aos meus amigos, que apesar de terem experienciado de longe esta minha aventura, nunca deixaram de me apoiar e acreditar em mim. Um especial obrigada à Cláudia, Maria Inês, Rita, Rui e Viviana, vocês são espetaculares!
Como não podia deixar de ser, agradeço à minha família, em especial aos meus pais, por todo o apoio que me deram, especialmente em alturas que cheguei a duvidar de mim mesma. Por acreditarem desde o início que tudo ia correr bem e que eu ia conseguir. Obrigada por tudo o que têm feito por mim.
ABSTRACT
Psoriatic arthritis (PsA) is a chronic inflammatory disease characterized by several manifestations involving the joints, enthesis and the skin. New bone formation after inflammation at enthesis site has been one of the most intriguing aspects of the disease. Cellular and molecular mechanisms in this process are still not completely understood.
This study aims to understand better the mechanisms underlying bone formation and resorption and the effect of non-steroid anti-inflammatory drugs (NSAIDs) in these processes. To access that, biomarkers of bone metabolism and inflammatory cytokines were measured in PsA patients’ serum before and after NSAID therapy. These selected biomarkers were bone turnover markers such as CTX-I and P1NP, osteoclast differentiation and activation factors RANKL and OPG, Wnt pathway inhibitors DKK-1 and SOST and pro-inflammatory cytokines IL-22, IL-23 and prostaglandin PGE2. In this context monocyte cell culture was also established after PBMC isolation from PsA patients and healthy controls. Monocytes were cultured in vitro under unstimulated and
stimulated conditions and two functional assays were performed: TRAP staining and resorption pit assay.
It was demonstrated that CTX-I and OPG serum levels in PsA patients were lower than controls. SOST levels were extremely decreased in comparison with controls, resembling the ankylosing spondylitis patients results already documented. Osteoclast assays confirmed the need of RANKL in stimulating osteoclastogenesis and that celecoxib seems to have an inhibitor role in this process.
RESUMO
A artrite psoriática (AP) é uma doença inflamatória crónica caracterizada por várias manifestações nas articulações, nas enteses e na pele. A formação de novo osso após inflamação nas enteses é um dos aspetos mais intrigantes desta doença. Os mecanismos celulares e moleculares deste processo ainda não são completamente conhecidos.
Este estudo tem como objetivo compreender melhor os mecanismos subjacentes à formação e reabsorção óssea, bem como o efeito de anti-inflamatórios não esteroides (AINEs) nestes processos. Para atingir este objetivo foram quantificados biomarcadores do metabolismo ósseo e citocinas inflamatórias em doentes AP, antes e após terapêutica com AINEs. Os biomarcadores selecionados foram marcadores de remodelação óssea como CTX-I e P1NP, fatores de diferenciação e ativação de osteoclastos como o RANKL e a OPG, inibidores da via de sinalização Wnt, nomeadamente o DKK-1 e a SOST e ainda citocinas pro-inflamatórias como a IL-22 e a IL-23 e a prostaglandina PGE2. Neste contexto foram também estabelecidas culturas celulares de monócitos, isoladas de doentes AP e de controlos saudáveis. Os monócitos foram cultivados in
vitro em condições não estimuladas e estimuladas e realizados dois ensaios funcionais:
coloração com TRAP e ensaio de reabsorção.
Foi observada uma diminuição nos níveis séricos de CTX-I e OPG em doentes AP em relação aos controlos. De igual forma os níveis séricos de SOST encontram-se significativamente mais baixos, em comparação com os controlos saudáveis. Estes valores de SOST são semelhantes aos dos doentes com espondilite anquilosante (EA), documentados anteriormente. Os ensaios com osteoclastos confirmaram a necessidade da presença de RANKL para estimulação da osteoclastogénese e que o celecoxib parece ter um papel inibitório neste processo.
TABLE OF CONTENTS
AGRADECIMENTOS ... iii
ABSTRACT... v
RESUMO ... vi
ABBREVIATIONS ... xi
INTRODUCTION ... 1
Psoriatic Arthritis ... 1
Prevalence and incidence ... 2
Symptoms and disease assessment... 3
Genetic and environmental factors ... 3
Classification ... 4
Treatment ... 4
Bone structure: osteoblasts, osteocytes and osteoclasts ... 5
Bone remodeling: a dynamic continuous process ... 8
Bone turnover markers ... 9
IL-22, IL-23 and the inflammation axis ... 10
HYPOTHESIS ... 13
AIMS ... 13
MATERIALS AND METHODS ... 14
Patients... 14
Biomarkers and cytokines of bone metabolism ... 14
Osteoclasts ... 15
PBMC isolation ... 15
Cell culture ... 15
MTT assay ... 17
TRAP staining ... 17
Resorption assay ... 18
Gene expression... 18
RNA extraction and quantification ... 18
cDNA synthesis ... 19
qPCR and gene expression quantification ... 19
Statistical analysis ... 20
Other methods ... 21
Osteoblasts ... 21
RESULTS ... 26
I. ELISAs: protein quantifications in serum ... 26
Patient characteristics ... 26
Inflammatory cytokines and biomarkers of bone metabolism ... 28
II. Osteoclast assays ... 36
Sample characteristics ... 36
Pre-osteoclast, osteoclast and pit counts ... 36
Gene expression ... 44
III. Other results ... 45
Osteoblasts ... 45
Animal mouse model of spondyloarthritis ... 47
DISCUSSION ... 51
Biomarkers and cytokines of bone metabolism ... 51
Osteoclast assays ... 55
Osteoblast cultures ... 58
Animal mouse model of spondyloarthritis ... 60
FUTURE WORK ... 62
REFERENCES ... 65
ANNEX I ... 77
ANNEX II ... 78
ANNEX III ... 79
ANNEX IV ... 81
INDEX OF FIGURES
Fig.1 – Representation of the entheseal organ ... 1
Fig.2 – Osteoblast development ... 6
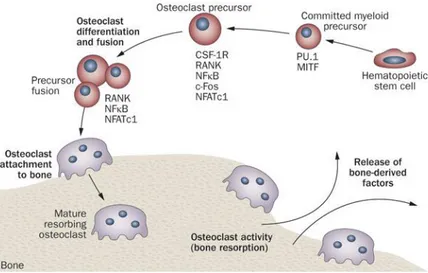
Fig.3 – Osteoclast development and activity ... 7
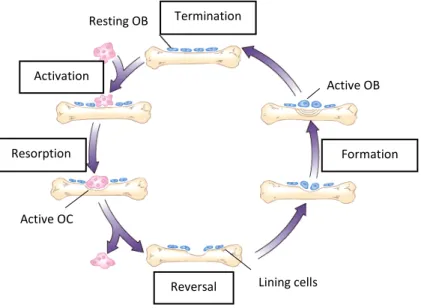
Fig.4 – Bone remodeling process ... 8
Fig.5 – The structure of collagen type 1 found in bone ... 10
Fig.6 – The interaction between IL-22 and IL-22 receptor complex ... 11
Fig.7 – Representation of IL-23 signaling complex ... 12
Fig.8 – PBMC gradient representation ... 15
Fig.9 – Design of 96 well culture plates with both unstimulated and stimulated conditions ... 16
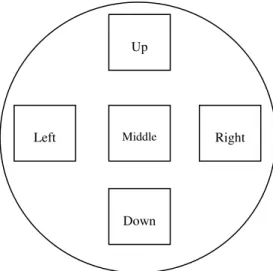
Fig.10 – Representation of a bone slice and its orientation ... 18
Fig.11 – Serum levels of CTX-I, P1NP and CTX-I/P1NP ratio ... 29
Fig.12 – Serum levels of sRANKL, OPG and sRANKL/OPG ratio ... 30
Fig.13 – Serum levels of DKK-1 and SOST ... 31
Fig.14 – Serum levels of IL-22, IL-23 and PGE2 ... 32
Fig.15 – Paired: serum levels of CTX-I, P1NP and CTX-I/P1NP ratio... 33
Fig.16 – Paired: serum levels of sRANKL, OPG and sRANKL/OPG ratio ... 34
Fig.17 – Paired: serum levels of DKK-1 and SOST ... 34
Fig.18 – Paired: serum levels of IL-22, IL-23 and PGE2 ... 35
Fig.19 – Representative image of pre-OC and OC with TRAP staining ... 37
Fig.20 – Representative image of resorption pits with toluidine blue staining ... 37
Fig.21 – Pre-OC, OC and resorption pits under stimulated and unstimulated conditions ... 38
Fig.22 – IL-22 optimization: number of pre-OC, OC and nuclei per OC ... 39
Fig.23 – IL-22 optimization: pit number and pit number per OC ... 40
Fig.24 – IL-22 optimization: percentage of resorbed area and resorbed area per pit ... 40
Fig.25 – Celecoxib stimulation: number of pre-OC, OC and nuclei per OC ... 41
Fig.26 – Celecoxib stimulation: pit number and pit number per OC... 42
Fig.27 – Celecoxib stimulation: percentage of resorbed area and resorbed area per pit ... 43
Fig.28 – Amplification and melt curves for housekeeping gene 18S rRNA ... 44
Fig.29 – Osteoblast cells: MG-63 and hFOB 1.19 cell lines ... 47
Fig.30 – Phenotype differences between a mTNF and a WT mouse... 48
Fig.31 – H&E staining ... 49
Fig.32 – IHC staining in spleen and in left front and hind paws ... 50
INDEX OF TABLES
Table I.1 – Demographic and clinical data of PsA and AS patients ... 27
Table I.2 – Demographic and clinical data of paired PsA patients ... 28
Table II.1 – Osteoclast cell culture conditions: unstimulated and stimulated ... 36
Table III.1 – Characteristics of MG-63 and hFOB 1.19 cell lines ... 46
Table I ANNEX I – CASPAR criteria ... 78
Table II ANNEX I – Primers used for RT-PCR ... 78
ABBREVIATIONS
AS Ankylosing spondylitis
ALP Alkaline phosphatase
BMD Bone mineral density
BMP Bone morphogenetic protein
CASPAR Classification criteria for psoriatic arthritis
CCP Cyclic-citrullinated peptide
cDNA Complementary DNA
CIA Collagen induced arthritis
CO2 Carbon dioxide
COX Cyclooxygenase
CRP C-reactive protein
CSF1R Colony stimulating factor 1 receptor
Ct Cycle treshold
CTX-I C-terminal telopeptide I
DAB 3,3'-diaminobenzidine
DC Dendritic cell
DIP Distal interphalangeal predominant
DKK-1 Dickkopf-related protein 1
DMARD Disease-modifying anti-rheumatic drug
DMEM Dulbecco's Modified Eagle's medium
DMSO Dimethyl sulfoxide
DNA Deoxyribonucleic acid
ELISA Enzyme-linked immunosorbent assay
ESR Erythrocyte sedimentation rate
FBS Fetal bovine serum
Fig. Figure
HEPES 4-(2-hydroxyethyl)-1-piperazineethanesulfonic acid
H&E Hematoxylin and eosin
HLA Human leukocyte antigen
HRP Horse radish peroxidase
HSC Hematopoietic stem cell
IBD Inflammatory bowel disease
IHC Immunohistochemistry
IL Interleukin
ILC Innate lymphoid cell
JAK1 Janus kinase 1
LTi Lymphoid tissue inducer
MAPK Mitogen-activated protein kinase
MCP-1 Monocyte chemotactic protein-1
M-CSF Macrophage colony-stimulating factor
MHC Major histocompatibility complex
MSC Mesenchimal stem cell
mTNF Membrane bound tumor necrosis factor
MTT 3-(4,5-Dimethylthiazol-2-yl)-2,5-Diphenyltetrazolium Bromide
NFATc1 Nuclear factor of activated T cells cytoplasmic 1
NF-kB Nuclear factor kappa-light-chain-enhancer of activated B cells
lsNK Natural killer
NSAID Nonsteroidal anti-inflammatory drug
NTC No template control
OA Osteoarthritis
OB Osteoblast
OC Osteoclast
OCN Osteocalcin
OCY Osteocyte
OPG Osteoprotegerin
OSX Osterix
P1CP Procollagen type 1 C propeptide
P1NP Procollagen type 1 N propeptide
PBS Phosphate buffered saline
pH Negative logarithm for hydrogen ion
PGE2 Prostaglandin E2
Pre-OC Pre-osteoclast
Ps Psoriasis
PsA Psoriatic arthritis
PTH Parathyroid hormone
qPCR Quantitative polymerase chain reaction
RA Rheumatoid arthritis
RANK Receptor activator of nuclear factor-kB
RANKL Receptor activator of nuclear factor kappa-B ligand
RF Rheumatoid factor
RGD Arginylglycylaspartic acid
RNA Ribonucleic acid
RORγt Retinoic acid-related oprhan receptor γ
RPMI Roswell Park Memorial Institute
rRNA Ribosomal ribonucleic acid
RT-PCR Reverse transcription polymerase chain reaction
SNP Single nucleotide polymorphism
SOST Sclerostin
SpA Spondyloarthritis
SPF Specific pathogen free
STAT3 Signal transducer and activator of transcription 3
TBE Tris/Borate/EDTA
TE Tris/EDTA
TNF Tumor necrosis factor
TRAP Tartrate-resistant acid phosphatase
TYK2 Tyrosine kinase 2
Wnt Wingless
INTRODUCTION
Psoriatic Arthritis
Psoriatic arthritis (PsA) is a chronic inflammatory disease characterized by several manifestations involving the joints, enthesis and the skin. In PsA, the enthesis has been recognized as a central and functional pathogenic organ (Fig. 1). New bone formation was documented at the enthesis were previous inflammation was detected. Concomitantly, inflammation occurs at the adjacent synovium tissue and increases synovial liquid production which results in swollen joints. Nevertheless the cellular and molecular pathways involved in this process are not well understood (Alvarez-Nemegyei and Canoso 2006).
Fig. 1– Representation of the entheseal organ (Adapted from Alvarez-Nemegyei & Canoso, 2006).
People of all ages can be affected by this disease, but its major incidence is in young adults. The diagnose is established mainly between 15-35 years old and the gender ratio is 1:1.3, being a little more common in women (Amherd-Hoekstra et al. 2010).
Differential diagnosis with RA is based in the presence of the RF although about 13% of PsA might be RF positive (Duarte, Faillace, and Freire de Carvalho 2012). In alternative cyclic citrullinated peptide (CCP) antibody test which is highly specific for RA can confirm the diagnosis. (Bas et al. 2003).
Prevalence and incidence
PsA shows ethnic and geographic variations, being more common in the colder north than in the tropics. PsA prevalence is higher in Europe and lower in Japan (Chandran and Raychaudhuri 2010).
In Europe there are different prevalences depending on the regions. That could be explained by ethnic variation, heterogeneity in study methods and difficulties with PsA classification. The prevalence ranges between 0.02% in Sweden and 0.42% in Italy. In the USA the estimated prevalence is 0.25%. Japan continues to have the lowest prevalence in the globe with only 0.00001%. In China the prevalence ranges between 0.01 and 0.1%. It was also reported a prevalence of 0.47% in Australia Aboriginal community (Chandran and Raychaudhuri 2010).
Another important estimative is the prevalence of patients that develop PsA once they have psoriasis (Ps). This percentage is very variable, it depends on many factors. Thus the range could be from 6 to 42%. If we study specific populations such as Italian patients, one can have a percentage between 7.7 to 36% (Chandran and Raychaudhuri 2010).
Symptoms and disease assessment
PsA can appear after, before or without the manifestation of skin disease-psoriasis. In 40% of the cases, patients also have the spinal column affected with spondylarthritis and sacroiliitis. PsA patients have manifestation at insertions of tendons, ligaments and capsules named enthesopathy. The insertion of Achilles tendon is the most commonly affected enthesis (Amherd-Hoekstra et al. 2010). Other symptoms involve joint deformation and destruction of joint cartilage and bone. In PsA osteoproliferation coexists at the same time with bone destruction. In this point PsA differs from RA where only erosive disease can be found. Furthermore, this disease is not exclusive of the joints, it can have as well extraarticular manisfestations such as uveitis.
Diagnosing PsA as quickly as possible is very important in order to give patients the right treatment. Diagnose can be made by searching for the common symptoms of PsA and by magnetic resonance or ultrasound exams when required. Skin biopsies, joint fluid and blood samples can be conducted as well to rule out other diseases. (Duarte, Faillace, and Freire de Carvalho 2012).
Genetic and environmental factors
Environmental risk in this pathology involves streptococcal pharyngitis, daily life stress, low humidity, drugs, HIV infection, trauma, smoking and obesity. Beyond that other associations have been demonstrated, as rubella vaccination, moving house, and HIV infection. Smoking has an interesting role in this disease. The time to develop PsA decreases with smoking, if psoriasis is not present, but when psoriasis is already present smoking increases PsA development time. IL13 gene polymorphisms are responsible for this behavior (Duffin et al. 2009), (Duarte, Faillace, and Freire de Carvalho 2012), (Chandran and Raychaudhuri 2010).
sacroiliitis or with distal interphalangeal predominant (DIP) (Chandran and Raychaudhuri 2010), (Barton 2002).
Classification
Nowadays the new criteria for PsA classification are based on CASPAR, Classification of Psoriatic Arthritis Criteria. These criteria have a sensitivity of 0.914 and a specificity of 0.987. The diagnostic criteria of Moll and Wright were widely used for its simplicity and efficacy but CASPAR criteria seem to have more specificity (Helliwell and Taylor 2005), (Wilson et al. 2009).
First of all, patients must have inflammatory articular disease (joints, axial involvement and enthesis) before CASPAR criteria can be applied. In order to fulfill CASPAR criteria patients must present 3 points from the 5 categories present in Table I in ANNEX I.
Treatment
An important NSAID frequently used is celecoxib. This drug is a cyclooxygenase-2 (COX-2) specific inhibitor. Prostaglandins are relevant mediators of many physiological processes and are derived from arachidonic acid via COX pathway (Tive 2000). Prostaglandin E2 (PGE2) plays an important role in this pathway, since it regulates many aspects in inflammation and functions of different immune cells. PGE2 can promote the activation, maturation and migration of dendritic cells (DCs), having a pro-inflammatory activity. This prostaglandin is produced by fibroblasts, epithelial cells and infiltrating inflammatory cells (Kalinski 2012). Currently it is known that NSAIDS can inhibit the conversion of arachidonic acid into prostaglandins by COX inhibition. COX has 2 isoforms, COX-1 and COX-2. COX-1 is constitutively expressed since it has physiological functions and COX-2 is only expressed in inflammatory context. Celecoxib has the capacity to specific inhibit the COX-2 isoform only, reducing inflammation on patients (Tive 2000).
Bone structure: osteoblasts, osteocytes and osteoclasts
Bone is a dynamic mineralized tissue that allows locomotion, support and protection of body soft tissues. The three main constituent cells are osteoblasts, osteoclasts and osteocytes. If in one hand osteoblasts are responsible for bone formation, on the other hand they also stimulate osteoclasts that resorb bone. Osteocytes derive from osteoblasts and constitute the majority of bone architecture (Florencio-silva et al. 2015), (Raggatt and Partridge 2010).
mineralization. Afterwards osteoblasts can undergo apoptosis or become osteocytes (Florencio-silva et al. 2015), (Raggatt and Partridge 2010).
Fig. 2 – Osteoblast development (Adapted from Osteoblast Differentiation and Mineralization,
PromoCell).
Osteocytes (OCY) are the most abundant cells in bone architecture, they represent 90-95% of total bone cells. These cells are located in the lacunae and present a dendritic morphology. As described before osteocytes derive from MSC lineage through osteoblast differentiation and have four differentiation stages: osteoid-osteocyte, pre-osteocyte, young osteocyte and mature osteocyte. Everytime a bone formation cycle takes place, some osteoblasts become osteocytes that incorporate into the bone matrix. This process can take up to 6 months. In mature osteocyte stage, the osteoblast markers such as OCN and COL1A are downregulated in contrast with osteocyte markers like sclerostin (SOST) that become expressed. Dickkopf-1 (DKK-1) is also very important, since it is a soluble inhibitor of Wnt pathway (Pinzone et al. 2014). Osteocytes have mechanosensitive functions that allow the detection of mechanical pressure and load, which helps the bone to adapt to daily mechanical forces. These functions are possible due to osteocytes position and network that allows bone cell communication (Florencio-silva et al. 2015), (Raggatt and Partridge 2010).
(RANKL) are the most important ones (Fig. 3). M-CSF is secreted by osteoprogenitor mesenchymal cells and osteoblasts and RANKL by osteoblasts, osteocytes and stromal cells. (Florencio-silva et al. 2015), (Raggatt and Partridge 2010), (Cappariello et al. 2014).
M-CSF acts by binding to its receptor (cFMS) which is present in osteoclast precursors and then stimulates their proliferation and inhibits apoptosis. RANKL is important to osteoclastogenesis. When it binds to its receptor RANK in osteoclast precursors, osteoclast formation is induced. Osteoprotegerin (OPG) is another factor that is produced by OBs and stromal cells. OPG can bind to RANKL and prevent RANK/RANKL interaction, this results in osteoclastogenesis inhibition (Florencio-silva et al. 2015), (Raggatt and Partridge 2010), (Cappariello et al. 2014).
Abnormal increase in osteoclast formation can lead to bone diseases such as osteoporosis, since the ratio bone formation/resorption is not balanced. Osteoclastogenesis deregulation can be a consequence of inflammatory arthritis causing erosions and systemic bone loss (Florencio-silva et al. 2015). If an increase in osteoclastogenesis causes severe damage, an increase in osteoblastogenesis is also as bad. Once osteoblastogenesis is higher than osteoclastogenesis, new bone formation takes place and can be very serious in terms of locomotion, for example bone formation at the enthesis, which sometimes happens in PsA patients.
Bone remodeling: a dynamic continuous process
Bone remodeling is a continuous process in life. In equilibrium, bone resorption and formation are well balanced in order to replace old bone by new tissue that can adapt to mechanical load (Florencio-silva et al. 2015), (Raggatt and Partridge 2010), (Hadjidakis and Androulakis 2006). This process depends on OBs, OCYs and OCs and is divided in five phases represented in Fig. 4.
Fig. 4– Bone remodeling process (Adapted from Wiley).
1. Activation: Before the activation, bone lining cells cover the bone surface. Then the endocrine bone remodeling signal, parathyroid hormone (PTH), binds to the PTH receptor present in pre-osteoblasts (Raggatt and Partridge 2010).
2. Resorption (2 weeks): pre-osteoclasts start to migrate to the bone surface where they form multinucleated osteoclasts. This happens in response to the PTH signaling, that promotes monocyte chemoattractant protein-1 (MCP-1) release from osteoblasts and recruits pre-osteoclasts. OPG expression is decreased at this phase and the production of M-CSF and RANKL increases to promote osteoclast maturation. After this, osteoclasts attach to the RGD (arginylglycylaspartic acid)-binding sites to create a localized microenvironment (sealed zone) that facilitates bone matrix degradation. Bone matrix degradation is possible due to collagenolytic enzymes with low pH such as cathepsin K and
Activation
Resorption
Reversal
Formation Termination
Resting OB
Active OB
Active OC
to hydrogen ions that are pumped into the sealed zone (Raggatt and Partridge 2010), (Cappariello et al. 2014).
3. Reversal/Transition (4-5 weeks): Mononuclear cells appear on the bone surface to prepare it for new osteoblasts, by removing demineralized undigested collagen, to begin bone formation and provide signals for osteoblast differentiation and migration (Florencio-silva et al. 2015), (Raggatt and Partridge 2010).
4. Formation (4 months): Mechanical stimulation and PTH signaling can promote bone formation via osteocytes that in resting conditions express sclerostin. Sclerostin binds to LRP5/6 and prevents Wnt signaling that induces bone formation. Mechanical strain on bone and PTH signaling, inhibit osteocyte expression of sclerostin. This inhibition allows Wnt signaling to work and promotes bone formation. Collagen type I is the first organic component of bone and the last is hydroxylapatite that is incorporated at the newly osteoid (Florencio-silva et al. 2015), (Raggatt and Partridge 2010).
5. Termination: Sclerostin expression increases and bone formation stops. The deposited osteoid, unmineralized organic portion of the bone matrix, is then mineralized and the bone surface returns to a resting state with bone lining cells (Raggatt and Partridge 2010).
Bone turnover markers
P1NP is a bone formation marker. Type 1 collagen constitutes 90% of bone proteins and is initially synthetized as type 1 procollagen. This type 1 procollagen undergoes cleavage to yield amino terminal (P1NP) and C-terminal propeptide of type 1 collagen (P1CP) as represented in Fig. 5 (Samoszuk, Leuther, and Hoyle 2008).
Fig. 5– The structure of collagen type 1 found in bone (Adapted from Samoszuk et al. 2008).
CTX-I is a bone resorption marker. This molecule is released during cathepsin K activity in the bone resorption process. Osteoclasts secrete a mixture of acid and neutral proteases that degrade the collagen fibrils into fragments, including CTX. During the bone aging, the alpha form of aspartic acid present in CTX is converted to the beta form β-CTX. This last form is then released into the bloodstream during bone resorption and becomes a specific marker for the degradation of the type I collagen (Garnero, Borel, and Delmas 2001), (Delmas et al. 2000).
IL-22, IL-23 and the inflammation axis
Concerning the inflammation, IL-22, IL-23 and also IL-17A are intimately connected. All these cytokines are pro-inflammatory, meaning they promote systemic inflammation.
is essential for the host defense against pathogens at mucosal surfaces and is also involved in wound healing. IL-10Rβ2 is ubiquitously expressed and IL-22Rα1 is expressed in liver, colon, small intestine, pancreas, kidney, skin and fibroblast like synoviocytes of joints (Rutz, Eidenschenk, and Ouyang 2013), (Yang and Zheng 2014), (Michalak-Stoma et al. 2011), (Nikoopour, Bellemore, and Singh 2014).
IL-22/IL-22Rα1/IL-10Rβ2 complex can trigger intracellular kinases such as JAK1, TYK2 and MAPK and also transcription factors, being STAT3 one of the most important (Yang and Zheng 2014). IL-22 forms dimers and binds to two IL-22Rα1 subunits and then induces phosphorylation of JAK1 and TYK2 as shown in Fig. 6, which leads to the activation of STAT3. STAT3 phosphorylation is essential in mediating the effects of IL-22 in intestinal epithelial cells (Nikoopour, Bellemore, and Singh 2014).
Fig. 6– The interaction between IL-22 and IL-22 receptor complex (Adapted from Sabat et al. 2013).
more IL-22 than activated peripheral blood T cells in PsA (Mitra, Raychaudhuri, and Raychaudhuri 2012).
IL-23 belongs to the IL-12 family and is expressed by activated monocytes, macrophages, dendritic cells, T cells, B cells and keratinocytes. The signaling pathway is established by interaction with a heterodimeric receptor complex composed by IL-12Rβ1 and IL-23R (Fig. 7). The full signal transmission requires phosphorylation of STAT1, STAT3, STAT5 and STAT4 mainly. Increasing interaction between IL-23 and IL-23R results in the proliferation of the differentiated Th17 cells that produce IL-17A. IL-23 can also regulate pro-inflammatory cytokines. IL-23 can stimulate antigen presentation by dendritic cells (DCs) and production of interferon-γ (IFN- γ) (Michalak-Stoma et al. 2011) , (Duvallet et al. 2011), (El Hadidi et al. 2008).
Fig. 7– Representation of IL-23 signaling complex (Adapted from Teng et al. 2015).
HYPOTHESIS
NSAIDs therapy alters bone resorption/formation through prostaglandin inhibition and cytokine modulation.
AIMS
1. To characterize bone metabolism parameters, cytokines and PGE2 serum levels in PsA patients, namely before and after NSAIDs;
2. To enhance osteoclastogenesis process in an inflammatory context in PsA patients and healthy controls;
MATERIALS AND METHODS
Patients
In this study were included PsA patients who fulfilled the CASPAR criteria. These patients were followed at the Department of Rheumatology, Hospital de Santa Maria, Centro Hospitalar Lisboa Norte, EPE. There were no restrictions regarding treatment options namely DMARDs and biologic therapy.
Ankylosing spondylitis (AS) patients fulfilling the 1984 Modified New York Criteria, were included as a comparator group.
All patients signed an informed consent and clinical data was registered at Reuma.pt.
For control purposes a group of age and sex-matched individuals were included. Blood samples were collected to isolate peripheral blood mononuclear cells (PBMCs) and for whole blood and serum storage.
Biomarkers and cytokines of bone metabolism
Osteoclasts
PBMC isolation
PBMCs isolation from PsA and healthy control subjects were isolated using a density gradient centrifugation. Whole blood tubes with heparin were diluted with phosphate buffered saline 1x (PBS) and then carefully layered in Ficoll-Paque (Histopaque 1077, Sigma-Aldrich, USA). The gradients went to centrifugation at 980g during 35 minutes at room temperature (RT) in a centrifuge (Eppendorf 5810R, Germany) without acceleration or brake. The mononuclear cell layer ring was collected and washed with PBS 1x (Fig. 8). Finally the viable cells were counted in a haemocytometer using trypan blue 0.1% (Sigma-Aldrich, USA).
Fig. 8– PBMC gradient representation. The ring represented in orange is collected and washed. After cell
counting, the amount required it plated in 96 well flat bottom plates.
Cell culture
and those for functional assays (TRAP staining and resorption pit assay) bone slices were added. Cells were seeded on top of bovine cortical bone slices (Immuno Diagnostic Systems Ltd, UK).
First medium exchange was performed at day 1 of culture. After this day unstimulated and stimulated conditions were created. In unstimulated condition only DMEM was added and in stimulated conditions several additions were established as represented in Fig. 9. After three days the medium was changed again and M-CSF (50 ng/mL,Peprotech, USA), sRANKL (100 ng/mL, Peprotech, USA), IL-22 (1, 10 and 50 ng/mL; Peprotech, USA) and celecoxib (1 and 10 µM, Sigma-Aldrich, USA) were added. From this time the culture medium was changed twice a week.
Fig. 9– Design of 96 wells culture plates with both unstimulated and stimulated conditions.
A Unstimulated condition, monocytes for RNA extraction at day 1 of culture. B Stimulated condition.
1) DMEM only, 2) DMEM+M-CSF, 3) DMEM+M-CSF+sRANKL, 4) DMEM+M-CSF+IL-22 1 ng/mL, 5) DMEM+M-CSF+IL-22 10 ng/mL, 6) DMEM+M-CSF+IL-22 50 ng/mL. C Stimulated condition.
7) DMEM+M-CSF+sRANKL+IL-22 1 ng/mL, 8) DMEM+M-CSF+sRANKL+IL-22 10 ng/mL,
9) DMEM+M-CSF+sRANKL+IL-22 50 ng/mL. Green, blue and red wells are for TRAP staining, RNA extraction, and resorption pit assays, respectively. D MTT assay performed at day 7 and 21 of culture to
assess cell viability.
A
C
B
D
Unstimulated
RNA day 1
Stimulated
Stimulated MTT assay days 7 and 21
1 2 3 4 5 6
7 8 9 1 2 3 4 5 6
MTT assay
The MTT cell proliferation assay was performed to determine cells’ viability during the experiment. MTT (3-(4, 5-dimethylthiazolyl-2)-2, 5-diphenyltetrazolium bromide) is a yellow reagent that is reduced by cells that are metabolically active. This results in a homogenous purple solution that can be measured by a spectrophotometer. This assay was prepared using MTT reagent (Biochemical Applichem, Germany) in a RPMI solution (Gibco, USA) at 1 mg/mL. The solution was added to the wells during 1h at 37°C. After, the plate is centrifuged at 250g for 5 minutes at RT and the supernatant is discarded. The plate is then incubated with DMSO (Merck, USA) during 10 minutes in the dark and with gentle agitation. The plate is ready for reading at 550 nm in the spectrophotometer Infinite M200 (Tecan, Switzerland).
TRAP staining
TRAP (Tartrate-resistant acid phosphatase) is an important cytochemical marker of osteoclasts. TRAP staining allows to mark and identify pre-OCs and OCs. This staining was performed using Acid Phosphate, Leucocyte Kit (TRAP, Sigma-Aldrich, USA) according to manufacturer’s instructions. Initially the cells in bone slices are fixated with a fixative solution composed of paraformaldehyde 4% and then incubated with TRAP substrate during 1h at 37°C, 5% CO2. TRAP substrate is a solution made of H2O, sodium nitrite, fast garnet, naphtol and acetate. These components make it possible to distinguish between pre-OCs (with <3 nuclei) and mature OCs (with ≥3 nuclei). Cell’s cytoplasm presents red colour in contrast to the nucleus with white colour, which remains unstained.
Fig. 10– Representation of a bone slice and its orientation. Cells were counted in the middle zone.
Resorption assay
In this functional assay, bone slices were washed with PBS 1x and then incubated with 5% sodium hypochlorite for 10 minutes. Bone slices were then incubated with toluidine blue 0.1% (Sigma-Aldrich, USA) in the dark for 2 minutes. Due to this reagent, the resorption pits will become blue in colour. The measurements of the pits area was done in the middle of the bone slices (Fig. 10) with an area of 1580.25x1185.19µm each. The resorption pits’ outlines were traced manually using ImageJ 1.48v Software (NIH, Bethesda, MD).
Photographs from both functional assays were taken with the brightfield microscope Leica DM2500 (Leica, Germany) under a 10x magnification objective.
Gene expression
RNA extraction and quantification
RNA was extracted from cells at days 1 and 21 from all the conditions in the OC cultures. At day 1 RNA extraction was performed using NZYol (NZYTech, Lda., Portugal) according to manufacturer’s instructions. Then chloroform (VWR, USA) was added and the mixture was centrifuged. After centrifugation, the organic phase on the
Up
Down
top of the two phase gradient was transferred to a new tube and incubated with isopropyl alcohol (VWR, USA) in order to precipitate the RNA. After the precipitation, RNA is washed with ethanol 75% and air dried. Finally the RNA was solubilized with RNase/DNase free water (Gibco, USA). At day 21, RNA was maintained in RLT Lysis Buffer (Qiagen, Germany) before extraction with NZYol.
RNA was afterwards quantified using Nanodrop 1000 (Thermo Scientific, USA) and its concentration and purity evaluated. RNA was stored at -80°C until use.
cDNA synthesis
The complementary cDNA was synthesized at a concentration of 15 ng/µL using the DyNAmo™ cDNA Synthesis Kit (Thermo Scientific, USA), according to manufacturer’s instructions. The synthesis was performed using reverse transcriptase M-MuLV RNase H+ and random hexamers. The PCR elongation phase started at 37°C during 30 minutes and the termination phase took place at 85°C during 5 minutes to inactivate the reverse transcriptase. cDNA was stored at 4°C.
qPCR and gene expression quantification
Quantitative PCR was used in this study in order to quantify osteoclast gene expression. The genes selected to study OCs were CTSK, RANK, CSF1R, NFATc1 and ribosomal RNA 18S as housekeeping gene. Primers were designed using the primer-BLAST (Ye et al. 2012) software and having into consideration the amplicon size of less than 100 bp, 60°C annealing temperature and the exon-exon junction. Primer sequences and characteristics can be found in Table II in ANNEX I.
same temperature. This last step is followed by a combined annealing/extension step at 60°C during 60 seconds, for 50 cycles. The final step is the melting curve, which allows the strands to denature in a gradual process. This step permits the curve validation. In order to analyze the results the 7500 Software v2.0.6 (Applied Biosystems, USA) was used.
The efficiency and results of the qPCR were analyzed using the standard curve method. To make the standard curves, cDNA templates from RNA trabecular bone from individuals with normal bone mineral density (BMD) and without clinical risk factors for osteoporosis or other bone related diseases were used. The initial cDNA quantity was 30 ng/mL and then serial 1:3 dilutions, down to 0.37 ng/mL, were made for the standard curve. The cycle threshold (Ct) is defined as the number of cycles required for the fluorescent signal to cross the threshold and exceed the background level. The efficiency of the qPCR should be 100%, which means that for each cycle the amount of product doubles. A good reaction should vary between 90-100% in efficiency, which corresponds to a slope between -3.58 and -3.10. The conversion of the Ct value in relative expression levels is performed with the slope and the Y intersect extracted from the standard curve and applying the equation 10(Ct-Y intersect)/slope (Wong and Medrano 2005). The values obtained should then be normalized with the housekeeping gene 18S rRNA.
Statistical analysis
Statistical analysis was performed using GraphPad Prism 5 Software (GraphPad Software, Inc., USA). Data is represented as median [interquartile range]. According to normality test distribution, for two variable comparison t-test or Mann-Whitney test were used. For paired variables Wilcoxon matched pairs test or paired t test, depending on the normality test distribution, were used as well. For more than two variables Kruskall-Wallis test was used with Dunn’s post hoc test. Categorical variables are expressed as relative frequencies and for them, Chi-Square test was used. P values
Other methods
Osteoblasts
The MG-63 cell line (Faculdade de Medicina Dentária do Porto, Portugal) was cultured in α-MEM (Gibco, USA) supplemented with 5000 U penicilin/streptomicin (Invitrogen, UK), 2.5 µg/mL amphotericin B (Sigma-Aldrich, USA) and 10% FBS (Invitrogen, UK) at 37°C, 5% CO2, for expansion.
For differentiation, cells were cultured in α-MEM (Gibco, USA) supplemented with 5000 U penicilin/streptomicin (Invitrogen, UK), 2.5 µg/mL amphotericin B (Sigma-Aldrich, USA), 50 µg/mL vitamin C (Fluka analytical, USA), 0.1 M β -glicerolphosphate (Fluka analytical, USA), 2 mM L-Glutamin (Invitrogen, UK) and 10% FBS (Invitrogen, UK) at 37°C, 5% CO2. Medium was changed every three days.
The hFOB 1.19 cell line (ATCC, USA) was cultured in DMEM:F12 (1:1) (Gibco, USA) supplemented with 5000 U penicilin/streptomicin (Invitrogen, UK), 0.3 mg/mL G418 (Biowest, France), 15 mM HEPES (Biowest, France) and 10% FBS (Invitrogen, UK) at 33.5°C, 5% CO2, for expansion.
Animal mouse model of spondyloarthritis
In parallel to the work developed in the study of PsA patients, which constitutes the main body of this thesis, further experience was acquired integrated in a complementary project studying membrane bound TNF (mTNF) mice, an animal model of spondyloarthritis.
4-6 weeks of age and become more severe over time. However they do not lose weight and can survive more than 8 months (van Duivenvoorde, Leonie M., van Tok, Melissa N., Baeten 2013).
Colony establishment and maintenance
mTNF mice are a heterozygous strain and for that reason breedings are done with C57BL/6J wild-type (WT) mice. The heterozygous animals came from Amsterdam Medical Center, University of Amsterdam. After the arrival breeding pairs were made, 2 females and 1 male per cage. The colony was not easy to establish, the animals were already 14 weeks old with visible phenotype. The first pups were born 7 weeks later. When these young animals became adults and able to reproduce, the first attempt to rederive the strain to a cleaner room, specific pathogen free (SPF), was made. It is known that the environment plays a crucial role in the microbiota of the animals and therefore can alter the way the disease is expressed. In a cleaner room, the animals should present the symptoms later. In order to maintain the strain for long term, rederivation is necessary, beyond the environment issues.
Many rederivations were done until a successful pregnancy was detected. Before the birth, the female selected for rederivation is subjected to a caesarean by the veterinary of the rodent facility. The pups are then put into a new cage with a foster mother, who had pups recently and can take care of these new ones.
Genotyping
As a heterozygous strain, all the pups resulting from the breedings should be genotyped. A piece of ear is taken for mice identification in the rodent facility and is harnessed as DNA sample. These pieces are then placed in a mixture of 100 µL of lysis buffer (Viagen, USA) and 1 µL of proteinase K (1 mg/mL; Sigma-Aldrich, USA) and incubated overnight at 55°C. Then the temperature is set to 85°C to inactivate proteinase K. These steps are followed by the PCR amplification and then the electrophoresis gel (see ANNEX II for protocol).
Monitoring
Each animal is monitored once a week. The monitoring is made after the weaning and mice genotyping and consists in weight measurement, paw score and annotations of observations considered relevant, like pregnancies and first symptoms appearance. All animals are photographed with emphasis in tail and paws.
The paw score is a 5 point score (0-4). According to the European Guidelines for Animal Experimentation, this score is based on increasing levels of swelling and periarticular erythema. The maximum score is defined as the sum of the scores for all the paws 16 (4+4+4+4):
0 - Normal
1– Erythema and swelling of one ankle
2 – Erythema and swelling of one ankle and proximal half of tarsal joints
Euthanasia
Mice euthanasia was done by CO2. After euthanasia, cardiac puncture was performed. The whole blood from the mice were incubated during 1h at 37°C in dry bath and then centrifuged to obtain serum for protein quantifications.
Necropsy
During the necropsy, front and hind paws were collected as well as L3/L4 and L5 vertebrae, cervical vertebrae that were damaged due to the hunchback, left and right tibias, left and right femurs and tail vertebrae that were crinkled. Considering the internal organs: large and small intestine portions, small intestine transition and cecum, spleen and liver were also collected.
For histology analysis in paraffin embedding organs were stored in cassettes and then in a container with formalin 10% during 5 days. Bone was decalcified with EDTA 10%, pH = 7.0, for 2 weeks. After, the tissue is processed which includes dehydration, clearing (replacing the dehydrant with a substance that will be miscible with the paraffin) and impregnation (the tissue is embedding in paraffin blocks). Then the blocks are ready to cut in the microtome.
Tissues were also stored in OCT (cryoprotective embedding medium), snap frozen (directly into liquid nitrogen) and in ethanol 70%.
H&E staining
Hematoxylin and eosin staining has 3 steps:
2 – Staining: Hematoxylin is added to the slides (200 µL) and incubated during 5 minutes. After the incubation, slides are washed in running water in reverse position. Then the slides are incubated in distilled water during 5 minutes. Eosin is added (400µL) and incubated during 30 seconds. The slides are washed in running water in reverse position and then incubated during 5 minutes in distilled water.
3 – Dehydration: the same steps as hydration but in inverse order. First comes 70% ethanol during 30 seconds, then 95% ethanol during 30 seconds as well, next step is 100% ethanol for 30 seconds and last step is xylene during 15 minutes. After this the slides are mounted and left to dry.
Immunohistochemistry (IHC)
Before performing IHC to different animals, it is necessary to optimize protocols for inflammatory cells and bone markers. Optimizations were done to the following antibodies: CD3 (T cells marker), CD19 (B cell marker), CD68 (monocytes/macrophages marker), CD163 (monocytes/macrophages marker) and SOST (osteocyte marker).
RESULTS
I. ELISAs: protein quantifications in serum
Patient characteristics
This study included 26 patients diagnosed with PsA, 16 men and 10 women. The median age of the patients was 48.5 [34-60] years and the median of symptoms duration was 2.5 [0.81-5] years, as shown in Table I.1. From these 26 patients, 12 of them were followed after NSAID therapy. Six AS patients were also recruited as disease comparators, 3 men and 3 women with a median age of 42 [31.75-49] years and a median of symptoms of 13.5 [5-26.5] years. Twenty three healthy age and gender matched subjects were included as controls as well, 10 men and 13 women with a median age of 45 [35-52] years.
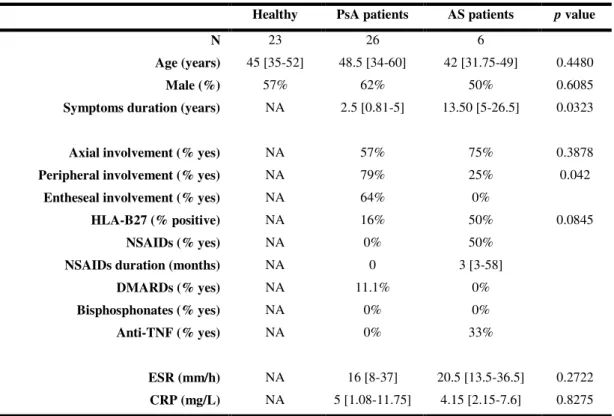
Table I.1– Demographic and clinical data of PsA and AS patients.
Healthy PsA patients AS patients p value
N 23 26 6
Age (years) 45 [35-52] 48.5 [34-60] 42 [31.75-49] 0.4480
Male (%) 57% 62% 50% 0.6085
Symptoms duration (years) NA 2.5 [0.81-5] 13.50 [5-26.5] 0.0323
Axial involvement (% yes) NA 57% 75% 0.3878 Peripheral involvement (% yes) NA 79% 25% 0.042
Entheseal involvement (% yes) NA 64% 0%
HLA-B27 (% positive) NA 16% 50% 0.0845
NSAIDs (% yes) NA 0% 50%
NSAIDs duration (months) NA 0 3 [3-58]
DMARDs (% yes) NA 11.1% 0%
Bisphosphonates (% yes) NA 0% 0%
Anti-TNF (% yes) NA 0% 33%
ESR (mm/h) NA 16 [8-37] 20.5 [13.5-36.5] 0.2722 CRP (mg/L) NA 5 [1.08-11.75] 4.15 [2.15-7.6] 0.8275
Results are expressed in median [interquartile range 25-75]. p values lower than 0.05 are considered
statistically significant. PsA – psoriatic arthritis; AS – ankylosing spondylitis; NA – not applicable; NSAIDs – non-steroidal anti-inflammatory drugs; DMARDs – disease-modifying anti-rheumatic drugs; ESR – erythrocyte sedimentation rate; CRP – C-reactive protein.
From this group of patients, only AS was previously treated with NSAIDs (50%) and anti-TNF therapy (33%) and a small percentage (11.1%) of PsA was under DMARDs. None of the patients was under bisphosphonates. Inflammatory markers, ESR and CRP, were both increased in the two diseases and when compared, the values are similar (Table I.1).
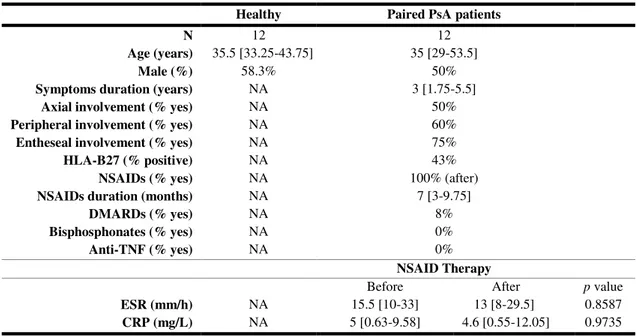
Table I.2– Demographic and clinical data of paired PsA patients.
Healthy Paired PsA patients
N 12 12
Age (years) 35.5 [33.25-43.75] 35 [29-53.5]
Male (%) 58.3% 50%
Symptoms duration (years) NA 3 [1.75-5.5]
Axial involvement (% yes) NA 50%
Peripheral involvement (% yes) NA 60%
Entheseal involvement (% yes) NA 75%
HLA-B27 (% positive) NA 43%
NSAIDs (% yes) NA 100% (after)
NSAIDs duration (months) NA 7 [3-9.75]
DMARDs (% yes) NA 8%
Bisphosphonates (% yes) NA 0%
Anti-TNF (% yes) NA 0%
NSAID Therapy
Before After p value
ESR (mm/h) NA 15.5 [10-33] 13 [8-29.5] 0.8587 CRP (mg/L) NA 5 [0.63-9.58] 4.6 [0.55-12.05] 0.9735
Results are expressed in median [interquartile range 25-75]. p values lower than 0.05 are considered
statistically significant. PsA – psoriatic arthritis; NA – not applicable; NSAIDs – non-steroidal anti-inflammatory drugs; DMARDs – disease-modifying anti-rheumatic drugs; ESR – erythrocyte sedimentation rate; CRP – C-reactive protein.
NSAID therapy was present in all patients (100% in Table I.2) only in the follow up. After the beginning of the therapy the median duration was 7 [3-9.75] months. Only 8% of the subjects were under DMARDs and none was under bisphosphonates or anti-TNF therapies.
Inflammatory markers, ESR and CRP, seem to have slightly decreased after NSAID therapy but the p value is almost 1, indicating that the results are similar
between before and after.
Inflammatory cytokines and biomarkers of bone metabolism
In order to understand better the activation of bone metabolism pathways in PsA patients, different biomarkers of bone turnover, bone remodeling, Wnt pathway and pro-inflammatory cytokines were determined.
the ratio between CTX-I and P1NP, the levels are decreased in patients with significant
p values.
Fig. 11– Serum levels of CTX-I, P1NP and CTX-I/P1NP ratio of PsA and AS patients. Bars represent
median values. Results were analyzed with Kruskal-Wallis test. p values lower than 0.05 are considered
statistically significant. *p<0.05, **p<0.01. CTX-I – C-terminal telopeptide I; P1NP – Procollagen type 1 N propeptide.
sRANKL levels are very similar between groups, OPG levels are increased in PsA in comparison with controls (p=0.0195) as seen in Fig. 12. The sRANKL/OPG ratio seems to be lower in patients than in controls and there is a significant difference between PsA and AS patients (p=0.0357), PsA have lower levels than AS.
CTX-I
Healthy PsA AS
0 50 100 150 200 * Co n c e n tr a ti o n (n g /ml ) P1NP
Healthy PsA AS
0 200 400 600 800 1000 1200 1400 * Co n c e n tr a ti o n (n g /ml ) CTX-I/P1NP
Healthy PsA AS
Fig. 12 – Serum levels of sRANKL, OPG and sRANKL/OPG ratio of PsA and AS patients. Bars
represent median values. Results were analyzed with Kruskal-Wallis test. p values lower than 0.05 are
considered statistically significant. *p<0.05. sRANKL – soluble receptor activator of nuclear factor kappa-B ligand; OPG – osteoprotegerin.
In terms of the Wnt pathway inhibitors, DKK-1 and SOST, DKK-1 levels show a trend to be lower in controls but the difference was not statistically significant. SOST levels are significantly decreased in both patients’ groups (p<0.0001) as shown in Fig.13.
sRANKL
Healthy PsA AS
0 10 20 50 60 Co n c e n tr a ti o n(p g /mL ) OPG
Healthy PsA AS
0 50 100 150 * Co n c e n tr a ti o n (p g /mL ) sRANKL/OPG
Healthy PsA AS
Fig. 13 - Serum levels of DKK-1 and SOST of PsA and AS patients. Bars represent median values.
Results were analyzed with Kruskal-Wallis test. p values lower than 0.05 are considered statistically
significant. ****p<0.0001. DKK-1 – dickkopf-related protein 1; SOST – sclerostin.
Pro-inflammatory cytokines, IL-22 and IL-23 were also evaluated. IL-22 levels seem to be lower in patients but this difference was not statistically significant. IL-23 level distribution is very similar in each group. PGE2 tend to be decreased in patients, comparing to controls but once again there is no significance. Healthy controls in this group are only 12, the same 12 used for paired PsA samples comparisons. The demographic characteristics can be found in Table I in ANNEX IV.
When comparing paired PsA before and after NSAID therapy, there is no statistical significance in any of the assessed parameters. CTX-I and P1NP levels in paired PsA samples are very similar, but CTX-I control levels are higher than PsA, as observed in the general population of this study and P1NP are lower (Fig. 15). The ratio CTX/P1NP in healthy controls is also increased when comparing with patients.
DKK-1
Healthy PsA AS
0 500 1000 1500 Co n c e n tr a ti o n(p g /mL ) SOST
Healthy PsA AS
Fig. 14 - Serum levels of IL-22, IL-23 and PGE2 of PsA and AS patients. Bars represent median values.
Results were analyzed with Kruskal-Wallis test. p values lower than 0.05 are considered statistically
significant. IL – interleukin; PGE2 – prostaglandin E2.
sRANKL and OPG levels, before and after NSAID therapy, are constant and when comparing with controls the values do not vary, as shown in Fig. 16. The sRANKL/OPG ratio do not display any statistical significance.
IL-22
Healthy PsA AS
0 1 2 3 4 5 10 15 C o n c e n tr a ti o n ( p g /m L ) IL-23
Healthy PsA AS
0 20 40 60 80 100 200 400 600 800 C o n c e n tr a ti o n ( p g /m L ) PGE2
Healthy PsA AS
Fig. 15– Serum levels of CTX-I, P1NP and CTX-I/P1NP ratio of paired PsA patients before and after NSAID therapy. Bars represent median values. Results were analyzed with Wilcoxon matched pairs test.
p values lower than 0.05 are considered statistically significant. sRANKL – soluble receptor activator of
NF-kB; OPG – osteoprotegerin; NSAID – non-steroidal anti-inflammatory drug.
Regarding Wnt pathway inhibitors, DKK-1 and SOST levels before and after NSAID therapy are not statistically significant. DKK-1 levels do not differ with significance from controls. SOST levels seem to be increased in healthy controls in comparison with patients (Fig. 17).
Pro-inflammatory cytokines, IL-22 and IL-23 also have similar levels of protein quantification before and after NSAID therapy. Controls in both cytokines have a disperse pattern with no statistical significance (Fig. 18). PGE2 levels seem to be the same or higher after therapy and healthy controls also have a disperse pattern.
CTX-I
Before After Healthy 0 20 40 60 80 500 1000 1500 NSAID Therapy Co n c e n tr a ti o n ( n g /m L ) P1NP
Before After Healthy
0 100 200 300 400 500 NSAID Therapy C o n c e n tr a ti o n ( n g /m l) CTX-I/P1NP
Before After Healthy 0.0 0.2 0.4 0.6 2 4 6 8 10
Fig. 16 - Serum levels of sRANKL, OPG and sRANKL/OPG ratio of paired PsA patients before and after
NSAID therapy. Bars represent median values. Results were analyzed with Wilcoxon matched pairs test.
p values lower than 0.05 are considered statistically significant. sRANKL – soluble receptor activator of
nuclear factor kappa-B ligand; OPG – osteoprotegerin; NSAID – non-steroidal anti-inflammatory drug.
Fig. 17– Serum levels of DKK-1 and SOST of paired PsA patients before and after NSAID therapy. Bars
represent median values. Results were analyzed with Wilcoxon matched pairs test. p values lower than
0.05 are considered statistically significant. DKK-1 – dickkopf-related protein 1; SOST – sclerostin; NSAID – non-steroidal anti-inflammatory drug.
sRANKL
Before After Healthy
0 5 10 15 20 30 40 50 60 NSAID Therapy C o n c e n tr a ti o n ( p g /m L ) OPG
Before After Healthy
0 50 100 150 200 NSAID Therapy C o n c e n tr a ti o n ( p g /m L ) sRANKL/OPG
Before After Healthy
0.0 0.2 0.4 0.6 0.8 NSAID Therapy DKK-1
Before After Healthy 0
500 1000 1500
NSAID The rapy
C o n ce n tr at io n ( p g /m L ) SOST
Before After Healthy 0 2 4 6 8 10 200 400 600 800 1000
NSAID The rapy
Fig. 18 - Serum levels of IL-22, IL23 and PGE2 of paired PsA patients before and after NSAID therapy.
Bars represent median values. Results were analyzed with Wilcoxon matched pairs test. p values lower
than 0.05 are considered statistically significant. IL – interleukin; PGE2 – prostaglandin E2; NSAID –
non-steroidal anti-inflammatory drug.
IL-22
Before After Healthy
0 1 2 3 4 5 10 20 30
NSAID The rapy
C o n c e n tr a ti o n ( p g /m L ) IL-23
Before After Healthy
0 50 100 150 200 250 NSAID Therapy C o n c e n tr a ti o n ( p g /m L ) PGE2
Before After Healthy
II. Osteoclast assays
This study was divided in two steps: IL-22 concentration optimization and celecoxib stimulation.
Sample characteristics
For the IL-22 part, the study included 4 healthy subjects, 2 men and 2 women. The median age of the subjects was 42 [37-49.25]. For the celecoxib part, the study included 3 healthy subjects, 2 men and 1 woman, and 2 PsA patients, 1 man and 1 woman. The median age of the controls was 39 [28-42] and the median age of patients was 39 [38-40]. PsA patients were not having any kind of therapy.
Pre-osteoclast, osteoclast and pit counts
After PBMC isolation, cells were cultured in different conditions and at each timepoint ex vivo functional assays were performed in unstimulated and stimulated
conditions at day 21 (Table II.1). Under these circumstances it is expected to see mature OCs and bone resorption at day 21 in stimulated conditions (Holloway et al. 2002).
Table II.1– Osteoclast cell culture conditions: unstimulated and stimulated.
OSTEOCLAST CELL CULTURE CONDITIONS IN VITRO
Unstimulated Stimulated
Mono (monocytes) M-CSF + RANKL
M-CSF IL-22 1 ng/mL + M-CSF
IL-22 10 ng/mL + M-CSF IL-22 50 ng/mL + M-CSF
IL-22 1 ng/mL + M-CSF + RANKL IL-22 10 ng/mL + M-CSF + RANKL IL-22 50 ng/mL + M-CSF + RANKL Celecoxib 1 ng/mL + M-CSF Celecoxib 10 ng/mL + M-CSF
Celecoxib 1 ng/mL + IL-22 (10 ng/mL) + M-CSF + RANKL Celecoxib 10 ng/mL + IL-22 (10 ng/mL) + M-CSF + RANKL
TRAP staining turns the cell cytoplasm reddish and allows to count the nuclei, since they remain white, unstained. In Fig. 19 it is possible to observe a representative image of pre-OC and OC counting. Pre-OCs are defined as cells with less than 3 nuclei and OCs with 3 or more nuclei.
Fig. 19 – Representative image of pre-OCs (red arrows) and OCs (green arrows) with TRAP staining.
Scale bar corresponds to 100 µm.
In resorption assays, pits are acidic structures with purple/blue appearance after being incubated with toluidine blue. In Fig. 20 is shown a representative image of resorption pits in a stimulated condition.
Fig. 20 – Representative image of resorption pits (red arrows) with toluidine blue staining. Scale bar
Without stimuli, cells should not develop mature osteoclasts neither resorption pits. Cells in the presence of a stimuli for osteoclastogenesis will develop osteoclasts and these osteoclasts will resorb bone. In Fig. 21 is visible the difference between unstimulated conditions (Mono and M-CSF) and a stimulated condition (M-CSF+RANKL).
Fig. 21– Pre-OCs (red arrows in TRAP staining), OCs (green arrows) and resorption pits (red arrows in
toluidine blue staining) under stimulated and unstimulated conditions at day 21. Scale bar corresponds to 100 µm.
In the IL-22 concentration optimization part, the number of pre-OC, OC and nuclei per OC was counted. In pre-OC number there is an increase in IL-22 at 1 ng/mL, in IL-22 at 50 ng/mL and in IL-22 at 10 ng/mL with and without RANKL, when comparing to positive control M-CSF and RANKL. All conditions had higher number of pre-OC than mono condition (Fig. 22). OC number is higher in M-CSF than in all the other conditions, followed by IL-22 at 10 ng/mL. Nuclei number per OC have a similar pattern in all conditions as shown in Fig. 22.
TRAP
PIT