The molecular structure of the borate mineral inderite
Mg(H
4
B
3
O
7
)(OH)
5H
2
O – A vibrational spectroscopic study
Ray L. Frost
a,⇑, Andrés López
a, Yunfei Xi
a, Rosa Malena Fernandes Lima
b, Ricardo Scholz
c,
Amanda Granja
ca
School of Chemistry, Physics and Mechanical Engineering, Science and Engineering Faculty, Queensland University of Technology, GPO Box 2434, Brisbane, Queensland 4001, Australia
bMining Engineering Department, School of Mines, Federal University of Ouro Preto, Campus Morro do Cruzeiro, Ouro Preto, MG 35400-00, Brazil cGeology Department, School of Mines, Federal University of Ouro Preto, Campus Morro do Cruzeiro, Ouro Preto, MG 35400-00, Brazil
h i g h l i g h t s
Inderite Mg(H4B3O7)(OH)5H2O is a
hydrated hydroxy borate mineral of magnesium.
We have studied inderite by elcctron probe, thermogravimetry and vibrational spectroscopy.
The mineral decomposes at 137.5°C. Raman bands are observed at 3052,
3233, 3330, 3392 attributed to water stretching vibrations.
Vibrational spectroscopy enables the assessment of its molecular structure.
g r a p h i c a l
a b s t r a c t
a r t i c l e
i n f o
Article history:
Received 13 March 2013
Received in revised form 23 June 2013 Accepted 28 June 2013
Available online 6 July 2013
Keywords:
Inderite Borate
Raman spectroscopy Infrared
Pinnoite
a b s t r a c t
We have undertaken a study of the mineral inderite Mg(H4B3O7)(OH)5H2O a hydrated hydroxy borate
mineral of magnesium using scanning electron microscopy, thermogravimetry and vibrational spectro-scopic techniques. The structure consists of½B3O3ðOHÞ52soroborate groups and Mg(OH)2(H2O)4
octahe-dra interconnected into discrete molecules by the sharing of two OH groups. Thermogravimetry shows a mass loss of 47.2% at 137.5°C, proving the mineral is thermally unstable. Raman bands at 954, 1047 and 1116 cm1are assigned to the trigonal symmetric stretching mode. The two bands at 880 and 916 cm1
are attributed to the symmetric stretching mode of the tetrahedral boron. Both the Raman and infrared spectra of inderite show complexity. Raman bands are observed at 3052, 3233, 3330, 3392 attributed to water stretching vibrations and 3459 cm1with sharper bands at 3459, 3530 and 3562 cm1assigned to
OH stretching vibrations. Vibrational spectroscopy is used to assess the molecular structure of inderite. Ó2013 Elsevier B.V. All rights reserved.
Introduction
Boron compounds are used in different ways by the industry, including the production of borosilicate glass, enamels, leather, detergents, cosmetics, insulation and textile-grade fibers, fire retardants, fertilizers, insecticides, disinfectants, drugs, alternative energy source and nuclear technology[1–4]. In recent years, the
interest for magnesium borates is increasing. Such compounds shows potential applications as catalysts for the conversion of hydrocarbons, luminescent materials, cathode ray tube screens, X-ray screens, electro conductive treating agent, reinforcing agent for plastics and for the production of magnesium diboride[5,6]. Approximately 60% of world boron ores are located in Turkey, mainly in Anatolia. Boron is founds in borates of metals, especially of calcium and sodium[7].
The mineral inderite Mg(H4B3O7)(OH)5H2O[8] is a hydrated
hydroxy borate mineral of magnesium [9,10] and was first
1386-1425/$ - see front matterÓ2013 Elsevier B.V. All rights reserved. http://dx.doi.org/10.1016/j.saa.2013.06.108
⇑Corresponding author. Tel.: +61 7 3138 2407; fax: +61 7 3138 1804.
E-mail address:[email protected](R.L. Frost).
Contents lists available atScienceDirect
Spectrochimica Acta Part A: Molecular and
Biomolecular Spectroscopy
described from Inder deposit, Kazakhstan[11]. The mineral was also described from a number of localities, including Inyo Co., Cal-ifornia, USA[12]and Kirka borate deposit, Turkey[13].
The mineral is monoclinic[10,14]with Point Group: 2/m. The cell data is space group: P21/a with a= 12.0350(9),
b= 13.1145(13),c= 6.8221(3) andb= 104.552(8) andZ= 4. The structure consists of½B3O3ðOHÞ52 soroborate groups and
Mg(OH)2(H2O)4octahedra interconnected into discrete molecules
by the sharing of two OH groups[10]. The fifth H2O molecule is
placed in the spaces between these molecular units. The structure is held together by hydrogen bonds. Inderite is a member of the homonymous group that also includes inderborite – CaMg(H3B
3-O7)8H2O, inyoite – Ca(H4B3O7)(OH)4H2O, kurnakovite – Mg(H4B
3-O7)(OH)5H2O, meyerhofferite – Ca(H4B3O7)4H2O and solongoite –
Ca2(H4B3O7)(OH)Cl.
To the best knowledge of the authors, data about vibrational spectroscopic characterization of inderite are restricted to the database of the University of Arizona (rruff.info); however no interpretation is given. In recent years, the application of spectro-scopic techniques to understand the structure of borates has been increasing. Vibrational spectroscopy has been applied to borate glasses[15]. The number of vibrational spectroscopic studies of bo-rate minerals is quite few[16,17]. The number of Raman studies of borate minerals is also very limited[18]. There have been a num-ber of infrared studies of some natural borates[19,20].
In this work, a sample of the mineral inderite from the Inyo Co., located in the Death Valley, California, USA, was selected for anal-ysis. Studies include chemistry via Scanning Electron microscope (SEM) in the EDS mode, spectroscopic characterization of the struc-ture with infrared and Raman spectroscopy. Thermogravimetric study was carried out to determine the thermal stability of the mineral.
Experimental
Samples description and preparation
The inderite sample studied in this work was obtained from the collection of the Geology Department of the Federal University of Ouro Preto, Minas Gerais, Brazil, with sample code SAB-072. The sample is from the type locality for the mineral, the Inyo Co., lo-cated in the Death Valley, California, USA.
The borate mineral deposit in the Death Valley is related to the Miocene-Pliocene Furnace Creek Formation, deposited in marginal lacustrine and lacustrine environments in an extensional setting. The bedded borate facies comprises bodies of borate, mainly cole-manite. Other minerals are ulexite, probertite, gypsum and anhy-drite [21]. The sample was gently crushed and the associated minerals were removed under a stereomicroscope Leica MZ4. Scanning electron microscopy (SEM) and backscattering images (BSI) were obtained to ensure the purity of the selected fragment. Qualitative chemical analysis was applied to support the mineral characterization.
Scanning electron microscopy (SEM)
Experiments and analyses involving electron microscopy were performed in the Center of Microscopy of the Universidade Federal de Minas Gerais, Belo Horizonte, Minas Gerais, Brazil (http:// www.microscopia.ufmg.br).
Inderite crystals were coated with a 5 nm layer of evaporated carbon. Secondary Electron and Backscattering Electron images were obtained using a JEOL JSM-6360LV equipment. Qualitative and semi-quantitative chemical analyses in the EDS mode were
performed with a ThermoNORAN spectrometer model Quest and was applied to support the mineral characterization.
Thermogravimetric analysis – TG/DTG
TG/DTG analysis of the inderite were obtained by using TA Instruments Inc. Q50 high-resolution TGA operating at a 10°C/
min ramp with data sample interval of 0.50 s/pt from room tem-perature to 1000°C in a high-purity flowing nitrogen atmosphere
(100 cm3/min). A total mass of 23.29 mg of finely ground samples
were heated in an open platinum crucible.
Raman microprobe spectroscopy
Crystals of inderite were placed on a polished metal surface on the stage of an Olympus BHSM microscope, which is equipped with 10, 20, and 50objectives. The microscope is part of a Reni-shaw 1000 Raman microscope system, which also includes a monochromator, a filter system and a CCD detector (1024 pixels). The Raman spectra were excited by a Spectra-Physics model 127 He–Ne laser producing highly polarized light at 633 nm and col-lected at a nominal resolution of 2 cm1 and a precision of
±1 cm1in the range between 200 and 4000 cm1. Repeated
acqui-sitions on the crystals using the highest magnification (50) were accumulated to improve the signal to noise ratio of the spectra. Ra-man Spectra were calibrated using the 520.5 cm1line of a silicon
wafer. The Raman spectrum of at least 10 crystals was collected to ensure the consistency of the spectra.
An image of the inderite crystals measured is shown in the sup-plementary information as Fig. S1. Clearly the crystals of inderite are readily observed, making the Raman spectroscopic measure-ments readily obtainable.
Infrared spectroscopy
Infrared spectra were obtained using a Nicolet Nexus 870 FTIR spectrometer with a smart endurance single bounce diamond ATR cell. Spectra over the 4000–525 cm1 range were obtained
by the co-addition of 128 scans with a resolution of 4 cm1and a
mirror velocity of 0.6329 cm/s. Spectra were co-added to improve the signal to noise ratio. The infrared spectra are given in the Sup-plementary information.
Spectral manipulation such as baseline correction/adjustment and smoothing were performed using the Spectracalc software package GRAMS (Galactic Industries Corporation, NH, USA). Band component analysis was undertaken using the Jandel ‘Peakfit’ soft-ware package that enabled the type of fitting function to be se-lected and allows specific parameters to be fixed or varied accordingly. Band fitting was done using a Lorentzian–Gaussian cross-product function with the minimum number of component bands used for the fitting process. The Gaussian–Lorentzian ratio was maintained at values greater than 0.7 and fitting was under-taken until reproducible results were obtained with squared corre-lations ofr2greater than 0.995.
Results and discussion
Chemical characterization
The pattern for the thermogravimetric analysis is presented in Fig. 1. The TG curve shows a total mass loss of around 47.20% on heating to 1000°C. This result is in agreement with the theoretical
composition of the mineral. A large mass loss was observed at 137.5°C, attributed to the loss of water and some hydroxyl units.
Some previous studies on inderite have been undertaken[5]and have shown that the mechanism of dehydration is due to random nucleation.
Vibrational spectroscopy
The Raman spectrum of inderite over the 100–4000 cm1
spec-tral range is shown inFig. 2(a). This spectrum shows the position and relative intensity of the bands over the full wavenumber range. It is apparent that there are large parts of the spectrum where no intensity is found and therefore, the spectrum is subdivided into
sections based upon the type of vibration being studied. The Ra-man spectrum shows intensity in the hydroxyl stretching region. The infrared spectrum of inderite over the 500–4000 cm1spectral
range is displayed inFig. 2(b). This figure shows the position and relative intensity of the infrared bands. Again, there are parts of the spectrum where no intensity is observed and thus, the spec-trum is subdivided into sections based upon the type of vibration being observed.
As Ross rightly points out the spectra of borate minerals de-pends heavily on the possible anions in the mineral[22]. The coor-dination polyhedron around the boron atom will be either a triangle or a tetrahedron. In the case of inderite, the structure con-sists of linked triangles and tetrahedra. Thus, for inderite the vibra-tional spectra of both structural units will be observed. The spectra of inderite are complex especially in the infrared spectrum. This is caused by the observation of bands due to four different coordina-tion polyhedra namely BO3
3 , B(OH)3, BO54, and BðOHÞ4.
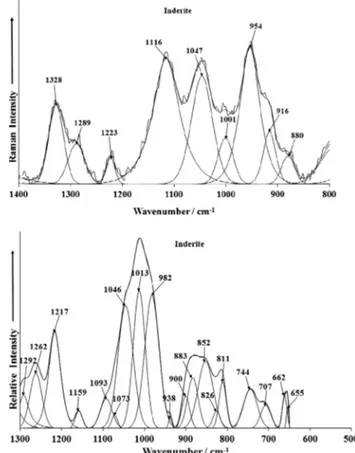
The Raman spectrum of inderite displays intense Raman bands at 954, 1047 and 1116 cm1with shoulders at 916 and 1001 cm1.
These bands are assigned to the trigonal symmetric stretching mode. The two bands at 880 and 916 cm1are attributed to the
symmetric stretching mode of the tetrahedral boron. A series of bands are found between 1200 and 1500 cm1. Raman bands are
observed at 1223, 1289 and 1328 cm1. According to Ross [22]
(page 220 of this reference), bands between 1300 and 1500 cm1
are due to the antisymmetric stretching modes of trigonal boron. This is perhaps confirmed by the intensity of the infrared bands in the 1300 to 1500 cm1region. Infrared bands (Fig. 3(b)) are
ob-served at 1347, 1389, 1414 and 1455 cm1. The Raman bands at
1213, 1245 and 1281 cm1 are assigned to OH in-plane bending [22]. Infrared bands are found at 1217, 1262 and 1292 cm1and
may be attributed to this vibrational mode. A series of infrared bands are observed at 982, 1013, 1046 and 1093 cm1. These bands
Fig. 1.TG graphic of inderite from 25 to 1000°C.
Fig. 2.(a) Raman spectrum of inderite over the 100–4000 cm1spectral range and
(b) infrared spectrum of inderite over the 500–4000 cm1spectral range.
Fig. 3.(a) Raman spectrum of inderite over the 800–1400 cm1spectral range and
may be attributed to the symmetric stretching modes of tetrahe-dral boron.
The Raman spectrum of inderite in the 300–800 cm1region is
illustrated inFig. 4aand the Raman spectrum in the 100–300 cm1
spectral region is shown inFig. 4b. The Raman spectrum is domi-nated by an extremely intense sharp band at 630 cm1with bands
of lower intensity at 558 and 592 cm1. These bands are attributed
to the bending modes of trigonal and tetrahedral boron. The band is not observed in the infrared spectrum, where some low intensity bands are found at 570, 580, 602 and 616 cm1, which may be
as-signed to this vibrational mode.
A series of Raman bands are observed at 739 and 788 cm1.
These bands may be assigned to the out-of-plane BOH bending modes. The intensity of these bands is significantly higher in the infrared spectrum (Fig. 3(b)), which is expected. Infrared bands are found at 655, 662, 707, 744 and 766 cm1. The infrared bands
at 811, 826, 852 and 883 cm1may be assigned to the symmetrical
stretching of tetrahedral boron. There have been some studies of the infrared spectra of hydrated borates[20,23]24. In this work, it was concluded that that borate minerals could not be identified by their infrared spectra. The Raman spectrum of inderite in the 100–300 cm1 region is illustrated inFig. 6(b). Raman bands are
observed at 171, 192, 232, 256 cm1with less intense bands at
135, 151 and 284 cm1. These bands are simply described as lattice
modes.
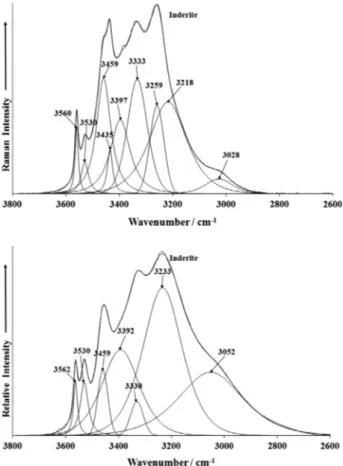
The Raman and infrared spectra of inderite over the 2600– 3800 cm1spectral range is displayed inFig. 5. Raman bands are
observed at 3052, 3233, 3330, 3392 and 3459 cm1with sharper
bands at 3459, 3530 and 3562 cm1. The first set of five bands is
attributed to water stretching vibrations. The latter three bands are assigned to OH stretching vibrations. The observation of
multiple bands fits well with the structure of inderite. The struc-ture consists of½B3O3ðOHÞ5
2soroborate groups and Mg(OH)
2(H
2-O)4 octahedra interconnected into discrete molecules by the
sharing of two OH groups. The fifth H2O molecule is placed in
the spaces between these molecular units. The Raman spectrum shows that there are non-equivalent water molecules in the inde-rite structure. There are different structural units in the structure of inderite. Thus, there are two different types of hydroxyl units and this results in multiple bands attributed to the OH units at 3435, 3459, 3530 and 3560 cm1.
In some ways the infrared spectrum resembles the Raman spec-trum in profile. Intense infrared bands are observed at 3052, 3233, 3330 and 3392 cm1and are assigned to water stretching
vibra-tions. The infrared bands at 3459, 3530 and 3562 cm1 are
attributed to the stretching vibrations of the OH units associated
Fig. 4a.Raman spectrum of inderite over the 300–800 cm1spectral range.
Fig. 4b.Raman spectrum of inderite over the 100–300 cm1spectral range.
Fig. 5.(a) Raman spectrum of inderite over the 2600–4000 cm1spectral range and
(b) infrared spectrum of inderite over the 2600–4000 cm1spectral range.
with the ½B3O3ðOHÞ52 soroborate groups and Mg(OH)2(H2O)4
units.
The infrared spectrum of inderite in the 1300–1800 cm1
spec-tral range is illustrated inFig. 6. In this figure two infrared bands are observed at 1641 and 1684 cm1, attributed to water bending
modes. The position of the infrared bands both in the hydroxyl stretching region and in the water bending region support the con-cept of strong hydrogen bonding in the structure of inderite. It is reasonable that the water bending modes are not observed in the Raman spectrum. This is because the Raman scattering of water is very low.
Conclusions
The combined chemical characterization of inderite via SEM, EDS and TG shows a pure phase with limited cationic substitution of Mg by Ca. Thermal analysis of inderite shows a large mass loss at 137.48°C and is thermally unstable.
The structure of inderite consists of½B3O3ðOHÞ52 soroborate
groups and Mg(OH)2(H2O)4octahedra interconnected into discrete
molecules by the sharing of two OH groups and is held together by hydrogen bonds.
Aspects of the structure of inderite may be demonstrated by vibrational spectroscopy. The spectra of borate minerals depend heavily on the possible anions in the mineral. In the case of inde-rite, the structure consists of linked triangles and tetrahedra. Thus, for inderite the vibrational spectra of both structural units will be observed. The spectra of inderite are complex especially in the infrared spectrum. This is caused by the observation of bands due to four different coordination polyhedra namely BO3
3 ,
B(OH)3, BO54, and BðOHÞ4.
Acknowledgements
The financial and infra-structure support of the Discipline of Nanotechnology and Molecular Science, Science and Engineering Faculty of the Queensland University of Technology, is gratefully acknowledged. The Australian Research Council (ARC) is thanked
for funding the instrumentation. The authors would like to acknowledge the Center of Microscopy at the Universidade Federal de Minas Gerais (http://www.microscopia.ufmg.br) for providing the equipment and technical support for experiments involving electron microscopy. R. Scholz thanks to CNPq – Conselho Nacional de Desenvolvimento Científico e Tecnológico (Grant No. 306287/ 2012-9). A. Granja offers thanks to FAPEMIG – Fundação de Ampar-o à Pesquisa dAmpar-o EstadAmpar-o de Minas Gerais.
Appendix A. Supplementary material
Supplementary data associated with this article can be found, in the online version, athttp://dx.doi.org/10.1016/j.saa.2013.06.108.
References
[1]K. Othmer, Encyclopedia of Chemical Technology, John Wiley, New York, 1978. [2]G. Gündüz, A. Usanmaz, J. Nucl. Mater. 140 (1986) 44–55.
[3]M. Özdemir, I. Kipçak, Min. Eng. 23 (2010) 685–690.
[4]F. Demir, G. Budak, R. Sahin, A. Karabulut, M. Oltulu, A. Un, Ann. Nucl. Eng. 38 (2011) 1274–1278.
[5]A.K. Figen, M.S. Yilmaz, S. Piskin, Mater. Char. 61 (2010) 640–647.
[6]E.M. Elssfah, A. Elsanousi, J. Zhang, H.S. Song, C. Tang, Mater. Lett. 61 (2007) 4358–4361.
[7]M. Alkan, M. Dogan, Chem. Eng. Proc. 43 (2004) 867–872.
[8]C. Frondel, V. Morgan, J.L.T. Waugh, Am. Mineral. 41 (1956) 927–928. [9]A.M. Boldyreva, Mem. Soc. Russe Min. 66 (1937) 651–672.
[10]E. Corazza, Acta Cryst. B32 (1976) 1329–1333. [11]M.N. Godlevsky, Zap. Vser. Min. Ob. 66 (1937) 315–344.
[12]R.C. Erd, J.F. McAllister, G.D. Eberlein, Am. Mineral. 64 (1979) 369–375. [13]H. Cahit, R.N. Alonso, Turk. J. Earth Sci. 9 (2000) 1–27.
[14]I.M. Rumanova, A. Ashirov, Krist. 8 (1963) 517–532.
[15]I. Ardelean, S. Cora, J. Optoelect. Adv. Mater. 12 (2010) 239–243. [16]M. Mir, J. Janczak, Y.P. Mascarenhas, J. Appl. Cryst. 39 (2006) 42–45. [17]I. Mitov, Z. Cherkezova-Zheleva, V. Mitrov, J. Balkan Trib. Ass. 4 (1998) 191–
200.
[18]R.L. Frost, J. Raman Spectrosc. 42 (2011) 540–543. [19]A. Vasko, I. Srb, Czech. J. Phys. 17 (1967) 1110–1123. [20]C.E. Weir, J. Res. Nat. Bur. Standards A70 (1966) 153–164. [21]L.H. Tanner, Sed. Geol. 148 (2002) 259–273.
[22] V.C. Farmer, Mineralogical Society Monograph 4: The Infrared Spectra of Minerals, London, 1974.