350 Rev Bras Med Esporte – Vol. 17, No 5 – Set/Out, 2011
Response of the Resting Metabolic Rate after 16 Weeks
of Resistance Training in Postmenopausal Women
Valéria Bonganha1,2
Miguel Soares Conceição1,2
Mara Patrícia Traina Chacon-Mikahil2,3
Vera Aparecida Madruga2,3
1. Post-Graduation Program FEF/Unicamp.
2. Laboratory of Exercise Physiology – FISEX.
3.Physical Education College – State University of Campinas.
Mailing address:
Laboratório de Fisiologia do Exercício - FISEX - Faculdade de Educação Física/Universidade Estadual de Campinas Unicamp Av. Érico Veríssimo, 701. 13083-851 – Caixa Postal 6134 Campinas, SP, Brazil.
E-mail: [email protected]
ABSTRACT
Introduction: The physical changes from menopause such as decrease in lean mass (LM), growth and redistribution of body fat and decrease in resting energy expenditure, contribute to the increase in body size and subsequent increase in total body mass. Accordingly, the recognized benefits of resistance training (RT) are not only linked to increased strength and muscle hypertrophy, but also to body composition and consequently to the resting metabolic rate (RMR). Objective: To evaluate the RMR response after 16 weeks of RT in postmenopausal women. Methods: 28 female volunteers subdivided into two groups participated in the study: training (TG n = 17) and control (CG n = 11). The RT program was conducted in three weekly sessions, on alternate days and lasted approximately 60 min/session during 16 weeks. Load intensity was determined by means of target area of maximum repetitions, with weekly load readjustment. The oxygen consumption ( O2) and carbon dioxide production ( CO2), using open circuit indirect calorimetry was used to
calculate the RMR according to Weir equation (1949). Statistical analysis: statistical package Bioestat, version 5.0, with a significance level of p <0.05 was used. Results: There was significant increase of the LM values and muscle strength in TG only. No significant differences were found for the RMR values after intervention for both groups. Conclusion: The RT program of 16 weeks was effective in promoting changes in body composition and muscle strength in postmenopausal women; nevertheless, there was not change in RMR after intervention.
Keywords: menopause, body composition, energy expenditure, strength training.
INTRODUCTION
Aging process inevitably occurs to men and women. However, for women the effects become more remarkable with the occurrence of menopause(1).
The body alterations derived from menopause such as decrease of lean mass (LM), increase and redistribution of body fat and decrease of resting energy expenditure, contribute to the increase in the body dimensions and subsequent increase of total body mass (TBM)(2,3).
Increase in TBM, besides increasing risk of obesity, is associated with higher incidence of cardiovascular diseases, dyslipidemias and other comorbidities, especially when associated to physical inactivity(4).
It has been observed among the strategies to reduce or revert the effects of the aging physiological processes the practice of regular physical exercises(5). Considering this strategy,
the recognized benefits of resistance training (RT) are not only connected to the increase of muscle strength and hypertrophy(6),
but also to the body composition(7,8) and, consequently, in the
resting metabolic rate (RMR)(9).
Therefore, the proposal of the present study was to assess the RMR response after 16 weeks of RT in postmenopausal women.
METHODS
Sample
28 female volunteers subdvided in two groups participated in this research: training group (TG; n = 17) and control group (CG; n = 11). The volunteers were clinically healthy and were in post-menopause
(minimum absence of 12 months of menstruation), did not make use of any kind of hormone replacement therapy and were not physically active.
All volunteers after having been told about the study aims and procedures which they would be submitted to, signed the Free and Clarified Consent Form.
The study was approved by the Ethics in Research Committee of the State University of Campinas, according to the norms of the Resolution 196/96 of the National Health Board on research involving humans under the protocol # 248/2004, with addition in 2007.
Procedures
Anthropometry was evaluated with measurements of the TBM, stature and waist circumference (WC).
Body composition was obtained by the skinfolds thickness measurement technique, with a calibrated adipometer (LANGE). Anthropometry and body composition were assessed according to procedures described by Heyward and Stolarczyk(10).
Body density was obtained by the generalized formula proposed by Jackson and Pollock(11) and transformed in fat
percentage (%F) through the Siri’s formula(12) and the fat mass
(FM) and the LM values were estimated(13).
The modification of the components of body composition may influence the RMR values; therefore, the total RMR was calculated relative by the total body mass (TBM) and the lean mass (LM). Correlations between the body composition components and the RMR were performed at the initial and final moments of the study for justifying the correlation between these variables.
ORIGINAL ARTICLE
351
Rev Bras Med Esporte – Vol. 17, No 5 – Set/Out, 2011
One repetition maximum test (1-RM)
The muscle strength indicators were determined by the one repetition maximum test (1-RM) in three exercises: bench press, leg press and biceps curl(14). A familiarization protocol was applied
to the training protocol in the phase prior to the 1-RM evaluation protocols with the purpose to not underestimate the results obtained(15). Muscle strength was assessed in this study, although
these values have not been used in the training prescription to show its efficiency.
Evaluation of the resting metabolic rate
The RMR was determined through the oxygen consumption ( O2) and carbon dioxide production ( CO2), using indirect
calorimetry of open circuit by the gas analysis system (Ultima CPX, MedGraphics,USA) and calculated in daily values (kcal/day) by the Weir equation (16): RMR = [(3.941 * O
2) + (1.106 * CO2)]
* 1.440, where: O2 = mean consumed value (liters/minute)
and CO2 = mean expired value (liters/minute). The test was
performed in the Laboratory of Exercise Physiology (FISEX) of the Physical Education College of Unicamp, in laboratory conditions and after a fasting period of 12 hours. For this test, the volunteers used a facial mask connected to the gas analyzer, remaining in silence, at supine position, avoiding movement and sleeping during 30 min, so that breath after breath could be obtained. The gas analyzer was calibrated before each test. In order to have the RMR calculated, the 10 initial min were discarded for stabilization of the physiological variables in the resting position.
Training program
The RT was divided in two phases: first phase (P1) and second phase (P2). The phases were different in intensity, order and exercise prescription, as detailed: in E1, the exercises prescription was alternated by segments, with three sets of 10 repetitions maximum (RM) with one-minute pause between them; and E2 was prescribed in a localized manner by articulation with three sets of eight RM and one-minute and 30 s interval between sets. This prescription followed the recommendations of the studies presented by the ACSM(17).
The load intensity was determined through the target zone of the RM and not in percentage values of 1-RM(18), with weekly
load readjustment.
The proposed exercises in the E1 and E2 were: 1) extensor table; 2) flexor table; 3) free horizontal bench press; 4) front pulley; 5) elbow flexion; 6) elbow extension; 7) leg press; 8) lateral fly; 9) abdominals and 10) calves. For the abdominal exercises and calves three sets 15 repetitions were prescribed during the entire experimental period.
The RT was performed in three weekly sessions, in alternated days and with approximate duration of 60 min/session, during 16 weeks. The volunteers were supervised by physical education teachers during the entire experimental period, so that each teacher could follow a maximum of three volunteers at the same time.
Statistical treatment
Data normality was verified by the Shapiro-Wilk test. In order to have the RT effects in both groups at the initial and final moments (IM = initial moment and FM = final moment) on the
RMR and the body composition the two-way ANOVA was used, variables which presented normal distribution.
In order to analyze the muscular strength results the Kruskal-Wallis test was used, due to the lack of data normality.
Pearson correlation was used to assess the correlation between the RMR and body composition and age variables.
All analyses used the statistical package Bioestat, version 5.0, with significance level of p < 0.05.
RESULTS
No significant difference was found in the body composition, age, stature and WC components when the TG and CG were compared. However, during the study, significant increase (p ≤ 0.05) for the LM values in the TG and significant decrease (p ≤ 0.05) of the LM values in the CG was observed (Table 1).
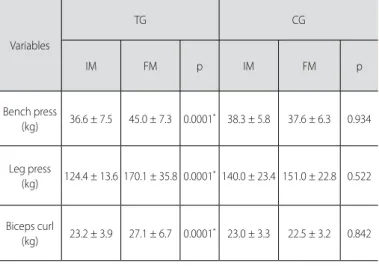
Indicators of muscular strength presented significant increase (p < 0.05) of the values in the three assessed exercises after the intervention only for the TG. No significant difference was found for the CG, nor in the comparison between groups (Table 2).
The absolute and relative RMR values to the body composition did not show significant alterations (p < 0.05) between IM and FM for both groups.
Concerning the absolute RMR, there was increase of 6.1% for the TG and decrease of about 2.5% for the CG in the same period. In the RMR concerning the LM, there was approximate increase of 2% for the TG and decrease of 4.5% for the same variable in the CG during the evaluated period. The RMR concerning the TBM suffered increase of 5% in the TG and decrease of 1.3% for the CG (Table 3).
Positive and significant correlation was found between RMR and the WC, TBM and LM values in the TG between the IM and FM and negative significant between the RMR and age in the IM of the TG. No significant corelation was found in the CG (Table 4).
Table 1. Mean and standard deviation, age, stature, waist circumference and body composition components values between groups (TG and CG) in the moments (IM and FM) of the study.
Variables
TG CG
IM FM p IM FM p
Age (yeras) 54.7±3.9 --- 52.7 ± 7.2
---Stature (m) 1.56±0.05 --- 1.60 ± 0.03
---WC (cm) 79.3 ± 8.5 80.3 ± 7.6 0.351 80.3 ± 6.8 81.4 ± 6.1 0.383
TBM (kg) 63.5 ± 7.6 64.1 ± 7.6 0.23 69.1 ± 10.1 68.8 ± 10.0 0.976
BMI (kg/m2) 25.7 ± 2.6 26.0 ± 2.4 0.651 26.8 ± 3.3 26.7 ± 3.4 0.983
LM (kg) 41.1 ± 4.1 42.5 ± 3.7 0.0002* 44.9 ± 5.0 43.4 ± 6.0 0.004*
352 Rev Bras Med Esporte – Vol. 17, No 5 – Set/Out, 2011
Table 2. Mean, standard deviation and percentage variation values (∆%) of the absolute resting metabolic rate concerning the body composition between groups (TG and CG) in the moments (IM and FM) of the study.
Variables
TG CG
IM FM p ∆% IM FM p ∆%
RMR (kcal/day)
989.9 ± 117.2
1.062.4 ±
146.2 0.45 6.1
1111.6 ± 138.2
1.083.7 ± 221.5 0.94 -2.5
RMR/LM
(kcal/kg/day) 23.2 ± 2.6 25.1 ± 2.5 0.94 5.0 24.8 ± 3.2 23.7 ± 5.7 0.80 -1.4
RMR/TBM
(kcal/kg/day) 15. 9 ± 1.9 16.8 ± 1.9 0.58 2.0 16.3 ± 2.7 16.1 ± 4.2 0.99 -4.5
* Signiicant diference (p < 0.05) between IM and FM.
Table 3. Mean and standard deviation values of the muscle strength indicators between groups (TG and CG) in the moments (IM and FM) of the study.
Variables
TG CG
IM FM p IM FM p
Bench press
(kg) 36.6 ± 7.5 45.0 ± 7.3 0.0001* 38.3 ± 5.8 37.6 ± 6.3 0.934
Leg press
(kg) 124.4 ± 13.6 170.1 ± 35.8 0.0001* 140.0 ± 23.4 151.0 ± 22.8 0.522
Biceps curl
(kg) 23.2 ± 3.9 27.1 ± 6.7 0.0001* 23.0 ± 3.3 22.5 ± 3.2 0.842
Table 4. Correlation coefficient and determination coefficient among resting meta-bolic rate, body composition components, waist circumference and age.
Variables Moments
TG CG
r r2 (%) p r r2 (%) p
RMR x age
IM 0.550# 31.36 0.022 -0.114 1.29 0.312
FM -0.351 12.32 0.167 0.02 0.04 0.935
RMR x WC
IM 0.536* 28.40 0.027 0.035 0.12 0.919
FM 0.549* 30.10 0.022 -0.235 5.52 0.488
RMR x TBM
IM 0.560* 31.36 0.019 0.336 11.28 0.312
FM 0.594* 35.28 0.012 -0.151 2.28 0.659
RMR x LM
IM 0.570* 32.49 0.017 0.420 17.64 0.198
FM 0.657* 43.16 0.004 -0.118 1.39 0.729
* Signiicant positive correlation; # signiicant negative correlation.
DISCUSSION
RMR has been topic of many studies(9,19-22) where RT
importance was evidenced since it stimulates the increase of LM as strategy for increase of resting energetic cost and hence increase the RMR values.
The present study was conducted in a trial to investigate the RT influence (with hypertrophic characteristic), on the RMR in postmenopausal women during 16 weeks of intervention.
Reduction in the RMR occurs with age increase and due to alterations in the body composition caused by menopause(23).
From 20 years old, women present decrease of RMR of about 2% per decade, and decrease of LM has been reported as the body composition component of highest influence on this decrease(24).
After intervention with RT, significant increase of LM was found in the TG, showing that the training proposed was efficient in promoting alterations in body composition. These results corroborate other studies(7-9) confirming the efficiency of the RT
for this aim.
According to Hunter et al.(5), loss of LM is of only 5 to 10% in
ages between 20 and 50 years, but later, the additional loss is of 30-40% between 50 and 80 years.
The RT prescription by target zone of repetition maximum was efficient in increasing the values of the muscular strength indicators statistically significant after intervention in the group which participated in the training. Such results have also been found in the research by Silva et al.(6), who used prescription by
repetition target zone in elderly women.
Concerning both the RMR absolute and relative values evaluated in this study, significant increase has not been found for none of the studied groups. These studies confront the results published by Trevisan and Burini(9), who showed significant
increase in the RMR of postmenopausal women at the same intervention period.
Although there is similarity with the study by Trevisan and Burini(9) concerning the studied gender, type of exercise and time
of intervention involved, the age amplitude of the studied sample (elderly women) was higher than in the sample of this study (midlife women), and can cause disparity in the found results since elderly women present more fragile physical conditions concerning midlife women.
The research by Lemmer et al.(26) showed gender effect in the
RMR response after intervention with RT, whose results showed significant increase in RMR only in elderly men, even when the values were relativized by the LM.
The correlations evaluated in this study showed that the RMR estimation shows relation with the body composition components (TBM and LM),regardless of the training level.
The WC has been very much used as an indirect indicator of abdominal obesity. The significant correlation found between RMR and WC, in both moments in the TG, indicates that abdominal fat may influence on the RMR prediction, corroborating hence the studies by Luhrmann et al.(20).
However, the correlations between RMR and WC are not well-elucidated yet(20,27), and the results in this study are just
353
Rev Bras Med Esporte – Vol. 17, No 5 – Set/Out, 2011
Dionne et al.(28) after six months of RT in young and elderly
women, did not find significant alterations in the TBM, RMR and only a tendency of increase of LM.
The increase in LM in this study was not sufficient to promote increase of RMR after intervention, which leads us to a limitation and can point that the time of intervention would be insufficient to promote such adaptation.
Previous publishing(28,29) have shown reverse relation of RMR
with age. However, in this study negative significant correlation between RMR and age was only found in the IM in the TG, making us infer that for the studied sample, age was not a deter mining factor for decrease of RMR.
The menopause process by itself can significantly contribute to the decrease of RMR due to decrease in the production of female hormones(23).
Disparity of the RT effects for increase of RMR in post-menopausal women shows the need for further research.
REFERENCES
1. Jovine MS, Buchalla CM, Santarém EMM, Santarém, JMS, Aldrighi JM. Efeito do treinamento resistido sobre a osteoporose, após a menopausa: estudo de atualização. Epidemiol 2006;9:493-505. 2. Janssen I, Heymsfield SB, Ross R. Low relative skeletal muscle mass (sarcopenia) in older persons
is associated with functional impairment and physical disability. J Am Geriatr Soc 2002;50:889-96. 3. Sternfeld B, Bhat AK, Hua W, Sharp T, Quesenberry CP. Menopause, physical activity, and body
com-position/fat distribution in midlife women. Med Sci Sports Exerc 2005;37:1195-202.
4. NCEP executive summary of the Third Report of the National Cholesterol Education Program (NCEP) expert panel on detection, evaluation, and treatment of high blood cholesterol in adults (Adult Treatment Panel III). JAMA 2001;285:2486-97.
5. Hunter GR, Mccarthy JP, Bamman MM. Effects of resistance training on older adults. Sports Med 2004;34:329-48.
6. Silva CM, Gurjão ALD, Ferreira L, Gobbi LTB, Gobbi S. Efeito do treinamento com pesos, prescrito por zona de repetições máximas, na força muscular e composição corporal em idosas. Rev Bras Cineantropom Desempenho Hum 2006;8:39-45.
7. Maesta N. Nahas EAP, Nahas-Neto J, Orsatti FL, Fernandes C, Traiman P, Burini RC.Effects of soy protein and resistance exercise on body composition and blood lipids in postmenopausal women. Maturitas 2007;56:350-8.
8. Bocalini DS, Serra JS, Santos L, Murad N, Levy RF. Strength training preserves the bone mineral density of postmenopausal women without hormone replacement therapy. J. Aging Health 2009;21:519-27.
9. Trevisan MC, Burini RC. Metabolismo de repouso de mulheres pós-menopausadas submetidas a programa de treinamento com pesos (hipertrofia). Rev Bras Med Esporte 2007;13:133-7. 10. Heyward VH, Stolarczyk LM. Avaliação da Composição Corporal Aplicada. 10 Edição. São Paulo:
Manole, 2000.
11. Jackson AS, Pollock ML, WARD. Generalized equations for predicting body density of women. Med Sci Sports Exerc 1980;12:175-82.
12. Siri WE. Body composition from fluid spaces and density. In: Brozek J, Henschel A. Techniques for measuring body composition. Washington, DC: National Academy of Science, 1961. p. 223-44. 13. Guedes DP, Guedes JERP. Manual prático para avaliação em educação física. Barueri: Manole, 2006.
14. Clarke DH. Adaptations in strength and muscular endurance resulting from exercise. In: Wilmore JH (editor). Exercise Sports Sci Rev New York, Academic Press, 1973. p. 73-102.
15. Dias RMR, Cyrino ES, Salvador EP, Caldeira LFS, Fábio Yuzo Nakamura FY, Papst RR. et al. Influência do processo de familiarização para avaliação da força muscular em testes de 1-RM. Rev Bras Med Esporte 2005;11:34-8.
CONCLUSION
The postmenopausal women did not present significant increase after 16 weeks of RT. On the other hand, there was significant increase of muscular strength and LM, corroborating that RT is efficient in attenuating some alterations that the women at this age range suffer due to the deleterious effects of aging and menopause, promoting benefic adaptations to health.
ACKNOWLEDGEMENTS
We thank the Coordination of Improvement of Personnel of Higher Level (CAPES) for the post-graduation scholarship, as well as the National Board of Scientific and Technological Development (CNPq) for the granted research aid and post-graduation scholarship. We thank Professor José Rocha for the cardiological evaluations performed in the beginning of the project.
All authors have declared there is not any potential conflict of interests concerning this article.
16. Weir JB. New methods for calculating metabolic rate with especial references to protein metabolism. J Physiol 1949;62:20-7.
17. ACSM – American College of Sports Medicine. Position stand: progression models in resistance training for healthy adults. Med Sci Sports Exerc 2002;34:364-80.
18. Bird SP, Tarpenning KM, Marino FE. Designing resistance training programmes to enhance muscular fitness. A review of the acute programme variables. Sports Med 2005;35:841-51.
19. Byrne HK, Wilmore JH. The relationship of mode and intensity of training on resting metabolic rate in women. Int J Sport Nutr Exerc Metab 2001;11:1-14.
20. Luhrmann PM, Herbert BM, Neuhauser-Berthold M. Effects of fat mass and body composition on resting metabolic rate in the elderly. Metabolism 2001;50:972-5.
21. Antunes HKM, Hanna KM, Santos RF, Boscolo RA, Bueno OFA, Mello MT. Análise da taxa metabólica basal de idosos do sexo masculino antes e seis meses após exercícios de resistência. Rev Bras Med Esporte 2005;11:71-5.
22. Foreaux G, Pinto KMC, Dâmaso A. Efeito do consumo excessivo de oxigênio após exercício e da taxa metabólica de repouso no gasto energético. Rev Bras Med Esporte 2006;12:393-8.
23. Aubertin-Leheudre M, Goulet EDB, Dionne IJ. Enhanced rate of resting energy expenditure in women using hormone replacement therapy: preliminary results. J Aging Physical Activity 2008;16:53-60.
24. Day DS, Gozansky WS, Van Pelt RE, Schwarts RS, Kohrt WM. Sex hormones suppression reduces rest-ing energy expenditure and β-adrenergic support of restrest-ing energy expenditure. J Clin Endocrinol Metabolism 2005;90:3312-7.
25. Armellini F, zamboni M, Mino A, Bissoli L, Micciolo R, Bosello O. Postabsorptive resting metabolic rate and thermic effect of food in relation to body composition and adipose tissue distribution. Metabolism 2000;149:6-10.
26. Lemmer JT, Ivey FM, Ryan AS, Martel GF, Hurlbut DE, Metter JE, et al. Effect of strength training on resting metabolic rate on physival activity: age and gender comparisons. Med Sci Sports Exerc 2001;33:532-41.
27. Tataranni PA, Ravussin E. Variability in metabolic rate: biological sites of regulation. Int J Obes 1995;19:S102-6.
28. Dionne IJ, Mélançon MO, Brochu M, Ades PA, Poelhman ET. Age-related differences in metabolic adaptations following resistance training in women. Experimental Gerontology 2004;39:133-8.